


- Video
-
Club Roar
Captured a great grassroots sporting moment? We want to see it!Content Collections
The Roar Community
- Join
- Login
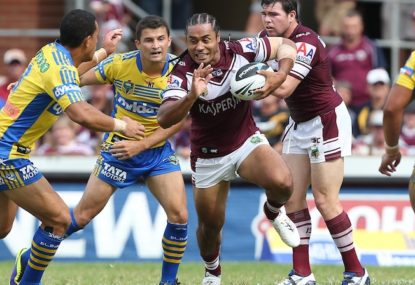
The mathematical chance of every outsider in last weekend’s NRL round covering their handicap is 255/1. Believe it or not, that is exactly what happened.
Many questions have been asked about the new rules and why has the market got it wrong.
With each game of footy we have a favourite, a second favourite and the least fancied team is given a handicap, or a point’s advantage, which is determined by the market.
Last weekend, eight out of eight second-favourite teams performed better than market expectations and ‘won’ with their allocated point advantage.
If we look at the initial three rounds, only four favoured team have won and covered their handicapped line, or of the 24 matches played the outsider has won covering 20 times – an amazing 83 per cent. It was only 33.3per cent for the same period last year.
|
NRL |
Line |
Fav |
2nd Fav |
Total |
% |
|
2014 |
Covered |
4 |
20 |
24 |
83.3 |
|
2013 |
Covered |
16 |
8 |
24 |
33.3 |
|
Round 3 |
Covered |
0 |
8 |
8 |
100.0 |
Let’s forget the handicap and just look at the results.
In 2013, only four outsiders won (16.7%) in the first three rounds, but this season 13 have been successful (54.2 per cent).
|
NRL |
Outsiders |
Fav |
2nd Fav |
Total |
% |
|
2014 |
Won |
11 |
13 |
24 |
54.2 |
|
2013 |
Won |
29 |
4 |
24 |
16.7 |
What does this mean?
My initial thoughts were the new rules have impacted the results and the market is still catching up. I had already included new parameters in my pre-game analysis that favours a faster game.
Brett Dvoracek, a statistical genius and data modeler, has written systems for most major sports worldwide, so I sent him my NRL figures.
“This is something that has happened in the past,” he said.
“Nothing drastic has changed; people tend to look at it too much. It is true that the outsider had an advantage up to 2011 in the NRL, but the market is a lot smarter now and the long term average is generally set around 50% over the last 400 games, that’s a sign of the future, tighter lines and higher market efficiency.”
Brett conceded that circumstances (like rule changes) can have a short term impact, but very few models can move themselves to change quickly.
“It comes down to the expert game analyst to make that dynamic decision making.”
Mmm… maybe NSW can finally win an Origin series now!
Reckon you can pick the winning team? Build your own dream team with Draftstars daily fantasy and compete on any match. For great odds on the NRL head on over to PlayUp. Imagine what you could be buying instead. Set a deposit limit.