


- Video
-
Club Roar
Captured a great grassroots sporting moment? We want to see it!Content Collections
The Roar Community
- Join
- Login
Recent piece “Who is the best team in AFL history?” was one of the most popular articles I’ve encountered in my time on The Roar and, naturally, I want to piggyback off its success to lift my own profile.
I also felt the urge to make a small contribution to the debate, using a statistical technique known as ‘Z-Scoring’ (its probably got a more fancy name, but this will suffice).
The numbers below are basically how well a team performs, both on the offensive and defensive side of things, in a particular season, adjusted for how excellent or otherwise that performance was in the context of the season.
Essentially what we’re trying to show is that a point scored in one season isn’t actually worth the same as a point scored in another season, due to different games styles, changes in the way matches are umpired, injuries and the like.
In saying that, looking at these high level numbers I’ve found the average points scored per team over the course of a season is remarkably stable: approximately 2,055 points +/- 47 points over the decade.
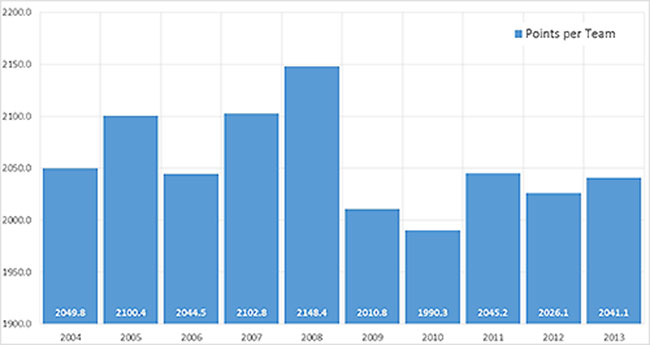
Average AFL Team Score per Season
Furthermore, over the very long run – I’ve looked at every match score between 1980 and 2013 – AFL match scores are normally distributed. This means that we can expect roughly two thirds of all AFL scores to fall within ‘one standard deviation’ of an average, and 97 per cent to fall within two. The normal distribution is a great property to have, because it makes statistical analysis much simpler.
A Z-Score is pretty much how many standard deviations above or below the expected score a particular team’s performance is. What we expect, and what happens in the data, is that around two thirds of team performances fall within this ‘one’ band, and 97 per cent fall within two.
The chart below shows the cumulative Z-score of each of the 16 teams which played in all ten seasons of the study period. A positive Z-score means they were consistently above average, and the larger the score means the further above average. The reverse applies, too.
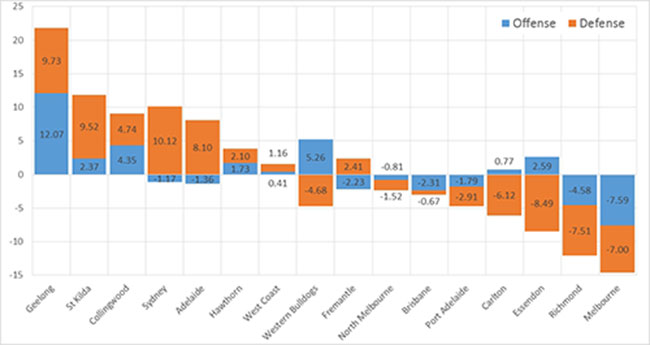
Just out of interest, I’ve pulled the particular occurrences where a team has been exceptional in a particular season – with ‘exceptional’ defined as being better than 95 per cent of all performances over the period. Broadly, this tells me it’s much easier to be an outstanding offensive team than it is to be an outstanding defensive team – and that being brilliant at scoring is possibly a better predictor of success than defence (note, I say possibly).
Offensive Outliers
|
Team |
Year |
Score |
Likelihood |
Points For |
||
| Geelong |
2007 |
2.55 |
0.5% |
2,542 |
||
| Geelong |
2010 |
2.35 |
0.9% |
2,518 |
||
| St Kilda |
2005 |
2.12 |
1.7% |
2,407 |
||
| Geelong |
2008 |
2.04 |
2.1% |
2,672 |
||
| Western Bulldogs |
2005 |
1.97 |
2.5% |
2,385 |
||
| Collingwood |
2011 |
1.92 |
2.7% |
2,592 |
||
| Hawthorn |
2013 |
1.82 |
3.4% |
2,523 |
||
| Hawthorn |
2012 |
1.79 |
3.7% |
2,679 |
||
| Geelong |
2011 |
1.77 |
3.9% |
2,548 |
||
| Western Bulldogs |
2009 |
1.72 |
4.2% |
2,378 |
||
| Brisbane |
2004 |
1.66 |
4.9% |
2,447 |
||
Defensive Outliers
|
Team |
Year |
Score |
Likelihood |
Points Against |
||
| St Kilda |
2009 |
2.55 |
0.5% |
1,411 |
||
| Adelaide |
2005 |
2.02 |
2.2% |
1,517 |
||
| Geelong |
2008 |
1.80 |
3.6% |
1,651 |
||
| Sydney |
2006 |
1.71 |
4.3% |
1,630 |
||
| Adelaide |
2006 |
1.67 |
4.7% |
1,640 |
||
Does this confirm what you already expected? Or has it thrown up some interesting findings? Let me know what you think!