


- Video
-
Club Roar
Captured a great grassroots sporting moment? We want to see it!Content Collections
The Roar Community
- Join
- Login
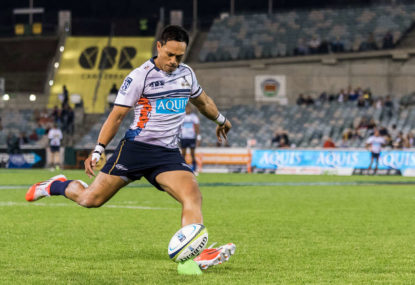
The great Elisha Pearce hit the nail on the head yesterday on The Roar, outlining why Australian fans should be worried about the state of the goal-kicking leading into the Rugby World Cup.
And you may well have seen me posting some stats yesterday around some of the Australian kickers this season. After foolishly deciding against keeping track of goal kicking stats myself at the start season, I was finally able to get the full set of numbers for the competition this week.
And while it doesn’t make great reading for the Australian conference, it’s not exactly brilliant for most other Super Rugby teams either.
Who isn’t kicking well?
Everyone bar Demetri Catrakilis and Ihaia West, essentially.
If kicking better than eight in every ten is the benchmark, then only the Stormer and the Blue qualify this season of kickers with any decent number of shots under their belt.
Catrakilis has slotted 11 of 12 conversions and 32 of 36 penalties, for an outstanding overall rate of 90 per cent for the season. Throw in Kurt Coleman’s 8-9 conversions and that’s 19 of the Stormers’ 21 tries this season earning the full complement.
And this is important to consider. The Stormers’ 21 tries is the lowest of all the top six teams, and the Waratahs are in seventh spot as well. But when those other teams are only converting at a combined 69 per cent, converting at 90 per cent yourself is one way of staying in touch, points differential-wise.
West is an interesting inclusion here. SANZAR’s official stats via Opta Sports tell me that West has played only six games, with five of them coming off the bench for no more than 51 minutes per appearance. In his one start, he played the full 80 minutes.
So to have a guy coming off the bench kicking 30 from 35, at 86 per cent overall is a massive impact. West has kicked 12 of 13 conversions and 18 of 22 penalties this season, and ITM Cup followers might recall him missing the sideline conversion that would’ve won the Championship Final last season.
It’s fair to say he’s put that behind him in 2015.
I should make mention of Handre Pollard and Elton Jantjies here, who are both right on 80 per cent success for the season, and who are landing penalties at 81 per cent and 82 per cent, respectively. Just as Elisha was making the point about the worrying numbers for potential Wallabies kickers, Heyneke Meyer would be pleased to know that his number 10 options are kicking well.
And just to underline Elisha’s point from yesterday, the Australian conference is kicking at a combined 62 per cent, compared to 73 per cent for the New Zealanders, and 76 per cent for the South Africans.
If there’s one silver lining for the Wallabies – and it’s a stretch, I’ll concede – Christian Leali’ifano, despite his simple conversion miss last weekend, is still knocking over penalty goals at better than four in every five, which is getting back near his 2013 level.
Yes, there will be difficult conversions, but considering the location of the World Cup, a good penalty goal success rate will be essential.
Of the recognised kickers taking more than 20 shots for the season, there’s some surprising names missing more than three in every ten, though: Beauden Barrett (67%); Coleman, Bernard Foley, and Dan Bowden (all 64%); Luke Burton (61%), and Sias Ebersohn (45%) among them. James O’Connor has kicked just 10 of 18 (56%) for the season, as well.
Force fans, you shouldn’t hold your breath any time the tee is run out. Burton, Ebersohn, Zack Holmes, and Marcel Brache have landed only 31 of 59 between them in 2015. A club side would be annoyed to be kicking only 52.5per cent of all shots, never mind a professional outfit.
Eighteen minutes of carnage in Christchurch
Down only ten points at halftime, the Reds might have been excused for thinking that they could still quite easily get back into their game against the Crusaders last Friday night. Eighteen minutes and 26 points later, those faint hopes had been quickly extinguished.
At half time, the Reds were dominating territory and possession – both measuring at more than 70 per cent – but by then they’d already conceded ten turnovers and missed 11 tackles.
In fact, they’d missed 11 of 37 tackle attempts – nearly one in three for the half. Ominous signs.
In the second half, still with more than half the territory and possession, they did at least only concede six more turnovers. But they missed another 18 tackles (of 57 attempts for the half). Twenty-nine missed tackles from 94 attempts for the match is indeed, as Richard Graham pointed out, “disgraceful”. Of the starting XV, only Chris Feauai-Sautia and James Hanson didn’t have a missed tackle recorded.
We don’t know if the Reds kept missing tackles because the Crusaders started making more breaks, or if the Crusaders made breaks because of the missed tackles; the numbers aren’t that good. But we do know the Crusaders cashed in, in the second forty. They made 471 metres from 54 runs, ten clean breaks, 18 defenders beaten and nine offloads. They lost only four of 36 rucks, won two scrums against the feed, and pinched two lineouts.
And scored six tries, converting five of them.
It was the third time in their last four games that the Reds had conceded a four-try bonus point, while for the Crusaders, it was the third time in six wins they’d cracked the half century for the season.
Carries and turnovers versus tries
Harry Jones’ method of plotting the number of turnovers per carries for a side is a really interesting one, and so I wondered if there was any correlation between the teams turning the pill over the least against the try scoring tallies of the year as at the end of Round 13.
Now upfront, this is going to be far from perfect. For one thing, I only have average figures per game to work with at this late stage. But it should give us an idea at least.
| Team | Carries | Turnovers | Carry per T/O | Rank | Tries | Rank | |
| Blues | 115.6 | 16 | 7.23 | 5 | 24 | 9 | |
| Brumbies | 104.6 | 15.2 | 6.88 | 10 | 30 | 4 | |
| Bulls | 94 | 13.5 | 6.96 | 7 | 25 | 8 | |
| Cheetahs | 80.7 | 13.3 | 6.07 | 13 | 26 | 7 | |
| Chiefs | 112.2 | 17.5 | 6.41 | 12 | 29 | 5 | |
| Crusaders | 114.3 | 17.7 | 6.46 | 11 | 41 | 1 | |
| Force | 119.7 | 12.3 | 9.73 | 1 | 24 | 9 | |
| Highlanders | 95.5 | 15.9 | 6.01 | 14 | 31 | 3 | |
| Hurricanes | 120.6 | 14.4 | 8.38 | 3 | 38 | 2 | |
| Lions | 100.5 | 14.5 | 6.93 | 8 | 21 | 13 | |
| Rebels | 123.5 | 13.6 | 9.08 | 2 | 22 | 12 | |
| Reds | 100.5 | 14.5 | 6.93 | 8 | 19 | 15 | |
| Sharks | 88.5 | 16.8 | 5.27 | 15 | 24 | 9 | |
| Stormers | 109.6 | 14.9 | 7.36 | 4 | 21 | 13 | |
| Waratahs | 125.8 | 17.6 | 7.15 | 6 | 27 | 6 |
So, does it? Well, sort of. Maybe. Probably not really.
The Hurricanes and the Waratahs are the only teams to sit among both the top six try-scorers and the top six ball-carriers per turnover conceded.
This rather surprised me, I must admit. I thought there would be some degree of overlap, and that the teams scoring the most tries would more than likely be the teams turning over the ball the least.
If anything, the opposite is true: the Force hold the ball the most per turnover, yet sit ninth on the tries scored list. The Rebels similarly hold possession well, yet only three teams have scored fewer tries in 2015.
On the flip side, the Highlanders have the second-worst carries/turnover rate, yet are third on the try-scorers list. The Crusaders have scored the most tries in the competition, yet also concede the most turnovers per game on average (they rank 11th for carries/turnover).
So what does it mean? Well, like has become more prevalent in recent seasons – and certainly as the Reds found on Friday night in Christchurch – holding onto the ball is certainly not the be-all and end-all for winning games of rugby.
What you do with the ball when you have it is far more important than how much you actually have it.