


- Video
-
Club Roar
Captured a great grassroots sporting moment? We want to see it!Content Collections
The Roar Community
- Join
- Login
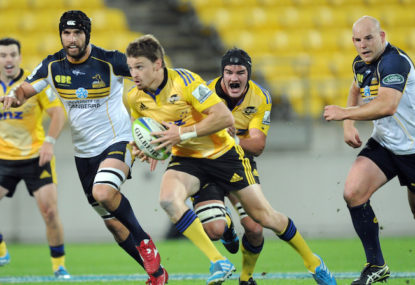
We take brief jaunt back to the stats sheets this lovely Thursday ahead of the Super Rugby final.
We attempt to uncover if the Highlanders have any hope, or if the Hurricanes are as cut and dry as home ground advantage tends to dictate in Super Rugby Finals.
Opta Sports, SANZAR’s official stats partner, has again produced the numbers ahead of the final, and it makes for some interesting reading.
Head to head, The Hurricanes have won 14 and the Highlanders 11, but interestingly, in Wellington it’s five apiece. Though the Hurricanes have won both games this season – 20-13 in Round 6 in Dunedin, and 56-20 in Round 17 in Napier – the Highlanders have won the last four matches at Westpac Stadium.
Ordinarily, you’d say the ‘Cake Tin’ holds few fears for the Highlanders, but it’s fair to say that none of those past four games were played in front of full houses with temporary seating in place to keep up with demand. For some of the Highlanders players, this will quite probably be the biggest crowd they’ve ever played before.
Success rates
This is a simple comparison of effectiveness and efficiency across the various different measures across the season, all expressed as a percentage.
As you can see, the Hurricanes take a slight advantage in tackle success rates, and have a better performing scrum, but the Highlanders have a decent advantage at lineout time, and a slightly better attacking breakdown.
Goal kicking is negligible, with only one percent difference. Though both Beauden Barrett and James Marshall have been kicking at 68 per cent or worse, Lima Sopoaga had been kicking in the low 70s for the season. These overall figures show that the Hurricanes’ part-timers had a decent success rate, whereas the Highlanders’ second stringers dragged their overall figure down.
As an aside, after admitting that perhaps he kicked too much last week ahead of the semi-final, it will be interesting to see whether Barrett starts kicking in the final, or whether he lets Marshall kick from the outset.
Barrett kicked one from three in the semi, Marshall three from four, while Sopoaga had something of an off night, kicking three from eight from the tee and one from two drop goals.
Attack
In attack, it certainly appears that the Hurricanes hold a significant advantage, at the very least in terms of clean breaks, defenders beaten, and offloads per game. Indeed, they ranked first in Super Rugby for the first two measures, and no. 3 for the third.
Comparatively, the Highlanders ranked mid-table in all categories.
The Hurricanes carried, on average, 126 times for 566 metres per game, again ranking them no.1 in the competition. The Highlanders carried, on average, 96 times for 418 metres per game. Their average gain had them ranked ninth, and only three teams carried fewer times per game across the competition.
The metres per carry is interesting though. As we can see here, when broken down, both sides make less than 4.5 metres per carry, and this shows that the Highlanders are at no great territorial disadvantage by the fact that they carry significantly less than the Hurricanes.
Passing and kicks from hand (not shown here) also puts the two finalists at opposite ends of the scale: the Hurricanes pass 165 times and kick 18.2 times per game on average (ranking 2nd and 13th for the competition), while the Highlanders average 123 passes and 25.4 kicks per game (10th and 2nd).
As we know though, the Highlanders change their methods wildly; they kicked 35 times against the Waratahs in the semi, but only 20 times against the Chiefs in the qualifying final. In their last eight games, they kicked as much as 39 times, and as few as 19 times. They are certainly adaptable in terms of the game plan, the Highlanders, and possess one of the better kick-chases in the game.
Defence, turnovers, set piece, and breakdown
Simple comparison of tackles made and missed, turnovers won and conceded, lineouts and scrums won and lost, and attacking rucks won and lost.
Now, I actually wanted these onto one single chart, but the limitation of Google Charts – or maybe my own ability – has been reached. I hope that you can still get a reasonable side-by-side comparison.
What we can see is that both sides attempt similar number of tackles per game, and we already know that their success rates are also on par. These graphs show the Highlanders attacking ruck numbers are significantly lower, and recall that we’ve already established that the Highlanders carry less and kick more. So they’re playing with considerably less possession, yet attempt no more tackles, really.
Both teams concede a similar number of turnovers, but the Highlanders do win a few more per game. The Hurricanes win more lineouts per game, but they also lose more on their own throw. The Opta numbers say the Highlanders have a slight edge in lineout steals, but it’s not significant. Scrums won and lost are also shown to be as close as doesn’t matter.
Overall, these numbers show that the two teams will be pretty evenly matched, which as the two best teams in the competition meeting in the Final, is something most had concluded anyway.
While the Hurricanes look to have a bit of an edge in what they’re capable of with the ball, the numbers confirm the general thinking that the Highlanders are going to have to play their best game of 2015 in order to get over the top of the minor premiers.
A tip then? Well no, sorry. That’s what tomorrow is for, isn’t it…