There’s a famous adage that ‘possession is nine-tenths of the law’. Intuitively, this rule also applies to rugby league, as time in possession is one of the key factors highlighted, and the team that holds the pill for longest is more often than not the victor.
Time in possession has always been a focus of rugby league coaches and commentators, however over the past decade even greater emphasis has been placed on two new coaching buzzwords: ‘structure’ and ‘completion rates’.
Structure and completion rates are bedfellows – without a tight structure a team is more likely to make errors, leading to a poor completion rate.
These terms didn’t really exist 20 years ago – at least coaches didn’t refer to game plans in this way – but nowadays every NRL coach speaks about the importance of maintaining high completions.
This is understandable, as completion rates are intimately related to another key statistic, errors, and of course a team with a high error-rate is harming its chances of winning. And if there’s anything that really gets a coach’s blood boiling, it’s errors – especially of the unforced variety.
But are completion rates really the key factors leading to victory? What do the stats say?
I’m getting into dangerous territory here. Writing a stats article will inspire comparison with the Roar’s very own great stats guru Tim Gore, and in that regard my efforts are destined to fall short.
But, to use another well-worn adage, ‘comparison is the sincerest form of flattery’.
So here goes…
Completion rates and possession
The raw numbers are telling: in all matches from 2015, including the finals series, the team with the superior completion rate won 69 per cent of the time (the losing team had the superior completion rate 27 per cent of the time, and in four per cent of matches the winner and loser had identical completion rates).
However, looking at the raw numbers doesn’t tell us much.
Firstly, raw completion rates don’t tell us anything about how effective the team is in attack. For example, a team that retains the ball for the full set with no errors, but then kicks the ball straight down James Tedesco’s throat is with no pressure on the kick return isn’t doing itself any favours.
Ditto a team that holds the pill for the full set but constantly kicks the ball dead. The players get a tick for successfully completing the set, but it’s not an outcome the coach would have hoped for.
A team that does this four or five times in a half is meekly handing possession back to the opposition with no pressure, high completion rates or not.
We saw this in the Round 5 match this year between the Rabbitohs and Sea Eagles. After quickly taking an early lead and looking unbeatable, poor kicks from Cody Walker and Luke Keary repeatedly gifted possession back to Manly, and the Sea Eagles were good enough to take advantage, scoring two tries of their own (one of Walker’s last-tackle kicks went dead from 45 metres out, an unforgivable error in my coaching manual).
Souths ended the match with 31 completed sets (a very high 84 per cent completion rate), but I would argue that at least 12 of those completed sets were wasted, ending submissively with poor final kicks. High completions with timid endings are not a good recipe for victory and the Bunnies were very lucky to hold onto the win against a superior Manly side.
Secondly, looking solely at completion rates doesn’t show how the team is performing in defence.
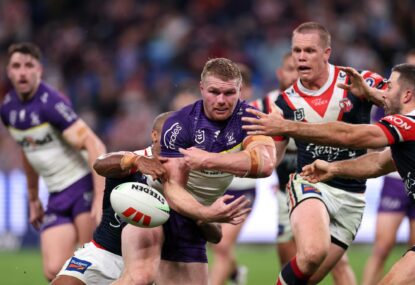
One of the classic games from last year saw the Broncos hold out repeated sets from Melbourne to secure a brave 14-12 victory. Despite the fact the Storm had the superior completion rate (88% completed to the Bronco’s 81%), and the bulk of possession (53% to 47%), the Brisbane side were good enough to defend their way to victory.
It was the moment when most of us sat up and recognised the Broncos as a genuine premiership threat, and it also showed that high completion-rates alone do not guarantee victory.
So, although commentators and coaches talk a lot about possession and completions, it’s what you do with it (and without it) that counts.
Average completion rates in 2015
Looking at completion rates in 2015, there is a reasonably high correlation between the final ladder finish with the average completion rates:
| Team |
Average completion rates per cent |
Ladder finish |
| Storm |
72.4 |
4 |
| Broncos |
72.2 |
2 |
| Cowboys |
72.2 |
3 |
| Raiders |
71.6 |
10 |
| Bulldogs |
70.6 |
5 |
| Dragons |
70.3 |
8 |
| Rabbitohs |
70 |
7 |
| Sea Eagles |
70 |
9 |
| Knights |
69.9 |
16 |
| Sharks |
69.8 |
6 |
| Roosters |
69 |
1 |
| Tigers |
68.4 |
15 |
| Eels |
68.1 |
12 |
| Penrith |
67 |
11 |
| Warriors |
66.8 |
13 |
| Titans |
66.5 |
14 |
Predictably, Melbourne ended the 2015 season with the highest average completion rates of any side – Craig Bellamy has built a culture around minimising errors, limited interplay and highly structured football, so it’s unsurprising they finished on top in this statistic.
Among the other top eight teams, Brisbane, North Queensland, Canterbury and South Sydney all finished in the same order as their pre-finals ladder finish, while the Dragons’ completion rates were the sixth best, compared to an eighth placing.
The disparities were Canberra, who finished the season tenth but had the fourth-best completion rates in 2015, and Sydney, minor premiers for the third straight year, whose average completion rate were 11th in the league.
However, Canberra did lose six matches by less than four points, so I would suggest that Ricky Stuart had the right structures in place, but the Raiders were unable to close out enough matches to secure a top eight finish.
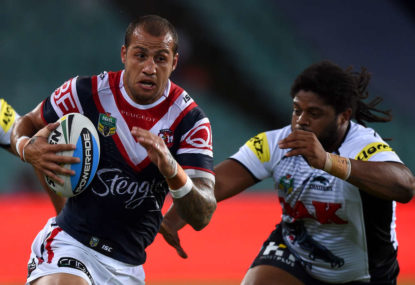
As for the Roosters, while their lower completion rates was related to their high error-rate – they finished the regular season with 289 errors, more than any other club – they trusted their solid defence to hold the opposition at bay and indeed conceded the fewest points of any club in 2015.
Similarly, when it came to attack, blessed as they were with exciting attacking players like Roger Tuivasa-Sheck and Michael Jennings, the Tri-Colours were more capable of scoring even with fewer completed sets.
Interestingly, the Cowboys had the highest average completion rates after three rounds, which despite being winless at the time, shows that they had the right structures in place for a successful season, which is how things panned out.
It’s what you do that counts
The Roosters demonstrated that a high error and low completion rate does not necessarily harm your changes, as long as those errors are a result of attacking flair rather than unforced errors, and you have a brick-wall defence.
The following tables attempt to show this.
The first table shows the number of sets completed by each side, as well as the total tries scored, which is used to calculate the strike rate.
The strike rate is a better measure of a side’s potency in attack as it takes into account the number of sets completed to achieve a total number of tries. For example, a side that scores ten tries from ten completed sets is more potent in attack than a side that takes 20 sets to score the same number of tries.
The Roosters were again top of the table, scoring 100 tries in the regular season from 694 completed sets. This represents a strike rate of one try scored every 6.9 completed sets.
At the other extreme were the Dragons, who only managed to score a try once every 9.8 sets – so their meek attack this year is unsurprising.
| Team |
Total completed sets |
Total tries scored |
Strike Rate |
| Sydney |
694 |
100 |
6.9 |
| Brisbane |
710 |
101 |
7 |
| Canterbury |
685 |
97 |
7.1 |
| Canberra |
694 |
97 |
7.2 |
| North Queensland |
743 |
101 |
7.4 |
| Wests |
665 |
87 |
7.6 |
| Parramatta |
645 |
83 |
7.8 |
| New Zealand |
653 |
80 |
8.2 |
| Manly |
695 |
84 |
8.3 |
| Gold Coast |
638 |
76 |
8.4 |
| South Sydney |
695 |
80 |
8.7 |
| Newcastle |
685 |
79 |
8.7 |
| Melbourne |
725 |
82 |
8.8 |
| Cronulla |
710 |
77 |
9.2 |
| Penrith |
678 |
72 |
9.4 |
| St George |
698 |
71 |
9.8 |
The other side of the coin shows the number of completed sets defended by each side, as well as the number of tries conceded. This again is used to calculate the reverse strike rate – let’s call it the ‘defence rate’.
Again the Roosters are well on top, conceding a try once every 12.8 completed sets. The Dragons conceded a try once every 9.4 sets, the fourth best rate, which is arguably what got them into the finals last year.
There is actually a closer correlation between this table and the final ladder finish from 2015, which may well indicate that defence does indeed win premierships.
| Team |
Total defended sets |
Total tries conceded |
Defence rate |
| Sydney |
681 |
53 |
12.8 |
| Melbourne |
674 |
60 |
11.2 |
| Brisbane |
681 |
65 |
10.5 |
| St George |
685 |
73 |
9.4 |
| North Queensland |
700 |
78 |
9 |
| Penrith |
679 |
80 |
8.5 |
| Canterbury |
690 |
85 |
8.1 |
| Cronulla |
642 |
79 |
8.1 |
| South Sydney |
676 |
85 |
8 |
| Manly |
698 |
88 |
7.9 |
| Canberra |
696 |
97 |
7.2 |
| Wests |
700 |
99 |
7.1 |
| Parramatta |
700 |
102 |
6.9 |
| New Zealand |
698 |
104 |
6.7 |
| Newcastle |
714 |
106 |
6.7 |
| Gold Coast |
699 |
113 |
6.2 |
Finally, the attacking strike rates are deducted from the defence rates, giving an overall differential – the higher the figure, the better.
I have called this the ‘Gore Factor’. While it’s not perfect, the Gore Factor does have a reasonably high correlation to how the ladder panned out.
| Team |
Gore Factor |
| Sydney |
5.9 |
| Brisbane |
3.4 |
| Melbourne |
2.4 |
| North Queensland |
1.6 |
| Canterbury |
1.1 |
| Canberra |
0 |
| Manly |
-0.3 |
| St George |
-0.4 |
| Wests |
-0.6 |
| South Sydney |
-0.7 |
| Parramatta |
-0.9 |
| Penrith |
-0.9 |
| Cronulla |
-1.1 |
| New Zealand |
-1.5 |
| Newcastle |
-1.9 |
| Gold Coast |
-2.2 |
What about this season?
Looking at the season so far, average completion rates again are only part of the story:
| Team |
Average completion rates |
| Brisbane |
80.4 |
| Gold Coast |
79.4 |
| Canterbury |
79.1 |
| South Sydney |
78 |
| Penrith |
76.9 |
| Melbourne |
76.6 |
| New Zealand |
75.9 |
| Manly |
75.7 |
| North Queensland |
75.6 |
| Sydney |
75.6 |
| Cronulla |
75 |
| Parramatta |
75 |
| Canberra |
73.4 |
| Newcastle |
73.7 |
| Wests |
73.6 |
| St George |
72 |
Looking again at the potency of attack gives a better indication how teams are going in 2016:
| Team |
Total completed sets |
Total tries scored |
Strike rate |
| North Queensland |
206 |
34 |
6.1 |
| New Zealand |
199 |
30 |
6.6 |
| Wests |
197 |
28 |
7 |
| Cronulla |
207 |
28 |
7.4 |
| Brisbane |
230 |
31 |
7.4 |
| South Sydney |
209 |
28 |
7.5 |
| Canterbury |
208 |
26 |
8 |
| Gold Coast |
211 |
25 |
8.4 |
| Canberra |
200 |
23 |
8.7 |
| Penrith |
172 |
18 |
9.6 |
| Parramatta |
204 |
21 |
9.7 |
| Sydney |
168 |
17 |
9.9 |
| Manly |
200 |
20 |
10 |
| Melbourne |
222 |
22 |
10.1 |
| Newcastle |
179 |
15 |
11.9 |
| St George |
200 |
9 |
22.2 |
North Queensland has the most potent attack of any side so far this season, scoring a try every 6.1 completed sets. St George is again at the other end of the table, scoring a try once every 22.2 completed sets.
The Warriors and Tigers, further down on the table, unsurprisingly both have a high strike rate, as they are known for their exuberance in attack.
Cronulla have improved their attack considerably, scoring a try every 7.4 completed sets. The addition of James Maloney certainly explains this, as well as dynamic backline weapons like Jack Bird and Valentine Holmes, as well as Ben Barba being back in outstanding form.
The sides that appear to be struggling in attack are the Roosters, Manly and Melbourne. The Chooks have only scored 17 tries and are struggling with a new halves pairing, as are the Sea Eagles, who will improve in attack as Dylan Walker gets more experience at pivot and Daly Cherry-Evans returns.
While Melbourne are still winning close matches, they are curiously out of form in attack, doing non-Melbourne things. The absence of Billy Slater does not explain this fully, as he was out for most of last season, rather both Cooper Cronk and Cameron Smith are well below their best.
Looking at defensive efforts so far this year (table below), Parramatta are the stand-out, conceding a try every 15.2 defended sets. The Broncos, Cowboys, Bulldogs and Storm are also in double figures.
Again, defence is what it takes to win matches, and Canterbury and Melbourne are higher up the ladder thanks to their strong defensive efforts, which has won them some very close games.
While it’s too early for these numbers to be in any way indicative of how the ladder will finish, it’s clear that all of the sides in this top eight – apart from New Zealand and the Tigers – will almost certainly figure in this year’s finals (notwithstanding Parra’s dramas). Who will be the other two is anyone’s guess.
| Team |
Total sets defended |
Total tries conceded |
Defensive rate |
| Parramatta |
197 |
13 |
15.2 |
| Brisbane |
179 |
12 |
14.9 |
| North Queensland |
188 |
13 |
14.5 |
| Canterbury |
214 |
18 |
11.9 |
| Melbourne |
214 |
19 |
11.3 |
| New Zealand |
207 |
29 |
7.1 |
| Wests |
208 |
27 |
7.7 |
| Cronulla |
180 |
19 |
9.5 |
| St George |
219 |
23 |
9.5 |
| Penrith |
208 |
24 |
8.7 |
| South Sydney |
212 |
25 |
8.5 |
| Manly |
219 |
28 |
7.8 |
| Gold Coast |
189 |
27 |
7 |
| Canberra |
197 |
30 |
6.6 |
| Sydney |
208 |
33 |
6.3 |
| Newcastle |
230 |
41 |
5.6 |
Finally, let’s have a look at the Gore Factor so far this year.
| Team |
Gore Factor |
| North Queensland |
8.4 |
| Brisbane |
7.5 |
| Parramatta |
5.4 |
| Canterbury |
3.9 |
| Cronulla |
2.1 |
| Melbourne |
1.2 |
| South Sydney |
1 |
| Wests |
0.7 |
| New Zealand |
0.5 |
| Penrith |
-0.9 |
| Gold Coast |
-1.4 |
| Canberra |
-2.1 |
| Manly |
-2.2 |
| Sydney |
-3.5 |
| Newcastle |
-6.3 |
| St George |
-12.7 |
So far the Gore Factor closely reflects the current ladder.
The top six sides ranked by the Gore Factor look like finalists this season. Expect Penrith to move into the eight in the coming weeks, with a lottery for the final spot.