


- Video
-
Club Roar
Captured a great grassroots sporting moment? We want to see it!Content Collections
The Roar Community
- Join
- Login
If referees are triple-20 on the dartboard-of-discontent then the mathematical boffins behind the NRL draw must be bunkered in the bulls-eye.
With prime time games in the pockets of television bigwigs, for every smiling fan there’s a bay of disgruntled flag-wavers screaming their team’s draw stinks of two-and-two equals three.
To side-step the jibber I’ve untangled the migration path of gate-paying fans to find out what really blows their trumpet.
The analysis includes all premiership games (finals excluded) from the past two seasons so as to minimise fluctuations attributed to weather, team performance and other sneaky quirks.
The 384 premiership matches played over the last two seasons attracted 5.83 million fans at an average of 15,220 per game with the 2016 total one-percent up on 2015.
Saturday indeed proved Super hosting more matches (37%) than any other but Friday ranked highest at the turnstile pulling 20,336 per match, while Monday proved a couch magnet with a wooden spoon winning 12,831.
Despite playing home to nine teams including St George Illawarra (56%), Sydney only hosted 50.3% of fixtures drawing 14,180 per match while the 191 games played beyond its boundaries attracted an extra 2,286 per game.
Queensland’s domination extended beyond the fence, out-drawing both New South Wales and New Zealand with a game day average of 21,057 across 75 contests.
Only six clubs (Brisbane, Canberra, Cronulla, Gold Coast, Newcastle, North Queensland) played all 24 home games at the one venue. Parramatta and South Sydney played the least (18) at their primary base while St George-Illawarra and Manly used the most ‘home’ venues (5).
No other team came close to matching the Broncos popularity, with the one-horse town hosting a whopping home game average of 33,643.
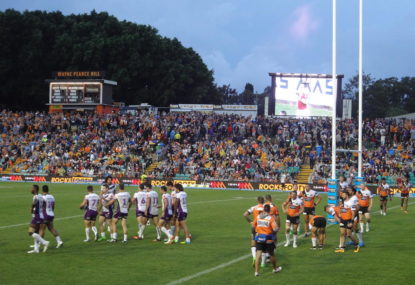
Of the major grounds, WIN Stadium in Wollongong and Campbelltown Stadium proved least popular averaging 10,299 and 10,871 respectively. ANZ Stadium was Sydney’s most popular ground for usage and average attendance while Belmore was unmatched in crowd average among Sydney’s hill lined suburban venues – even trumping the fully furnished Pirtek Stadium.
The biggest turnout was a wall-bursting 52,347 at Suncorp Stadium for this season’s Round 10 double header. The Roosters’ 2016 clash with the Tigers at Allianz Stadium drew the least (3,622), a surprising 356 less than survived last year’s Round-7 Sharknado.
Regional and non-affiliated NRL cities held 14 matches (4%) attracting on average 11,975 per match. Of the nine locations, three (Perth, Napier NZ and Christchurch NZ) attracted crowds larger than the average attendance of the substituted venue.
| Team | Venue | Thurs | Fri |
| G/AC | G/AC | ||
| Broncos | Suncorp | 6/33,379 | 15/33,673 |
| Raiders | GIO | – | 2/7,586 |
| Bulldogs | ANZ | 1/10,290 | 8/22,731 |
| Bulldogs | Belmore | 1/10,144 | – |
| Bulldogs | Wellington, NZ | – | – |
| Sharks | Shark Park | – | 2/9,211 |
| Titans | Cbus Super | – | 2/18,256 |
| Sea Eagles | Brookvale | 2/12,118 | 5/12,619 |
| Sea Eagles | Lavington, Albury | – | – |
| Sea Eagles | Gosford | – | – |
| Sea Eagles | Suncorp* | – | – |
| Sea Eagles | Nib, Perth | – | – |
| Storm | AAMI | – | 2/16,109 |
| Storm | Napier, NZ | – | – |
| Storm | Suncorp* | – | – |
| Knights | Hunter | – | – |
| Cowboys | 1300SMILES | 3/12,138 | 3/21,727 |
| Eels | Pirtek | 1/17,324 | 5/13,380 |
| Eels | ANZ | – | 2/24,448 |
| Eels | Marrara, NT | – | – |
| Panthers | Pepper | 1/11,125 | 4/14,961 |
| Panthers | Bathurst | – | – |
| Panthers | Christchurch, NZ | – | – |
| Rabbitohs | ANZ | 2/11,641 | 6/20,101 |
| Rabbitohs | Allianz | 1/12,036 | – |
| Rabbitohs | Cairns, Qld | – | – |
| Rabbitohs | Nib, Perth | – | – |
| Dragons | ANZ | – | – |
| Dragons | WIN | 2/7,403 | – |
| Dragons | Jubilee | 1/9,647 | 2/10,642 |
| Dragons | Allianz | – | – |
| Dragons | SCG | – | – |
| Roosters | Allianz | 2/7,024 | 3/17,658 |
| Roosters | Gosford | – | – |
| Warriors | Mt Smart | – | – |
| Warriors | New Plymouth, NZ | – | – |
| Tigers | ANZ | – | 4/14,978 |
| Tigers | Leichhardt | – | 2/7,261 |
| Tigers | Campbelltown | – | – |
| Total | 23/16,679 | 67/20,336 |
| Team | Venue | Sat | Sun | Mon |
| G/AC | G/AC | G/AC | ||
| Broncos | Suncorp | 2/32,396 | 1/37,260 | – |
| Raiders | GIO | 10/10,765 | 8/12,433 | 4/9,864 |
| Bulldogs | ANZ | 6/17,588 | 2/16,262 | 2/18,686 |
| Bulldogs | Belmore | – | 2/16,234 | 1/16,764 |
| Bulldogs | Wellington, NZ | 1/18,212 | – | – |
| Sharks | Shark Park | 9/14,508 | 9/14,725 | 4/9,130 |
| Titans | Cbus Super | 9/13,277 | 8/11,861 | 5/9,937 |
| Sea Eagles | Brookvale | 4/10,410 | 5/11,929 | 4/7,459 |
| Sea Eagles | Lavington, Albury | 1/6,436 | – | – |
| Sea Eagles | Gosford | 1/16,280 | – | – |
| Sea Eagles | Suncorp* | 1/52,347 | – | – |
| Sea Eagles | Nib, Perth | 1/11,109 | – | – |
| Storm | AAMI | 10/13,341 | 4/12,962 | 6/13,578 |
| Storm | Napier, NZ | 1/14,532 | – | – |
| Storm | Suncorp* | 1/52,347 | – | – |
| Knights | Hunter | 12/14,809 | 9/15,762 | 3/14,867 |
| Cowboys | 1300SMILES | 15/16,833 | – | 3/13,743 |
| Eels | Pirtek | 6/12,375 | 3/12,206 | 3/10,768 |
| Eels | ANZ | 1/14,428 | – | 1/35,510 |
| Eels | Marrara, NT | 2/8,031 | – | – |
| Panthers | Pepper | 7/11,163 | 7/13,459 | 2/9,031 |
| Panthers | Bathurst | 2/6,480 | – | – |
| Panthers | Christchurch, NZ | 1/18,000 | – | – |
| Rabbitohs | ANZ | 3/13,692 | 4/18,491 | 3/11,860 |
| Rabbitohs | Allianz | – | – | 1/8,273 |
| Rabbitohs | Cairns, Qld | – | 2/11,818 | – |
| Rabbitohs | Nib, Perth | 1/20,727 | 1/13,142 | – |
| Dragons | ANZ | 1/17,685 | 2/17,680 | 1/20,153 |
| Dragons | WIN | 4/10,375 | 2/13,042 | – |
| Dragons | Jubilee | 2/10,946 | 2/14,123 | 1/10,028 |
| Dragons | Allianz | – | – | 2/22,334 |
| Dragons | SCG | 1/18,217 | 1/17,824 | – |
| Roosters | Allianz | 6/15,962 | 7/12,751 | 5/9,715 |
| Roosters | Gosford | – | 1/10,113 | – |
| Warriors | Mt Smart | 14/14,890 | 8/14,161 | 1/13,895 |
| Warriors | New Plymouth, NZ | 1/12,833 | – | – |
| Tigers | ANZ | 1/10,582 | 1/20,936 | 2/25,729 |
| Tigers | Leichhardt | – | 5/13,905 | 1/11,269 |
| Tigers | Campbelltown | 6/11,403 | 1/6,711 | 1/11,837 |
| Total | 143/14,514 | 95/14,120 | 56/12,831 |
| Team | Venue | G | AC |
| Broncos | Suncorp | 24 | 33,643 |
| Raiders | GIO | 24 | 10,906 |
| Bulldogs | ANZ | 19 | 19,345 |
| Bulldogs | Belmore | 4 | 14,844 |
| Bulldogs | Wellington, NZ | 1 | 18,212 |
| Sharks | Shark Park | 24 | 13,252 |
| Titans | Cbus Super | 24 | 12,524 |
| Sea Eagles | Brookvale | 20 | 10,923 |
| Sea Eagles | Lavington, Albury | 1 | 6,436 |
| Sea Eagles | Gosford | 1 | 16,280 |
| Sea Eagles | Suncorp | 1 | 52,347 |
| Sea Eagles | Nib, Perth | 1 | 11,109 |
| Storm | AAMI | 22 | 13,588 |
| Storm | Napier, NZ | 1 | 14,532 |
| Storm | Suncorp | 1 | 52,347 |
| Knights | Hunter | 24 | 15,174 |
| Cowboys | 1300SMILES | 24 | 16,472 |
| Eels | Pirtek | 18 | 12,633 |
| Eels | ANZ | 4 | 24,709 |
| Eels | Marrara, NT | 2 | 8,031 |
| Panthers | Pepper | 21 | 12,447 |
| Panthers | Bathurst | 2 | 6,480 |
| Panthers | Christchurch, NZ | 1 | 18,000 |
| Rabbitohs | ANZ | 18 | 16,362 |
| Rabbitohs | Allianz | 2 | 10,155 |
| Rabbitohs | Cairns, Qld | 2 | 11,818 |
| Rabbitohs | Nib, Perth | 2 | 16,935 |
| Dragons | ANZ | 4 | 18,300 |
| Dragons | WIN | 8 | 10,299 |
| Dragons | Jubilee | 8 | 11,387 |
| Dragons | Allianz | 2 | 22,334 |
| Dragons | SCG | 2 | 18,021 |
| Roosters | Allianz | 23 | 13,071 |
| Roosters | Gosford | 1 | 10,113 |
| Warriors | Mt Smart | 23 | 14,593 |
| Warriors | New Plymouth, NZ | 1 | 12,833 |
| Tigers | ANZ | 8 | 17,861 |
| Tigers | Leichhardt | 8 | 11,915 |
| Tigers | Campbelltown | 8 | 10,871 |
| Total | 384 | 15,220 |
The Sensible
Like it or not Queensland is the spine of the NRL and an old favourite should now read, “when Queensland is going well, rugby league is going well’.
With no end in sight to Banana-mania, their wide-ranging exposure makes commercial common sense and it’s why the three clubs north of the Tweed sit on pole position in the scheduling matrix.
Prime time specialists Brisbane controlled 21 of 24 home games among Thursday and Friday nights. And no side out ranked the Cowboys on Saturday evenings with the Townville based outfit gifted 15 home games in their preferred slot.
The Titans maintained Queensland’s focus covering the Sunday/Monday backshifts where they placed equal third and second respectively for most home games over those two days.
More than a quarter of Melbourne’s home games occupied Monday nights and unlike other teams, attendances remained strong. The Storm averaged 13,578 on Mondays at AAMI Park, just 10 below the ground’s overall two year average.
Two of Sydney’s most popular sides Canterbury and Souths usually alternated Thursday/Friday duties hosting a combined 19 games mostly at ANZ Stadium attracting the city’s most consistent and largest crowds.
The public holiday blockbuster is Sydney’s favourite, the Good Friday Rabbitohs v Bulldogs clash has a five-year average of 41,775 and since 2014 the Eels v Tigers Easter Monday fixture has averaged 40,763.
Just as exciting is the success of the Roosters v St George-Illawarra Anzac Day match after 15 seasons. The Allianz fixture continues to appeal with crowds topping 34,000 since 2010.
Ricky Stuart wasn’t the only Raider in favour of regular Saturday afternoon kick-offs. Fans also embraced the extra sunlight enjoying 13 daytime kick-offs at 11,734 per match compared to 11 shivering nights at 9,926.
Unperturbed by the impending thwack of successive wooden spoons, Knights fans proved harder than a coffin-nail braving Hunter Stadium at 15,174 per match – 1,922 per game more than the premiers attracted to Shark Park.
Footy bean counters love a human headlines and Jarryd Hayne proved maximum font. The Titans averaged 12,218 at home this year until the ex-49er hypnotised a further 9,480 through the gates in the closing rounds.
And his ‘this is my town’ match winning field-goal occurred before the largest Campbelltown crowd since 2011.
Sydney’s suburban grounds are conducive to Sunday afternoon nostalgia but Penrith’s Pepper Stadium and Manly’s Brookvale Oval bucked the hype drawing bigger average crowds on Friday nights.
Brisbane fans couldn’t care less about the Broncos’ prime time mortgage; they turn up regardless with only 30 more per match on Friday’s compared to the Suncorp two-year average.
The Cowboys reckon Saturday starts are friendlier to their regional supporters, although the stats show an average of 4,894 more fans attended Friday matches.
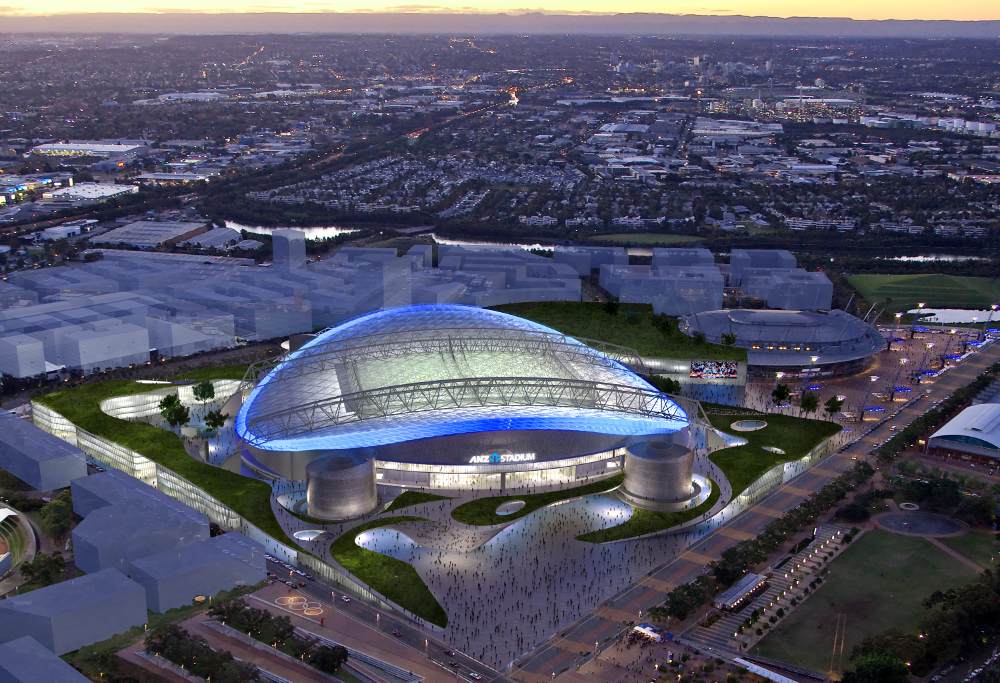
Plenty of locals insinuate ANZ is a cavernous wasteland to be avoided at all cost. Yet the Homebush venue is Sydney’s most popular, hosting 27% of games at 18,434 per match. Nearby venues averaged a combined 12,569 over the same period.
Mondays become Friday in 2017, kicking off at 6pm NSW time and without a Jason Taumalolo sized escort clearing traffic, it’ll be a tough slot for Sydneysiders to make.
Expect the Storm to hog Friday’s early start. With 29 percent of their matches played on Mondays in 2015-16; it’s reasonable to assume they’ll champion the new ugly duckling without compromising gate receipts.
Only 33 of the last 95 Sunday games were held at Sydney hilly relics, but until levelled they’ll always be best served with sunshine. Only five Sunday afternoon games were played at Brookvale over the past two years compared to eight for both Canberra and Gold Coast.
An even share of the daylight would be conducive to more attractive old-school derbies. An extra daylight slot is also worth trialling by bringing forward the first two Saturday games to 2 and 4pm.
Suncorp’s doubleheader returned in style for the first time since 2012 setting a premiership match ground record. The Sea Eagles are committed again in 2017 and with doubts over the concept having drifted out to sea; it should be here to stay.
Still on Suncorp, it’s the white elephant fans like riding most; a second Brisbane side will ensure it’s a weekly cash cow the NRL deserves.
Plenty of clubs will be viewing the Eels move to ANZ with interest. Having averaged 12,633 at Pirtek over the last two years, others will be keen to know if there’s value in relocating to the Olympic venue.
And what about Gosford, the once relocation favourite has seen five games in three years at 12,509 punters per match. Its revival odds without a local team appear remote.
At current trends, the coastal strip will soon be renamed Old Rugby League Town.
Reckon you can pick the winning team? Build your own dream team with Draftstars daily fantasy and compete on any match. For great odds on the NRL head on over to PlayUp. Imagine what you could be buying instead. Set a deposit limit.