I read Adrian Polykandrites‘ power rankings each week, and the comments this week seemed to hover around an age-old question; exactly what are we ranking when we post our opinions of team orders?
The ladder already exists. We know which teams have how many wins, and so on and so forth. That’s cut and dried, done and dusted. No need for us to write articles for that.
Most often when you see rankings posted, you expect to see something more akin to how the team is playing right now. Or, perhaps, you’re posting the order you project the teams to finish at the end of August.
Maybe it’s based on potential or your expectations of what that team could achieve in the near future. Or maybe it’s some mystical combination of the three and the ladder.
Everyone has a slightly different view of the purpose, so even if you agree on the evidence a team presents, you may still disagree based on how you view the exercise itself.
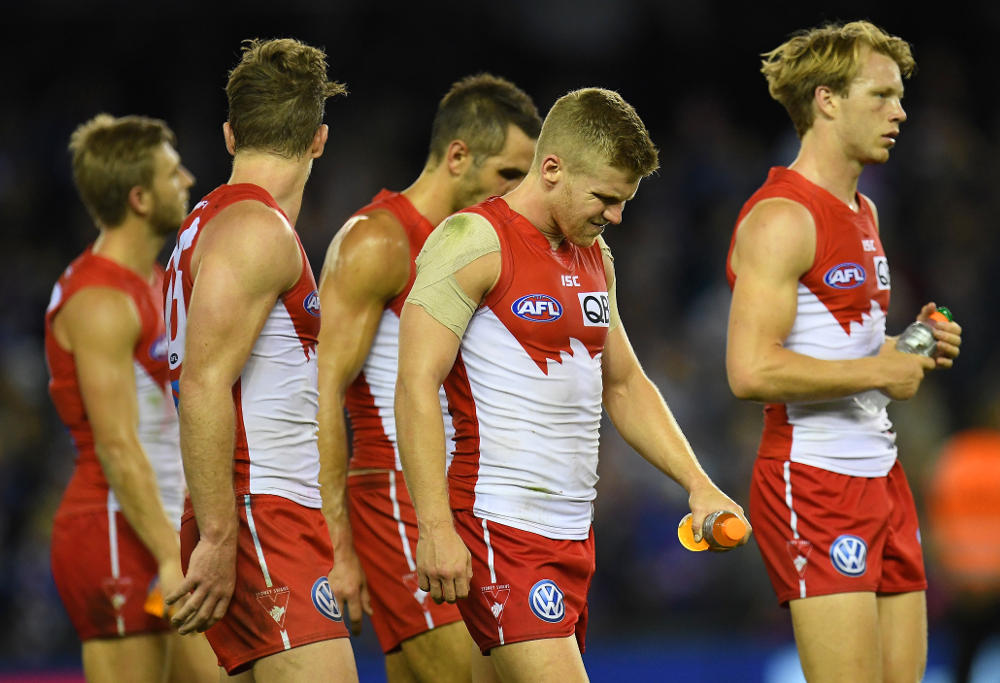
The obvious example in 2017 is that of the defending minor premiers, the Sydney Swans.
After an abhorrent start to the season, written off for dead, the Swans have since gone 5-1, losing only a critical game to a terrible Hawthorn team who momentarily thought it was a grand final or something.
Based on the last six weeks, they are ‘as good as anyone’ in the competition. We’d expect them to continue to play this way, given their pedigree and experience.
So, do you rank them at the top of your power rankings?
Or does that completely discount the fact that in reality, they’re still fighting for their finals lives at 5-7, and will at best face finals competition on the road all the way to the MCG, if they were to get that far again?
Adrian, like most others, chose not to ignore that reality, as is his right. That doesn’t make him right or wrong, of course.
My ‘spreadsheet of death’ uses a rating system I’ve described before that takes history into account on a diminishing scale going back into last year. Right now, Sydney is sitting at 66.9, the second highest rating, so I would have them second on my power rankings, were I to do such a thing.
What does that number mean? Probably nothing, moving forward.
If Lance Franklin broke his leg tomorrow, the midfield contracted some debilitating disease related to leather poisoning and John Longmire decided to go Trump on the Swans, installing his sons-in-law and nephews in the line-up, then that rating becomes pretty meaningless: Sydney’s going to lose.
(AAP Image/Julian Smith)
All that we can ever do is rate past performance. There is no way short of a time machine to accurately predict the future ladder order beyond sheer mathematical possibility and impossibility.
None of our metrics or predictions had Hawthorn 17th this year or Fremantle 16th last year based on their performances up until then. Sure, we saw the Hawks dipping a little, but the majority of prognosticators had them being competitive, which they’re generally not (last night aside).
Similarly, we didn’t as a rule have Port Adelaide gelling the way they have before the season started. What’s changed? Nothing extremely tangible – no major trades happened that made us think we should expect a teal renaissance.
Richmond would be 11-1 under slightly better end-game circumstances and, while Josh Caddy and Dion Prestia have been nice additions, it’s been the explosion of Super Dusty in Tigerland that’s made the difference, and there’s no good metric for predicting the maturation of young talent. Sometimes it happens, sometimes you wait for years and nothing magical occurs.
We do our best to project what we’re seeing into the near future, but too often we’re wrong – that’s how CrownBet makes its money.
This year, in particular, has been hard to predict. I track the professional oddsmakers, the Roar predictions, the Age’s predictions, ESPN’s picks, several crowd bet sites and AFL.com.au’s projections alongside my own ratings and personal picks.
After 13 rounds, none of those had picked games this year with even 60 per cent accuracy – and that’s just winners, not even counting against the spread. This season is topsy-turvy. Twelve teams are 3-3 in their last six games and only two are more than one game off .500 either way.
All of this simply means that we’re swatting at flies that we cannot see. So how could we ever make heads or tails out of a power ranking?
Well, here are seven different scales, including my own ‘ELO-Following Football’ rating system. You combine their results as you wish, and that can be your power ranking.
| AFL LADDER |
| Adelaide |
9-3 |
| GWS |
9-3 |
| Geelong |
8-4 |
| Port Adelaide |
7-5 |
| Melbourne |
7-5 |
| Richmond |
7-5 |
| West Coast |
7-5 |
| Essendon |
6-6 |
| Western Bulldogs |
6-6 |
| St Kilda |
6-6 |
| Fremantle |
6-6 |
| Sydney |
5-7 |
| Collingwood |
5-7 |
| Gold Coast |
5-7 |
| Carlton |
5-7 |
| North Melbourne |
4-8 |
| Hawthorn |
4-8 |
| Brisbane |
2-10 |
|
| PERCENTAGE |
| Adelaide |
141.8% |
| Port Adelaide |
134.4% |
| GWS |
116.4% |
| Melbourne |
115.7% |
| Geelong |
114.8% |
| Richmond |
109.7% |
| Sydney |
105.5% |
| Essendon |
102.9% |
| West Coast |
102.6% |
| Collingwood |
101.7% |
| Western Bulldogs |
96.5% |
| St Kilda |
95.0% |
| North Melbourne |
92.9% |
| Gold Coast |
88.1% |
| Carlton |
82.7% |
| Fremantle |
78.5% |
| Hawthorn |
76.9% |
| Brisbane |
69.9% |
|
| RECORD SINCE ROUND 7 |
| Sydney |
5-1, 134.4% |
| Melbourne |
4-2, 123.0% |
| GWS |
4-2, 99.5% |
| Adelaide |
3-3, 122.7% |
| Port Adelaide |
3-3, 116.6% |
| Essendon |
3-3, 114.1% |
| Collingwood |
3-3, 110.1% |
| North Melbourne |
3-3, 99.1% |
| Geelong |
3-3, 97.7% |
| West Coast |
3-3, 92.1% |
| Hawthorn |
3-3, 88.6% |
| Gold Coast |
3-3, 87.2% |
| St Kilda |
3-3, 84.0% |
| Fremantle |
3-3, 81.7% |
| Richmond |
2-4, 107.4% |
| Western Bulldogs |
2-4, 82.0% |
| Brisbane |
1-5, 71.4% |
|
| RECORD SINCE ROUND 10 |
| Melbourne |
3-0, 137.0% |
| Adelaide |
2-1, 162.2% |
| Collingwood |
2-1, 123.3% |
| Sydney |
2-1, 119.3% |
| Richmond |
2-1, 116.8% |
| GWS |
2-1, 108.9% |
| Geelong |
2-1, 106.4% |
| Carlton |
2-1, 96.8% |
| Port Adelaide |
2-2, 101.6% |
| Gold Coast |
2-2, 91,9% |
| Essendon |
1-2, 114.0% |
| West Coast |
1-2, 100.8% |
| North Melbourne |
1-2, 88.1% |
| Brisbane |
1-2, 87.9% |
| Hawthorn |
1-2, 77.2% |
| Western Bulldogs |
1-2, 74.9% |
| St Kilda |
1-2, 70.7% |
| Fremantle |
0-3, 41.9% |
|
| WIN/LOSS STREAK |
| Melbourne |
3W, 1L |
| Sydney |
2W, 1L |
| Carlton |
2W, 3L |
| Adelaide |
1W, 1L, 2W |
| Port Adelaide |
1W, 1L, 1W |
| Essendon |
1W, 2L |
| St Kilda |
1W, 3L |
| West Coast |
1W, 3L |
| GWS |
1L, 4W |
| Collingwood |
1L, 3W |
| Geelong |
1L, 3W |
| Gold Coast |
1L, 2W, 2L |
| Richmond |
1L, 2W, 3L |
| Brisbane |
1L, 1W |
| North Melbourne |
2L, 2W |
| Hawthorn |
2L, 1W, 1L |
| Western Bulldogs |
2L, 1W, 2L |
| Fremantle |
3L, 3W |
|
| ELO-FF RATINGS (Average is 50) |
| Adelaide |
78.1 |
| Sydney |
66.9 |
| Port Adelaide |
62.7 |
| GWS |
62.7 |
| Melbourne |
62.1 |
| Geelong |
61.4 |
| Richmond |
55.2 |
| Essendon |
53.6 |
| West Coast |
52.5 |
| Collingwood |
52.0 |
| St Kilda |
49.1 |
| Western Bulldogs |
48.6 |
| North Melbourne |
45.5 |
| Carlton |
38.2 |
| Gold Coast |
36.2 |
| Hawthorn |
34.0 |
| Fremantle |
22.6 |
| Brisbane |
17.4 |
|
| ELO-ESPN RATINGS (Average is 1500) |
| Adelaide |
1638 |
| Geelong |
1599 |
| GWS |
1594 |
| Sydney |
1581 |
| Western Bulldogs |
1580 |
| Port Adelaide |
1567 |
| Richmond |
1544 |
| West Coast |
1541 |
| Melbourne |
1521 |
| Collingwood |
1509 |
| Essendon |
1479 |
| North Melbourne |
1478 |
| St Kilda |
1472 |
| Hawthorn |
1438 |
| Gold Coast |
1426 |
| Carlton |
1395 |
| Fremantle |
1380 |
| Brisbane |
1258 |
|
Melbourne is the hottest in the short term, Sydney in the medium term, and Adelaide and GWS remain the long term leaders of the pack.
Brisbane and Carlton are showing recent signs of life. The Saints, Bulldogs, and especially the Dockers look poor in the short term, but nobody really looks awful. Although I admit I had to check Fremantle three times to see if 41 per cent was accurate. It is.
I was surprised to see Collingwood third and Carlton eighth since Round 10. It’s also pretty clear that my ELO rating system is more reactive than ESPN’s – mine reflects current performance more than past victories, which is why the Dogs are still fifth on theirs and Melbourne’s only ninth.
An ELO system compares game outcomes to predicted outcomes and rewards the team which outperformed expectations by taking rating points from its opponent and adding to their rating.
If nothing else, all of this analysis confirms that it’s almost anybody’s race this year.
Every version produces a different arrangement of teams. No matter who you barrack for, you can create a version that gives you reason for optimism. While I can’t see a scenario where Brisbane makes finals, I can see a scenario less radical than the Longmire nightmare where just about anyone misses September.
Maybe this is the year that, if not all 18, then maybe eight, 10, 12 teams all finish at 11-11, and percentage separates a double chance from a vacation this spring. Wouldn’t that get coaches tearing hair out?
Before the wanderer wanders off, I’d like to point out that we’ve reached the part of the year where we’re starting to have rematches in the fixture. My spreadsheet of death is tracking the effect of a true ‘once around’ schedule – last year Sydney and Hawthorn would have won with 13-4, and the Bulldogs would’ve been third at 12-5 – as the 17-5 advocates, er, advocate.
I’m also tracking the potential results of an 18-4 schedule with a second “derby” game included. I promise to keep you apprised of both as the season progresses.


