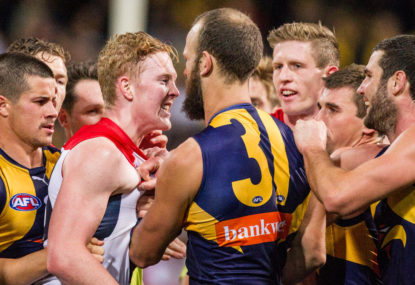
Every week, I listen to the same announcers tell me the same thing about the same half-dozen or so teams: “This is a must-win game for the Hawks-Swans-Pies-Blues-Dockers-Kangaroos! If they don’t win this one tonight, they’re all but out of the running for the eight!”
Then they lose, and next week the same announcers say the exact same thing about the exact same team!
This weekend, for example, “The Hawks won to keep their finals chances alive!” at 5-8.
However, “With that loss, the Magpies are definitely out of contention!” also at 5-8, with a higher percentage! What?
A similar situation happens within the games themselves: “If the leading team scores the next goal, it’s over for the losing team!”
Except, then they do score the next goal, and then it becomes, “If the trailing team is to have any flicker of hope, they have to score the next goal.”
What? But you just said it was over! I – but! – Ptp! – hunh?
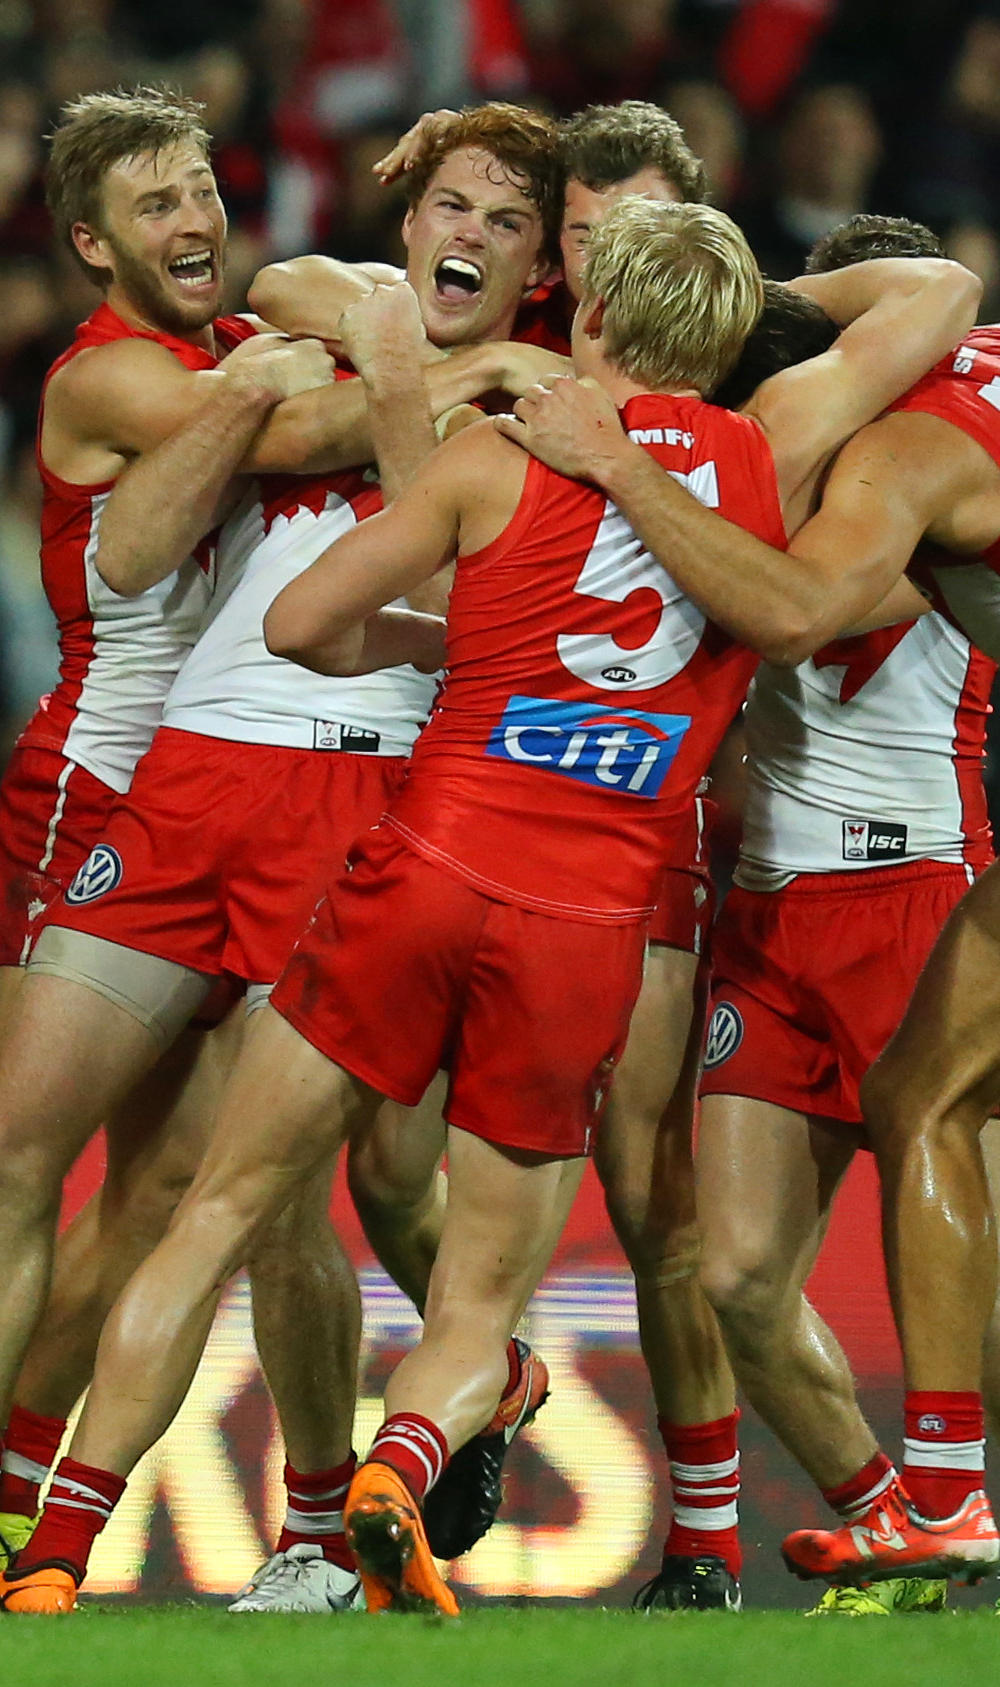
But it’s games like we saw this weekend that prove the rule that you’re never out of a game or out of a season until it becomes mathematically impossible to succeed. Even the Leigh Matthews rule is obsolete, as Sydney proved: you can win a game when you’re more goals behind than you have minutes remaining in the game – the opponent doesn’t need to consciously let down their guard, either.
What a round of football! We should’ve known we were in for something amazing when the 50-point favourites went down decisively on Thursday.
But that’s the kind of season it’s been. We’ve talked about it on this site incessantly over the last month as it’s become more and more apparent that there wasn’t going to be a 21-1 season coming from the Giants or anyone else, and that even North, Carlton, and Brisbane can beat any other team on a given day.
I teased last week about this being the year that a dozen teams end at 11-11 and percentage determines the difference between a double chance and staying home in September.
It’s not a joke anymore.
And it’s not your imagination, either; games really are closer and teams more competitive this year. Here are some point-spread tallies to back that up.
The centre column shows the average number of games with a final margin within x number of goals from 2012 to 2016 (which are the five previous seasons with 18 teams and 198 games per season). The right-hand column shows the projected number for the 2017 season, with the actual number through 13 games in parentheses, both for that particular slot and overall up to and including that slot).
| Goal margin |
2012-2016 |
2017 |
| 1 goal or less |
19.8 games |
33.8 projected games (20 actual so far) |
| 2 goals or less |
43 |
45.6 (7 more, 27 in all) |
| 3 goals or less |
59.6 |
72.7 (16 more, 43 in all) |
| 4 goals or less |
77.6 |
94.7 (13 more, 56 in all) |
| 6 goals or less |
113.4 |
126.8 (19, 75) |
| 8 goals or less |
141.5 |
153.9 (16, 91) |
| 10 goals or less |
158.9 |
170.8 (10, 101) |
| 14 goals or less |
179.6 |
187.7 (10, 111) |
| 18 goals or less |
190.8 |
198.0 (6, 117) |
| 22 goals or less |
196.5 |
same (0, 117) |
| 26 goals or less |
197.7 |
same (0, 117) |
| 32 goals or less |
198 |
same (0, 117) |
So, on average, there were about 20 games in each of the last five seasons which ended with a final margin of six points or less (including draws, of course). The highest was 22, in 2013. There have already been 20 such games in 2017, with nine rounds still to be played!
The numbers in previous years are fairly similar to those of 2012-16, but because there were fewer teams that started with the letter ‘G’, there weren’t the same number of games to compare.
There are a couple different manifestations of the ‘closer than ever’ 2017 season we’re experiencing that show up here, that one being the most obvious to a casual glance.
But those seem to come almost entirely from the ‘two goal’ games – we’ve only had seven games this year that ended with a final difference between 7-12 points, so the projected number of ‘fairly close games’ – two goals or less – is within a reasonable margin for error.
Take a close look at those three and four-goal games, the games that you’d think usually occur between two relatively equal teams when one team wins without any nail-biting. A typical recent year averages about 34 games that end with the teams between two and four goals apart, but in 2017, there have already been 29 of those, and that projects out to almost 49 such games over the season!
So, close games have become very close, and ‘normal’ games will more likely be competitive, which matches what the ladder has been telling us. The teams are simply more balanced this year.
Even the tail end of the chart echoes that sentiment: while there have been 36 games over the last five seasons with a final losing margin of more than 108 points, or 18 goals, there have been zero so far this season (despite Hawthorn’s best efforts).
Brisbane’s young team, expected to be trounced all season long and yet to be favoured in a game this season, has not lost a single game by more than ten goals yet, despite their 2-11 record. This weekend’s 60-point loss to GWS was their worse defeat thus far, and even it displayed their budding moxie with a fourth-quarter comeback of sorts.
Another example: the median winning margin for games played during the home-and-away seasons of 2012 through 2016 was 32 points. In 2017, as of Round 14, half the games have ended at a 25-point margin or lower. Even the average for the last five years of finals is higher than that, at just over 28 points a game. And you would think that the top eight teams would be more closely grouped than the whole bag of 18, wouldn’t you? By definition? Well, it was true over the last five years, and that implies we can expect even closer finals this season.
The moral of the story? Expect more of the same the rest of 2017. Expect Geelong to pull victory from the jaws of defeat at least once more, expect Richmond to have more chances to either continue or break their depressing streak of last-minute losses, and don’t expect very many century margins (if any) the rest of the year.
And if your team hits the 12-win mark? Congratulations: that may be all they need to be a contender this season!

AAP Image/Glenn Hunt
One last wandering for today from the meta-findings of the Spreadsheet of Death: I’ve compiled the results from every mid-season All Australian team I could find (14 in all this year), assigned point totals based on where it came from (Uncle Murray’s scrabbled-out list is worth less than a major publication’s version, for example), and here’s the result: the 2017 meta-Brownlow meta-mid-season meta-All Australian top 22 and more (I never meta-prefix I didn’t like).
Forwards
Jeremy Cameron (GWS) – 85 points
Eddie Betts (Adelaide) – 81
Toby Greene (GWS) – 70
Lance Franklin (Sydney) – 68
Josh Kennedy (West Coast) – 67
Ruck
Sam Jacobs (Adelaide) – 53
Midfielders
Patrick Dangerfield (Geelong) and Dustin Martin (Richmond) – 84 each
Rory Sloane (Adelaide) and Josh Kelly (GWS) – 76 each
Joel Selwood (Geelong) – 74
Gary Ablett Jr (Gold Coast) – 52
Defencemen
Elliot Yeo (West Coast) – 83
Rory Laird (Adelaide) and Alex Rance (Richmond) – 81
Sam Docherty (Carlton) – 78
Michael Hurley (Essendon) – 64
Jeremy Howe (Collingwood) – 60
Interchange
Joe Daniher (Essendon) – 52 points
Robbie Tarrant (North Melbourne) – 50
Scott Pendlebury (Collingwood) – 48
Robbie Gray (Port Adelaide) – 47
AFLX-perimental team
Dylan Roberton (Saint Kilda) – 46 points
Zach Merrett (Essendon) – 42
Marcus Bontempelli (Western Bulldogs) – 41
Brodie Grundy (Collingwood) – 40
Zach Tuohy (Geelong) – 39
Zac Williams (GWS) – 36
Dayne Zorko (Brisbane) – 32
Tom Mitchell (Hawthorn) – 31
Charlie Dixon (Port Adelaide) – 30
Seb Ross (Saint Kilda) – 29
Jeff Garlett (Melbourne) – 28