The crucial cogs of AFL's Round 7: Which players need to be the difference makers?
We’re taking a look at one player from each team that needs to make a difference this week, starting with the ANZAC Day games.


One of the main reasons I enjoyed the book Moneyball so much was that I felt like I was reading about a bunch of kindred spirits, people who were seeking better analysis of a game through more meaningful statistics.
The difference was that I was looking at AFL football. That and my motivation to beat the bookmakers at their own game.
I’ve been using statistics to measure form in the AFL for about eight years now. At the end of each season I usually tinker with my spreadsheet and look at correlations between season wins and each category of information I collect.
I might add additional categories of information if reason tells me it will help improve my prediction modelling.
If you’re a Fox Footy viewer you can’t have failed to notice David King’s (and Champion Data’s) mantra – Contest, Attack, Defend.
In other words if a team wins more contested possessions (CP), has a higher disposal efficiency (DE) and wins the tackle count (T), victory results 96.1 percent of the time.
This makes sense. If you win the ball better than your opponents and use it better you’ll probably win, especially if you’re also working hard to put pressure on your opponents when they have the ball.
But can we improve on Fox Footy model? I think so.
Firstly, I think we should normalise the figures rather than use differentials.
We already do this in a way that’s very familiar to fans, with our ladder and points scored for and against – we call it percentage.
Everyone understands this is fairer than a straight point differential figure, so why not apply a similar calculation to CP, DE and T?
Once you have these three percentage scores you can assign them different weightings, based on your own perception of their value, and combine them to get a total score of Proficiency (or whatever name you choose).
My end-of-season evaluation from last year showed that tackling performance had the lowest correlation with games won. Therefore when I make the calculation I weigh both CP and DE as twice as valuable.
With the formula I give teams a positive proficiency score (PS) if they tally above 100 percent and teams a negative proficiency score if they are less than 100, just like percentage.
Last year a team’s season performance in my PS category correlated very highly with season wins. As such, chances of victory in any given match increase dramatically as the difference between the two teams’ PS scores increases.
If you’re like me, you can keep your PS formula in a spreadsheet. Then, on your smart phone, you can call up the figures from the Superfooty live site while watching the game at the pub, plug the figures into your spreadsheet and make/adjust bets accordingly.
Another improvement would be to show us quarter by quarter splits and game totals of CP, DE and T, so that we can see how a team is improving its performance (or why it is continuing to go down the gurgler).
Finally a better descriptor than DE would be to split it into kicking efficiency and handball efficiency. I’m sure this wouldn’t be too hard for the Champion Data boffins.
Currently if Sam Gilbert handballs to three teammates well but sprays the ball over a teammate’s head with a kick, his disposal efficiency would be 75 percent. Such a percentage is considered quite good, but is not at all reflective of what is going on.
I think I’ll leave it there for now. While I have a bit more to say about statistical analysis in footy I’m not sure if the land of The Roar is populated with the same amount of stats nerds as the book Moneyball.
Though if the response to this article is positive, you may be hearing more from me…
Who’s in your ultimate team? Pick the best team and compete with other fans for daily prizes on Draftstars. For the best odds on the game try out Aussie bookmaker PlayUp. Think. Is this a bet you really want to place? Set a deposit limit.
We’re taking a look at one player from each team that needs to make a difference this week, starting with the ANZAC Day games.

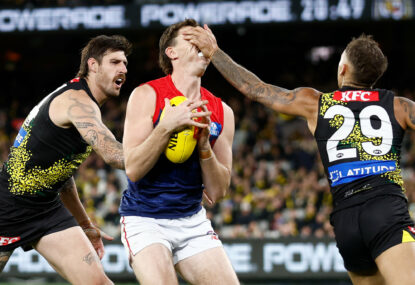
A touching moment for the Demons star with Jacob Hopper.

It's a festival of footy as Anzac Round dawns, with matches to be played across a whopping five days in 2024's most spread-out 'weekend'…
There's an old saying that you should never argue with an idiot, because they'll drag you down to their level and then beat you…
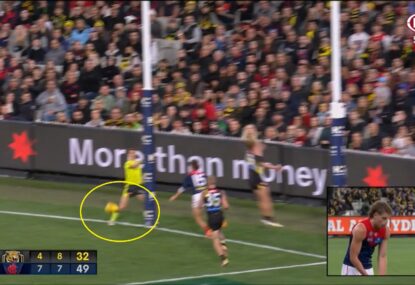
The ball hit the boundary umpire's leg and rebounded back into play, leading to debate over whether a throw-in should have been called for.