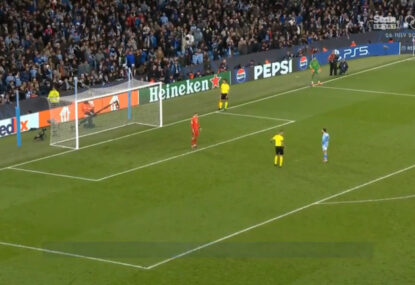
WATCH: Manchester City can't believe their luck after missing first-half sitter of a tap-in
Not only did Erling Haaland's header hit the bar, but Bernardo Silva missed the rebound tap-in that came off his knee. Manchester City went…

Towards the end of the group stage, I compared the 2014 World Cup to previous World Cups across a number of measures – goals per game, both teams to score, goal margins and result ratios.
At that point in time, the 2014 World Cup compared favourably across all four key measures. Since then the goals have dried up.
There have been a number of 1-0 results and while we have had a number of early goals, not many of the quarter finals exploded into life the way many hoped. So how does the 2014 World Cup compare at the end of the quarter final stage?
Goals per Game
After the barrage of goals we saw flying in during the group stage – 2.83 per game, the highest in any group stage since 1958 – they have since dried up to a paltry 1.92 per game in the knock-out rounds.
This is much lower than 2010, where 2.67 goals per game were scored, 1994 where 3.33 goals hit the back of the net and 1998 when 2.83 goals were scored. Overall the average number of goals in 2014 is a respectable 2.65 and above the last three World Cups but below 1998, 1994 and 1982.
Both Teams to Score
So the goal average has dried up and unfortunately so has the percentage of games where both teams find the back of the next. At the end of the group stages, the percentage of games where both teams had scored was at a record high of 60 per cent but since then only 50 per cent of games have had both teams scoring which is broadly in line with the average from the last seven World Cups at 49 per cent.
Goal Margin
At the end of the group stages, the percentage of games ending in a one-goal margin was at an equal high of 44 per cent. The second round games have been quite close with seven of the twelve games ending in a one-goal margin which is slightly above the average of the last seven World Cups at 56 per cent. Dulling the excitement to a certain extent is that four of these seven have ended 1-0.
Result Ratios
The 2014 Group stage saw 81 per cent of games end in a result which was the highest percentage since 1978. The knock-out stages have been much closer with six of the 12 games ending in a draw with three going onto penalties and three ending with results in extra time. The equals the highest percentage of games which have ended in a draw (50 per cent) set in 1990.
So the goals have dried up, the percentage of games where both teams have scored has dropped, and less games are ending in results. Games with a one goal margin have stayed on average but with only one team scoring in a higher percentage of games these one goal margin games aren’t as exciting as they were in the group stages.
The next question once all this is digested is why the reduction in the measures that made the group stages so exciting?
Well, the number of attempts per game has actually gone up in the knockout stages when compared to the group stages with 30.5 shots per game compared with 25.8. At the same time the ratio of shots to goal has gone from 11 in the group stages to 17 in the knockout stages.
So why then have the goals per game gone down so dramatically when the attempts have been going up?
The answer lies between the posts. A goalkeeper has received the man-of-the-match award in 6 of the 12 knockout games so far, which is the most significant reason for the reduction in goals in the knockout stages.
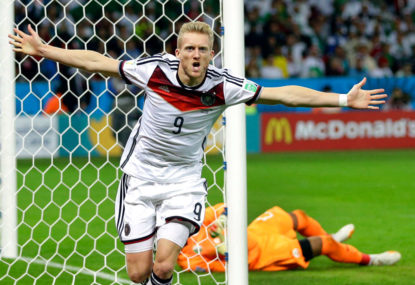
Tim Howard’s heroics against Belgium stand out, but the Costa Rican keeper Keylor Navas was man-of-the-match in both his team’s knockout stage games. Both Ochoa from Mexico, Rais from Algeria and Julio Cesar from Brazil all won man-of-the-match awards for great performances after stopping goals in the knockout stage.
As if the goalkeepers being the stand out performers wasn’t enough for those that love clean sheets, in two of the remaining six games where a goal keeper didn’t receive the award, a central defender (Mats Hummels and David Luiz) received the award.
Admittedly, both scored goals but both defended well enough in these games to be given the award.
History tells us that three of the remaining four games will be tight with the average number of goals per game at the semi-final stage in the past seven World Cups being 2.3 and the last seven finals being 2.
Here’s hoping that those goalkeepers go back to their group stage form and we go back to seeing goals raining down in Brazil!
Are you the ultimate team manager? Pick your own superstar team and go head to head with other football fans for glory and cash prizes on Draftstars. Imagine what you could be buying instead. Set a deposit limit.
Not only did Erling Haaland's header hit the bar, but Bernardo Silva missed the rebound tap-in that came off his knee. Manchester City went…
After Manchester City saved Luka Modric's shot, the person in the stands didn't return the ball, holding up the penalty shootout for almost a…
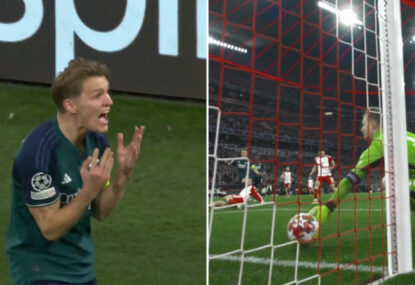
Bayern Munich scored the only goal to defeat Arsenal 1-nil and progress to the semifinals. Former player Martin Keown says it's disappointing his former…
After taking an early advantage saving a Real Madrid shot, all momentum was lost when Bernardo Silva just chipped the ball at the keeper…

Manchester City’s campaign to retain the UEFA Champions League is over after a heartbreaking penalty shootout defeat to Real Madrid despite dominating almost every…

With his team chasing a vital goal Martin Odegaard was not happy the officials didn't see a touch from the keeper as the ball…