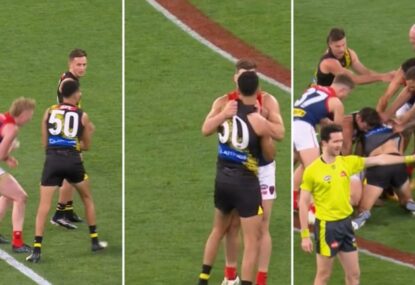
Marlion Pickett gut-punches Oliver right next to Jack Viney, melee obviously ensues
Spicy stuff at the MCG!

I have put together a series of season predictions for every team in the 2016 season.
The basis for these predictions rests on some quantitative modelling I’ve put together. Data analytics in sports are a relatively recent phenomenon but certainly have found a prominent place in US sports.
The analytics revolution has influenced the AFL but has not quite taken hold in the way that they have in other professional sports.
To provide some foundational understanding I’ll describe what I have tried to achieve with my data analysis.
What helps teams win?
In the first instance I have performed some correlation analysis with a range statistical categories and how much a team scores and how much they are scored against.
The result is finding which on-field actions correlate most closely with scoring (offense) and being scored against (defence). The result was perhaps less interesting than I had hoped for.
That is, that the types of things that teams do that either correlate with scoring (good offense) or not being scored against (good defence) are less intricate and detailed than I had expected.
Even when breaking down something simple like possession into contested and uncontested possession it became apparent that the correlation was similar for both of these categories.
The data sets I analysed went back as far as the past 10 years, which, I felt, was a larger enough sample size to make the results meaningful.
The following stats have the most significant correlation with either scoring or not being scored against.
– Kicking
– Handball
– Marks
– Tackles
– Clearances
– ‘One Percenters’ – (includes spoils, smothers, shepherds and running bounces)
Each statistical category has been weighted to indicate how influential that statistic is in terms of offense and defence.
One specific category that had a very strong correlation with not being scored against but no correlation with scoring over the past 10 years was the number of hitouts a team achieved. For this reason I factored this into my calculations of team performance but not for individuals because this category is specific to only very few players on a teams list.
Predictive modelling
From here I was able to analyse the aforementioned statistics for individual players over the same period of time and build out predictive models for each category using simple regression analysis.
This has enabled me to map the career trajectory of every player in the AFL who played at least one senior game in 2015. Different models were built for both offense and defence.
Then using the correlation weighting developed in the first instance I was able to build an algorithm that synthesised the combination of each of the statistical categories into one single number for each player.
Different models were produced for different positional considerations. That is a player classified as a midfielder would not be considered to have the same career trajectory as a player considered a key forward.
As such I was able to produce predictive models for midfielders, key forwards, general forwards, key defenders, general defenders and rucks. In some cases this made for difficult classification as some players play a variety of roles and are not easily classified. Hopefully in most cases I have made accommodations for this and qualified my predictions by acknowledging that players versatility.
Ranking the players and teams
So to try and be straightforward, what I have done is a) find the most important statistics required for scoring and not being scored against and weighted these accordingly, b) build predictive models to map the likely individual output in each of these statistical categories based on that players experience and c) using aforementioned weighting built an algorithm that sums a players overall value (offense and defence) based on their predicted output in each of the most important statistical categories.
Let me try and explain the process.
If we start by looking at an individual player, say Brodie Smith from the Adelaide Crows. Last year Smith’s stat line looked like this
Kicks: 12.7
Handball: 5.5
Marks: 3.9
Tackles: 1.9
Clearances: 1
One Percenters: 2.9
Smith is classified by a variety of sources as a ‘general defender’ (despite potentially moving into a permanent midfield role and rotating through the midfield at times). I would then go to my predictive models for general defenders in each statistical category and based on the player’s experience – Brodie Smith has played five seasons – assign a model of best fit to that player based on their output in that specific category up to that point in their career.
In Smith’s case this means that in 2016 we can expect the following output
Kicks: 14.2
Handball: 5.9
Marks: 4.7
Tackles: 1.9
Clearances: 1
One Percenter’s: 3.5
Then using my algorithm for offense and defence I would plug in this data and weighting it accordingly, produce a single number for that players offense and defence. These are the figures that would then be used to rank each player within their team and the entire league.
Predicting team output for offense and defence
Having used these mathematical methods to produce a figure for individual performance I then performed regression analysis to see produce a model that could tell me what the sum total of players on a particular team should produce in terms of offense and defence. This then has enabled me to predict the likely average output of each team’s best 22.
In practice not every team fields their exact best 22 players every week due to injury and other selection considerations. As such the numbers I have produced for a teams likely score and likely score against may jar with some readers. Please bear in mind that I am estimating based on each team fielding its very best 22 every week, uncompromised by injury and all else that compromises selection.
In addition the following template has been used as the basis for selecting the best 22. This template is taken from the AFL coaches association All Australian squad. Their definition of roles across the ground I think gives the best and most modern indication of the way teams are selected in the 21st century.
Not every team is necessarily able to follow this template exactly but I have tried to stay faithful to it. This also gives the selected sides a sense of practicality and realism as opposed to just picking the 22 best midfielders or 22 best individual players and playing them completely out of position.
Backs Tall/Medium Defender Key/Tall Defender Small Defender
Half Backs Medium Defender Key/Tall Defender Medium Defender
Centre Inside/Outside Midfielder Inside Midfielder Inside/Outside Midfielder
Half Forwards Inside/Outside Midfielder Key Forward High Half Forward
Forwards Small Forward Key Forward Tall/Medium Forward
Followers Ruck Inside Midfielder Inside Midfielder
Interchange Inside/Outside Midfielder Inside/Outside Midfielder Inside/Outside Midfielder
Second Ruck
Over the next couple of months I intend to write a post giving a snap shot of each team going into 2016 using predictions based on my quantitative analysis.
Each post will contain the following.
– That team’s best 22
– Best midfielder
– Best defender
– Best forward
– Biggest strength
– Biggest weakness
– Likely average output of best 22
– Likely wins
Please keep checking back in with me if you’re an AFL fan, or a data analytics fan. I would be more than happy to hear from people if you want to contact me directly or comment. Certainly if you have any questions about my methods and process I’d love to hear from you.
I am sure I probably haven’t done the best job of explaining myself here and I’m more than happy to clarify anything that doesn’t make sense.
Also if you’re checking back in to see what I have to say about your team I will post teams in alphabetical order. First up will be the Adelaide Crows and I’ll work my way from there.
Who’s in your ultimate team? Pick the best team and compete with other fans for daily prizes on Draftstars. For the best odds on the game try out Aussie bookmaker PlayUp. Think. Is this a bet you really want to place? Set a deposit limit.
Spicy stuff at the MCG!
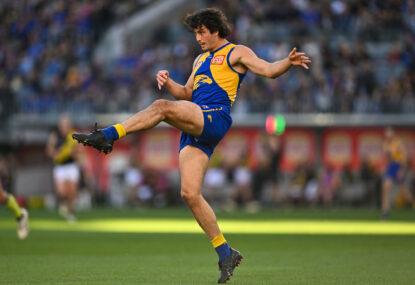
West Coast defender Tom Barrass will miss the Eagles' clash with Gold Coast, after the AFL Tribunal upheld his one-match suspension for a dangerous…

Round six of the AFL provided us with plenty of talking points. Some teams are starting to build momentum whilst others are struggling to…

The Pies premiership player was alluding to the discussion around "body shaming" in AFL fitness tests, with skinfold tests for draftees recently scrapped, adding…

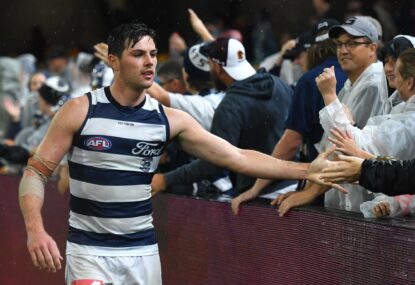
Has there ever been a team more “quietly” unbeaten and on top of the ladder, like Geelong this year? The Cats are a game…
The polarising Hawks figure pondered the idea of pursuing a job behind the mic. Ginnivan and Kane Cornes have history, with the latter previously…