


- Video
-
Club Roar
Captured a great grassroots sporting moment? We want to see it!Content Collections
The Roar Community
- Join
- Login
The Six Nations finale was meant to be a head-to-head between Eddie Jones’ resurgent England and a powerful Ireland.
The Irish team appeared fresh from an Autumn taking on the giants from the southern hemisphere.
What transpired was a game that was so one-sided, it was virtually just a spectacle by the start of the second half.
From our seat, England looked knackered – devoid of energy and impetus. Ireland, on the other hand, were dominating collisions and playing with a verve and dominance England couldn’t live with.
But why did England look so lethargic?
One plausible explanation comes from an analysis of the 2017 Lions tour – the introduction of those Lions players back into domestic rugby, and the amount of match time the players have contributed in the season to date.
Let’s look at each stage in sequence.
1. The Lions Tour
The first table shows the total game time (in minutes) for the Lions’ squad members:
| Player | Country | Gametime (mins) | Player | Country | Gametime (mins) |
| Taulupe Faletau | Wales | 480 | Courtney Lawes | England | 258 |
| Liam Williams | Wales | 424 | George Kruis | England | 258 |
| Elliot Daly | England | 418 | Robbie Henshaw | Ireland | 258 |
| Alun-Wyn Jones | Wales | 411 | Jonathan Joseph | England | 240 |
| Anthony Watson | England | 397 | Dan Biggar | Wales | 238 |
| Johnny Sexton | Ireland | 387 | Leigh Halfpenny | Wales | 231 |
| Jack Nowell | England | 384 | James Haskell | England | 226 |
| CJ Stander | Ireland | 384 | George North | Wales | 223 |
| Jamie George | England | 376 | Peter O’Mahony | Ireland | 223 |
| Maro Itoje | England | 372 | Kyle Sinckler | England | 201 |
| Owen Farrell | England | 365 | Jack McGrath | Ireland | 186 |
| Conor Murray | Ireland | 362 | Jared Payne | Ireland | 185 |
| Jonathan Davies | Wales | 348 | Rhys Webb | Wales | 169 |
| Tadhg Furlong | Ireland | 338 | Ken Owens | Wales | 155 |
| Sean O’Brien | Ireland | 334 | Stuart Hogg | Scotland | 99 |
| Mako Vunipola | England | 326 | Ross Moriarty | Wales | 80 |
| Sam Warburton | Wales | 323 | Allan Dell | Scotland | 67 |
| Ian Henderson | Ireland | 315 | Finn Russell | Scotland | 38 |
| Ben Te’o | England | 304 | Juston Tipuric | England | 267 |
| Joe Marler | England | 290 | Rory Best | Ireland | 269 |
| Greg Laidlaw | Scotland | 269 | Dan Cole | England | 261 |
| Tommy Seymour | Scotland | 261 |
Although there is a large spread in the number of minutes logged by each player – there is no real bias towards players in a specific nation.
The same story is found when we look at minutes played in the three Test matches (below).
| Lions Test minutes played | |
| Player | Total minutes |
| Owen Farrell | 240 |
| Eliott Daly | 240 |
| Taulupe Faletau | 240 |
| Jon Davies | 240 |
| Liam Williams | 231 |
| Jamie George | 216 |
| Connor Murray | 216 |
| Sean O’Brien | 199 |
| Maro Itoje | 193 |
| Tadhg Furlong | 178 |
| Anthony Watson | 176 |
| Johnny Sexton | 176 |
| Mako Vunipola | 175 |
| Sam Warburton | 173 |
| Alun-Wyn Jones | 168 |
| George Kruis | 80 |
| Jack McGrath | 67 |
| Ben Te’o | 64 |
| Jack Nowell | 64 |
| Kyle Sinckler | 62 |
| Courtney Lawes | 53 |
| Peter O’Mahony | 53 |
| CJ Stander | 39 |
| Rhys Webb | 24 |
| Ken Owens | 24 |
| Leigh Halfpenny | 9 |
We see the big names at the top of the tables, but the playing load was fairly evenly spread across England, Ireland, and Wales. No one nation dominated the selections.
2. Transition back to domestic rugby
The final Lions test was on July 8. The Pro14 and Aviva Premiership domestic seasons started on the weekend of September 1, 2017.
Looking at the players in the third test who picked in the final Lions squad against New Zealand – and researching their return date to domestic rugby – we see a very interesting pattern.
| Player | Nation | Club | Days break |
| C Murray | Ireland | Munster | 84 |
| CJ Stander | Ireland | Munster | 84 |
| J Sexton | Ireland | Leinster | 83 |
| S O’Brien | Ireland | Leinster | 83 |
| T Furlong | Ireland | Leinster | 83 |
| J McGrath | Ireland | Leinster | 83 |
| AW Jones | Wales | Ospreys | 76 |
| R Webb | Wales | Ospreys | 76 |
| E Daly | England | Wasps | 71 |
| J George | England | Saracens | 70 |
| J Davies | Wales | Scarlets | 69 |
| K Owens | Wales | Scarlets | 69 |
| L Williams | Wales | Saracens | 63 |
| O Farrell | England | Saracens | 63 |
| M Vunipola | England | Saracens | 63 |
| A Watson | England | Bath | 57 |
| T Faletau | Wales | Bath | 57 |
| M Itoje | England | Saracens | 56 |
| K Sinckler | England | Harlequins | 56 |
| C Lawes | England | Northampton | 56 |
| B Te’o | England | Worcester | 55 |
| J Nowell | England | Exeter | 55 |
| S Warburton | Wales | Cardiff Blues | N/A |
In simple terms, this shows that the Irish players had the longest ‘rest period’ between the end of the Lions tour and their return to domestic rugby.
Next came Wasps players, and then those from the Welsh regions. Interestingly enough, the two Welsh players who returned the earliest both play for English teams.
To pull out a couple of individual cases – Maro Itoje returned for Saracens on the opening day (September 2) and played the full 80 minutes for the first four games of the season.
His colleague Owen Farrell, who had played every minute of the three Lions tests, returned a week later on September 9.
By comparison, the likes of Conor Murray, Johnny Sexton and Tadhg Furlong returned to action around the end of September.
This means that Farrell’s season will have been nearly three weeks longer than Sexton’s by the time they had met in Twickenham at the end of the Six Nations.
If we look at the England squad as a whole, 18 of the 23 players started the season in game week 1 (September 1, 2, and 3).
The return dates are just one aspect of player welfare, bringing the focus to the number of game minutes played over the whole 2017/18 season.
(AAP IMAGE/Adam Binns)
3. Minutes played over the whole season
The figures are quite surprising.
If we look at both match day squads the Ireland squad have played an average of 1006 minutes over the season, which equates to 12.58 games.
England, by comparison, has played 1367 minutes on average, or 17.09 games.
This means, on average, each of the Ireland players who took to the pitch on the final Six Nations weekend had played 4.5 games fewer than their English counterparts.
So not only were the key Irish players who went on the Lions tour getting a longer rest than the English based players, but the Irish squad as a whole has also played fewer games over the season to date.
The combination of these two factors must have a material impact on a game at the elite level.
Let’s compare a few key positions (the raw data is at the bottom of the article):
Tighthead: Dan Cole (1557 minutes) v Tadhg Furlong (1005)
Loosehead: Mako Vunipola (1473) v Cian Healy (890)
2nd row: Maro Itoje (1422) v Iain Henderson (1313)
Scrum-half: Richard Wigglesworth (934) v Conor Murray (1334)
Outside half: Owen Farrell (1563) v Jonny Sexton (937)
When we look at this data we need to consider the context to the numbers.
Injuries, selection and suspensions will play a part, but the overall picture is clear – Ireland better manages its players’ workloads.
This chart below displays the total minutes played for all 46 players and shows Jacob Stockdale as the Irish player who has played the most minutes this season.
In addition, we see nine England players in front of him with more minutes.
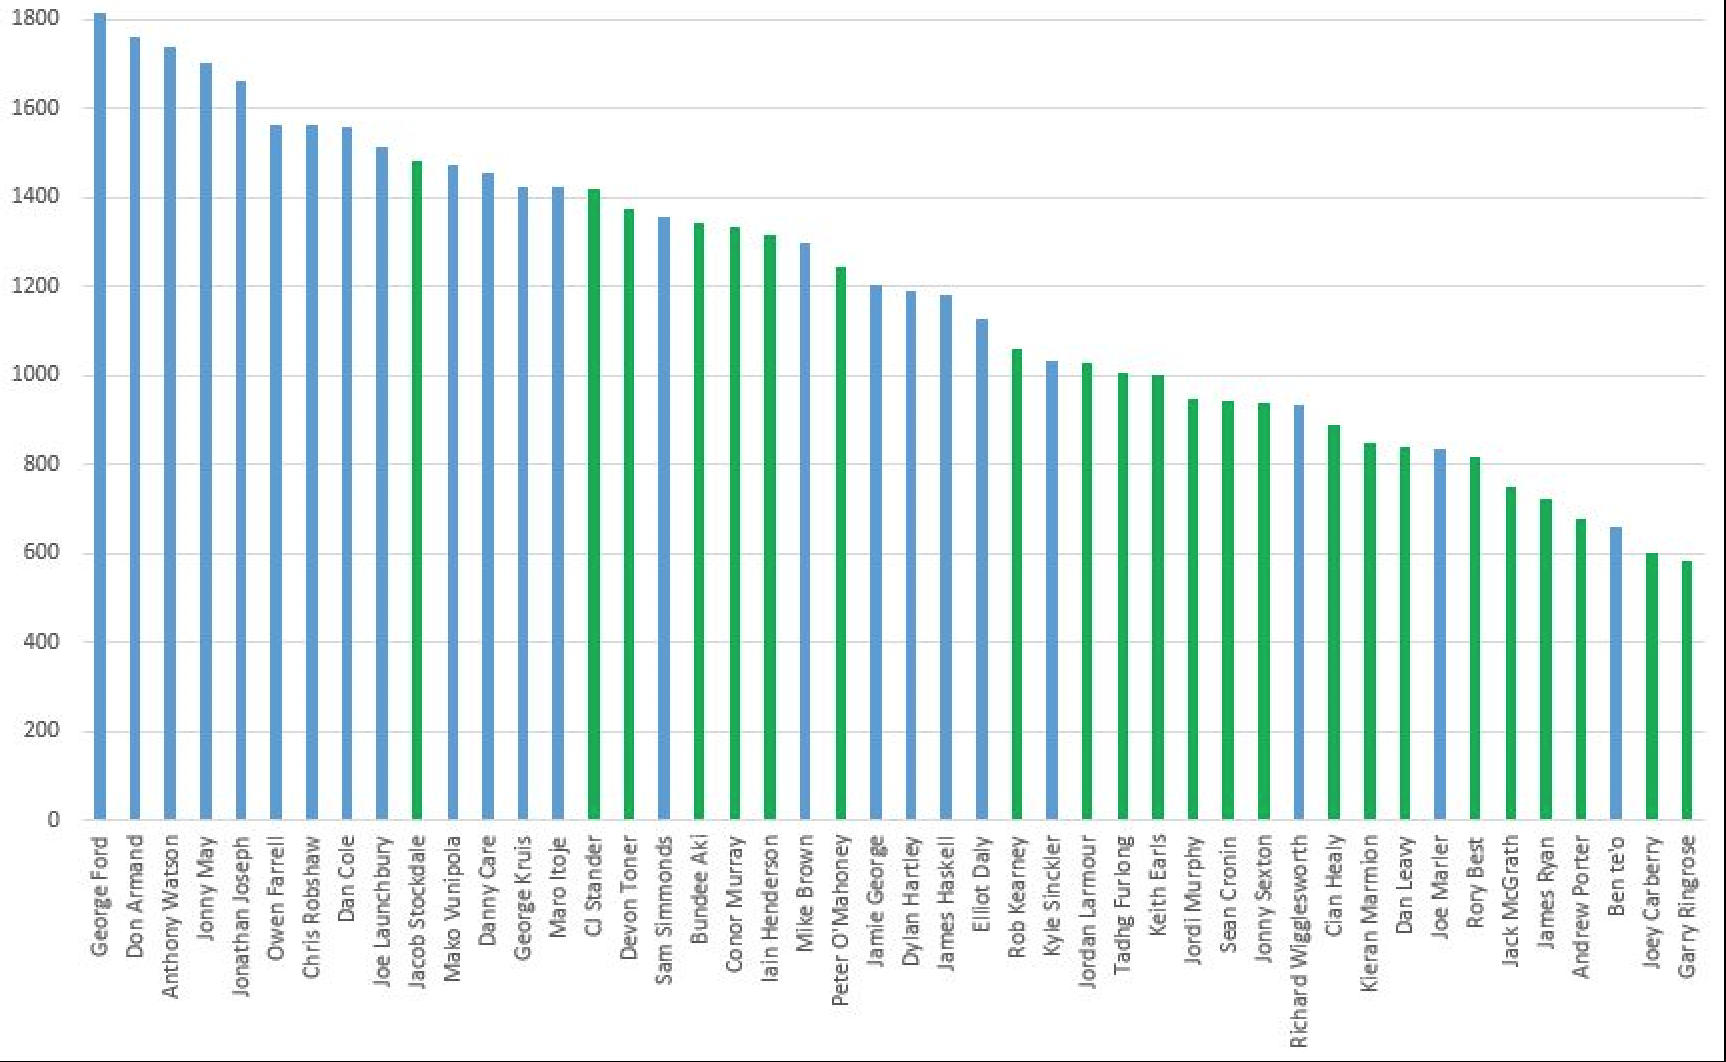
If we then look at the breakdown of where the minutes have been played we see an interesting pattern:
| Ireland | England | |||
| Minutes | Games | Minutes | Games | |
| Average squad over season | 1006 | 12.58 | 1367 | 17.09 |
| Average in domestic rugby | 386 | 4.83 | 677 | 8.46 |
| Average in European rugby | 277 | 3.46 | 346 | 4.33 |
| Average in Test rugby | 342 | 4.28 | 341 | 4.26 |
The minutes played in Test rugby over the season are nearly identical (England, 341 minutes and Ireland, 342) while in Europe, the English squad played on average 0.87 of a game more than their Irish counterparts.
The major disparity comes in their appearances in domestic rugby. The Irish match day 23 that played against England had only played an average of 4.83 games in the Pro 14 (after game week 17).
The England squad had played an average of 8.46 games (after game week 17).
Helping Ireland win the Grand Slam?
A combination of a longer pre-season for the Irish Lions players plus the substantially lower playing time during the season must have given Ireland an advantage over England in this year’s Six Nations tournament.
Of course this isn’t the only consideration in determining who wins a game of rugby, and we should also consider tactics, experience, the weather, the referee and the multitude of factors that determine who wins a game but at this elite level, the difference of 4.5 games per player (or over a month of extra rugby) has to be a material influence.
Below is the England squad for the England v Ireland Six Nations 2018 fixture, showing minutes played during the 2017/18 season by tournament.
| Player | Premiership minutes | Test minutes | Europe minutes | Anglo-Welsh | Total minutes |
| George Ford | 880 | 535 | 400 | 0 | 1815 |
| Don Armand | 1264 | 14 | 480 | 0 | 1758 |
| Anthony Watson | 793 | 465 | 480 | 0 | 1738 |
| Jonny May | 774 | 526 | 400 | 0 | 1700 |
| Jonathan Joseph | 779 | 401 | 480 | 0 | 1660 |
| Owen Farrell | 605 | 480 | 478 | 0 | 1563 |
| Chris Robshaw | 761 | 626 | 176 | 0 | 1563 |
| Dan Cole | 741 | 469 | 347 | 0 | 1557 |
| Joe Launchbury | 621 | 412 | 480 | 0 | 1513 |
| Mako Vunipola | 594 | 463 | 416 | 0 | 1473 |
| Danny Care | 744 | 378 | 334 | 0 | 1456 |
| George Kruis | 815 | 171 | 439 | 0 | 1425 |
| Maro Itoje | 572 | 544 | 306 | 0 | 1422 |
| Sam Simmonds | 638 | 350 | 366 | 0 | 1354 |
| Mike Brown | 635 | 358 | 304 | 0 | 1297 |
| Jamie George | 569 | 274 | 359 | 0 | 1202 |
| Dylan Hartley | 513 | 349 | 329 | 0 | 1191 |
| James Haskell | 661 | 109 | 358 | 51 | 1179 |
| Elliot Daly | 430 | 400 | 295 | 0 | 1125 |
| Kyle Sinckler | 735 | 75 | 221 | 0 | 1031 |
| Richard Wigglesworth | 540 | 98 | 296 | 0 | 934 |
| Joe Marler | 507 | 108 | 220 | 0 | 835 |
| Ben Te’o | 414 | 247 | 0 | 0 | 661 |
Ireland squad for the England v Ireland Six Nations 2018 fixture, showing minutes played during the 2017/18 season by tournament.
| Player | Pro14 minutes | Europe minutes | Test minutes | Total minutes |
| Jacob Stockdale | 551 | 377 | 555 | 1483 |
| CJ Stander | 400 | 480 | 538 | 1418 |
| Devon Toner | 525 | 440 | 410 | 1375 |
| Bundee Aki | 463 | 346 | 535 | 1344 |
| Conor Murray | 373 | 452 | 509 | 1334 |
| Iain Henderson | 458 | 480 | 375 | 1313 |
| Peter O’Mahoney | 315 | 447 | 481 | 1243 |
| Rob Kearney | 267 | 243 | 549 | 1059 |
| Jordan Larmour | 785 | 176 | 65 | 1026 |
| Tadhg Furlong | 242 | 402 | 361 | 1005 |
| Keith Earls | 320 | 303 | 377 | 1000 |
| Jordi Murphy | 737 | 99 | 112 | 948 |
| Sean Cronin | 567 | 307 | 70 | 944 |
| Jonny Sexton | 247 | 193 | 497 | 937 |
| Cian Healy | 242 | 260 | 388 | 890 |
| Kieran Marmion | 486 | 230 | 133 | 849 |
| Dan Leavy | 330 | 145 | 363 | 838 |
| Rory Best | 148 | 192 | 476 | 816 |
| Jack McGrath | 312 | 219 | 218 | 749 |
| James Ryan | 160 | 211 | 353 | 724 |
| Andrew Porter | 402 | 42 | 233 | 677 |
| Joey Carberry | 299 | 182 | 121 | 602 |
| Garry Ringrose | 264 | 160 | 160 | 584 |
Join The Roar rugby editor Christy Doran, former Wallaby Matt Toomua and a cast of regular and special guests as they look at the biggest issues in the game on The Roar Rugby Podcast. If you’re looking for great odds on the next game check out Aussie bookmaker PlayUp. Chances are you’re about to lose. Set a deposit limit.