There’s been a lot of numbers flying around this weekend trying to put some context around Round 1 results and what they mean going forward. Here they all are, with some thoughts attached.
A warning: this column is going to be shorter than usual, and have a much heavier focus on abstract analysis than usual.
It’s only Round 1, and I shared my initial thoughts on the football played in my new Monday morning column on… Monday.
In the past, the first midweek column of the year hasn’t really hit the mark, because it’s difficult to say much that isn’t hot air. And folks the hot air quota in football commentary is oversubscribed without mine adding to it.
Instead, I want to spend some time here working out how much Round 1 results matter in the scheme of the season. Not matter in a quantitative sense, in so far as, for example, a win in Round 1 matters more than a win in Round 13. A win in Round 1 counts for the same four premiership points that a win in Round 13 counts for.
There is some jiggery-pokery around individual matchups and the like – for instance, Geelong’s win over Melbourne may end up being significant in deciding who finishes fourth and who finishes fifth – but in the main, a win is a win is a win.
What we’re interested in here is to what extent we should observe a result in Round 1 and let that colour our view of the season-long world. We can approach this problem in a few different ways.
Winning the first game of the season matters, but not in the way you think
The statistic I’ve seen floating around the internet this year has been in nine of the past ten years the eventual premier has spent 100 per cent of the season inside the top eight.
This also implies the eventual premier has won their first-round game in nine of those ten seasons – the only way to be inside the top eight after one round is to win – unless there is something crazy like two draws to open the season.
In the past decade, Hawthorn’s first up loss to Geelong in 2013 meant it was the only eventual premier who didn’t win first up and therefore didn’t spend the full year inside the top eight. They were back in from Round 3 and didn’t exit thereafter.
By itself, this would suggest a Round 1 win is a fairly powerful indicator of future success. Indeed, since 2003 – a 15 season sample – teams that win their first game of the season have won an average of 11.3 of their final 21 games, compared to 9.8 for teams who lost in Round 1.
Matt Cowgill, of The Arc and ESPN, looked into this last season and showed how many future wins and losses a team could expect to garner given its record at any point in the season.
The relationship is strong: winning more than you lose begets more winning and less losing.
Why is this? I would theorise that a team is who it will ultimately be from the first quarter of the first game of the season.
The glaring flaws, or glowing strengths, are there, and there is only so much teams can do once up and running to address them. Both Richmond and the Western Bulldogs, in 2017 and 2016 respectively, showed from their first games of the year that they were going to be very sound football teams in their premiership years.
By contrast, we’ve known pretty early on that Fremantle, Carlton and the Brisbane Lions have been the three worst teams in the league in the past two seasons.
How long does it take for a team to “settle in” to the year?
Round 1 is important, but it’s not the be-all. One way we can look at this is to compare a team’s round by round winning percentage to its end of season win percentage, and see how the two are correlated.
That would tell us how long it takes for a team to, for want of a better term, ‘settle in’ to their year.
To do this I’ve taken the same 15 seasons worth of data used above, looked at every team’s winning percentage after each game they have played (to take into account bye rounds and the change from a 22 round season to a 24 round season and then to a 23 round season) and compared it to their end of season winning percentage.
I’ve then run a basic correlation analysis on what works out to be 5,236 data points, which yields the below.

After one game, the correlation between winning percentage and 22 game winning percentage is 0.29 – weak in the scheme of things. After two games, the correlation is 0.55 – getting stronger.
By the time we get to six games played, the correlation is strong (0.77), and perhaps more interestingly the marginal change in correlation per win slows down significantly.
In a very crude sense, we learn the most about a team’s likely end of season winning percentage in the first handful of rounds in the year. We don’t learn everything, because the correlation continues to rise as the season progresses, but the heavy lifting is certainly achieved in the first six or so games of a given team’s output.
We see this with a team’s percentage, too. There is a very similar relationship as there is with winning percentage, albeit the relationship is a little stronger. This makes sense – a team’s points for and against are a more reliable indicator of underlying strength. It’s the reason I drone on about Pythagorean wins.

Correlation is nice, but to what extent can we rely on a team’s winning record and percentage at a given point in the season as a means of predicting their future record? It takes a little longer to get some signal – but the signal starts to accumulate around that Round 6 mark as above.

So far, we’ve used a team’s incremental performance as a means to shed some light on full season team performance. What about if we used incremental performance – a winning percentage over a certain number of rounds – to predict future winning percentage only?
For example, to what extent is a team’s record after four games able to predict its performance over the remaining 18 games as an isolated example?
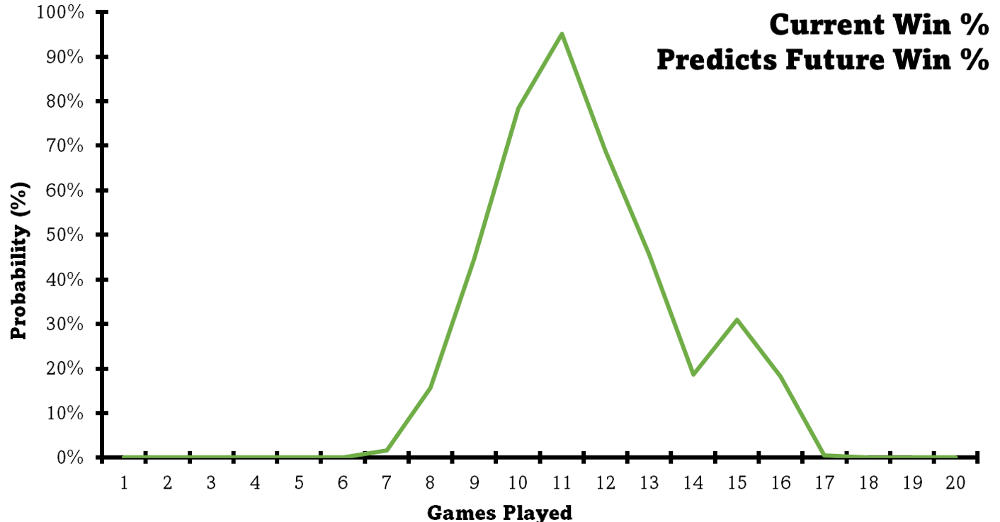
It turns out there is a sweet spot: between nine and 13 games. After nine games, a simple regression model says we can be moderately confident that a team’s record represents what its record will be over the final 13 games.
At the halfway point, we basically know everything we need to know: we can be supremely confident that a team will turn in a second half of the season performance that’ll be similar to their first-half performance.

There is a sample size issue here, which is why we get the most predictive results when we have a reasonable sample of games on either side. However, the relationship is fairly clear.
Locking in the top four
That’s all interesting, but in my mind doesn’t quite satisfy the ultimate question: at what point do we concede that a winning team is a winning team?
I’ve looked at something I called “ladder settling” a couple of times in the past. At any point in a season, how many September participants have been in the final eight?
Since the 2000 season, we’ve known an average of five of the final eight after one round, six after four rounds, and seven after 13 rounds. The final eight is rarely settled before the final round of the season, however.
Here’s what each season looks like.

If we were to limit this just to the eventual premier, we get something that looks like this. In 394 out of 404 rounds since the 2000 season, the eventual premier of the season has been in the final eight at the end of the round.

We know how important finishing inside the top four is to a successful September campaign. After the Western Bulldogs won from outside of it, there were cries from the punditry that the top four didn’t matter anymore; the pre-finals bye had eliminated the advantage of finishing with one of the four best records in the competition.
It didn’t last long: last year’s preliminary finalists came exclusively from the top four, and history shows at least three of the preliminary finalists come from the very top of the ladder every season.
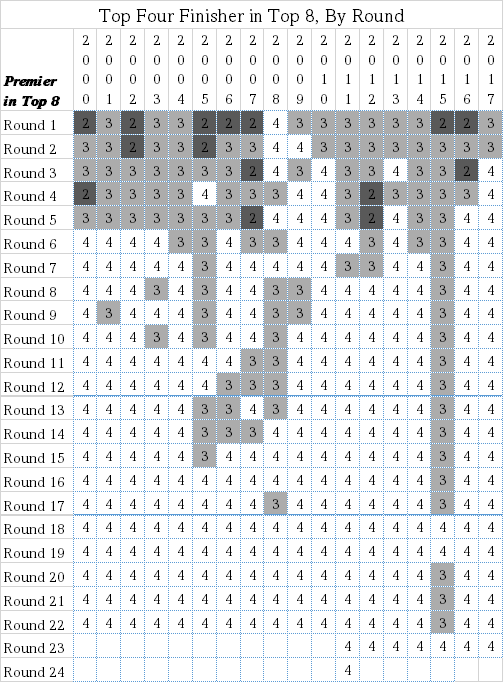
The settling process for the top four is very similar to the top eight. But what about if we broaden out the assessment, to ask: at what point are the four teams that end up in the top four locked into the top eight?

History says by the end of Round 6, 3.6 of the eventual top four finishers are inside the top eight. There it is again: Round 6 looks to be a reasonably important marker of the league’s hierarchy.
So what?
The point is: there is some important signal in all the noise of early-season football. But most of the important signal comes over the first quarter to third of the season.
By Round 6, we should have a reasonable idea of which teams are most likely to be contending for the premiership, and which teams should think about planning for next season.
As always, this is a general rule, not a specific code of practice. Sydney was 0-6 after six rounds last year, a mark that spelled season’s end for every team that came before them.
Richmond surged from 4-10 after 15 rounds to a spot in the final eight come September time in 2014. And this year, Geelong and Melbourne find themselves out of the eight after one round of play, yet both have designs on finals and more in 2018.
So, so what? Let’s react to Round 1 results. But let’s not overreact to Round 1 results. There’s plenty of football ahead.


