


- Video
-
Club Roar
Captured a great grassroots sporting moment? We want to see it!Content Collections
The Roar Community
- Join
- Login

It is hard enough doing stats previews for State of Origin games without a fullback being ruled out and the replacement being a mystery. When a winger then reportedly dislocates his finger, things get even harder.
Queensland Coach Kevin Walters has now come out to clear up the mystery. Michael Morgan will go into the number 1 jersey, with Bronco Anthony Milford going into the bench utility role.
More State of Origin 1
» Six talking points from New South Wales’ Game 1 victory
» NSW WIN! Baby Blues too good for Queensland at the MCG
» As it happened: Re-live Origin 1 with our live scores and blog
» WATCH: Josh Addo-Carr scores an unbelievably good try to seal the result
» WATCH: Tom Trbojevic’s superb high-flying try
While Milford has only played one Origin game, he isn’t a virgin. This means that the Maroons will still only have three debutants to the Blues eleven.
If Dane Gagai is ruled out with his finger injury, then the good money is on Kalyn Ponga going onto the wing.
So how do the sides match up?
Let’s look at every damn factor because too many stats is never enough!
These stats will be vital to who wins and the Blues are clearly on top here.
| NSW | Runs | Metres | QLD | Runs | Metres |
| James Tedesco | 15.5 | 170 | Michael Morgan | 7.1 | 56 |
| Tom Trbojevic | 14.1 | 140 | Valentine Holmes | 10.9 | 118 |
| James Roberts | 8.6 | 78 | Greg Inglis | 11.7 | 105 |
| Latrell Mitchell | 6.8 | 74 | Will Chambers | 11.2 | 94 |
| Josh Addo-Carr | 10.6 | 116 | Dane Gagai | 13.3 | 113 |
| James Maloney | 5.3 | 54 | Cameron Munster | 9.8 | 86 |
| Nathan Cleary | 7.8 | 59 | Ben Hunt | 4.1 | 35 |
| Reagan Campbell-Gillard | 10.1 | 91 | Dylan Napa | 9.3 | 80 |
| Damien Cook | 7.5 | 94 | Andrew McCullough | 4.5 | 41 |
| David Klemmer | 17.8 | 169 | Jarrod Wallace | 12.8 | 108 |
| Tyson Frizell | 10.2 | 96 | Gavin Cooper | 9.1 | 67 |
| Boyd Cordner | 12.4 | 108 | Felise Kaufusi | 7.7 | 66 |
| Jake Trbojevic | 13.4 | 117 | Josh McGuire | 13.3 | 122 |
| Jack de Belin | 10.8 | 93 | Anthony Milford | 6.8 | 62 |
| Paul Vaughan | 13.4 | 126 | Josh Papalii | 13.3 | 119 |
| Tyrone Peachey | 10.8 | 101 | Coen Hess | 11.8 | 92 |
| Angus Crichton | 15.3 | 119 | Jai Arrow | 15.5 | 141 |
| Total | 190.4 | 1805.0 | 172.2 | 1505 | |
| Forwards | 111 | 112.6/1013 | Forwards | 10.8/97.3 | 93/836 |
| Backs | 79.5 | 99/792 | Backs | 9.3/75 | 83.6/669 |
An average of 18 extra runs a game and 300 extra metres is match-winning. Jai Arrow is Queensland’s biggest metre eater and he’s on the bench. The Blues have nine players who average over 100 metres a game, the Maroons just seven.
It’s hard to see how David Klemmer was a late call-up given his prodigious work rate. He might not have an offload but he packs a punch and just keeps coming.
I’m surprised that Dylan Napa got a run; averages of 80 metres and under ten runs a game ain’t exactly Origin standard. The Maroons are bargaining that his mongrel will make up for his failings. It’s a big gamble.
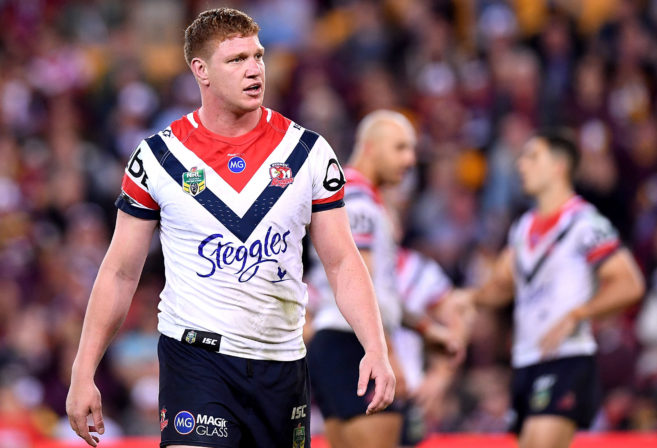
(Photo by Bradley Kanaris/Getty Images)
Not much difference here. The weight of both sides is almost identical. Further, NSW have just a pinch more minutes in their legs. The only real difference here is that the NSW backs are on average three years younger than the Queenslanders.
| NSW | Age | Minutes | Weight | QLD | Age | Minutes | Weight |
| James Tedesco | 25 | 80 | 96 | Michael Morgan | 26 | 80 | 92 |
| Tom Trbojevic | 21 | 80 | 102 | Valentine Holmes | 22 | 80 | 85 |
| James Roberts | 25 | 79.1 | 93 | Greg Inglis | 31 | 76.6 | 105 |
| Latrell Mitchell | 20 | 78.6 | 104 | Will Chambers | 30 | 80 | 100 |
| Josh Addo-Carr | 22 | 79.7 | 86 | Dane Gagai | 27 | 80 | 91 |
| James Maloney | 31 | 80 | 83 | Cameron Munster | 23 | 80 | 89 |
| Nathan Cleary | 20 | 72 | 92 | Ben Hunt | 28 | 77.2 | 87 |
| Reagan Campbell-Gillard | 24 | 53.7 | 115 | Dylan Napa | 25 | 49.8 | 109 |
| Damien Cook | 26 | 79.3 | 86 | Andrew McCullough | 28 | 75 | 90 |
| David Klemmer | 24 | 54.8 | 116 | Jarrod Wallace | 26 | 46.7 | 108 |
| Tyson Frizell | 26 | 74.4 | 108 | Gavin Cooper | 32 | 80 | 108 |
| Boyd Cordner | 26 | 76.1 | 102 | Felise Kaufusi | 26 | 78.3 | 112 |
| Jake Trbojevic | 24 | 76.8 | 107 | Josh McGuire | 28 | 63.6 | 106 |
| Jack de Belin | 27 | 56.8 | 107 | Anthony Milford | 23 | 80 | 90 |
| Paul Vaughan | 27 | 51.1 | 110 | Josh Papalii | 26 | 66.5 | 110 |
| Tyrone Peachey | 26 | 71.5 | 93 | Coen Hess | 21 | 75.4 | 110 |
| Angus Crichton | 22 | 79.8 | 102 | Jai Arrow | 22 | 56 | 101 |
| Total | 416 | 1223.7 | 1702 | 444 | 1225.1 | 1693 | |
| Forwards | 25.1/226 | 67/603 | 106/953 | Forwards | 26/234 | 65.7/591.3 | 106/954 |
| Backs | 23.75/190 | 77.6/621 | 93.6/749 | Backs | 26.2/210 | 79/634 | 92.25/739 |
Nathan Cleary is the youngest man in this match at the tender age of 20, Tom Trbojevic and Coen Hess will be the next youngest players on the field at 21. James Maloney at 31 and Gavin Cooper at 32 will be the oldest. Jimmy is four years the senior of the next oldest Blue, while Greg Inglis at 31 and Will Chambers at 30 make three Maroons in their 30s.
David Klemmer at 116kg will be the biggest unit on the field. Maloney at 83kg will be the lightest.
Queensland have a bigger tackling capacity but NSW miss fewer tackles.
| NSW | Tackles | Missed Tackles | QLD | Tackles | Missed Tackles |
| James Tedesco | 5.8 | 0.6 | Michael Morgan | 11.8 | 2.8 |
| Tom Trbojevic | 4.7 | 1.3 | Valentine Holmes | 2.6 | 1.6 |
| James Roberts | 12 | 1.2 | Greg Inglis | 7.5 | 1 |
| Latrell Mitchell | 8.8 | 1.4 | Will Chambers | 12.7 | 3 |
| Josh Addo-Carr | 4 | 0.7 | Dane Gagai | 14.9 | 3 |
| James Maloney | 11 | 5.8 | Cameron Munster | 16.8 | 2.3 |
| Nathan Cleary | 13.2 | 0.6 | Ben Hunt | 15.8 | 3.8 |
| Reagan Campbell-Gillard | 24.8 | 2.4 | Dylan Napa | 22.8 | 2.2 |
| Damien Cook | 38.8 | 2.2 | Andrew McCullough | 40.4 | 0.7 |
| David Klemmer | 20.6 | 1.3 | Jarrod Wallace | 23.2 | 1 |
| Tyson Frizell | 24.5 | 1.3 | Gavin Cooper | 26.3 | 2.2 |
| Boyd Cordner | 26.5 | 1.6 | Felise Kaufusi | 29 | 1.3 |
| Jake Trbojevic | 37.7 | 1.5 | Josh McGuire | 27.3 | 1.9 |
| Jack de Belin | 26.5 | 1 | Anthony Milford | 11.3 | 1.9 |
| Paul Vaughan | 22.8 | 1 | Josh Papalii | 23.2 | 1.3 |
| Tyrone Peachey | 12.8 | 2.1 | Coen Hess | 31.3 | 1.7 |
| Angus Crichton | 32 | 2.2 | Jai Arrow | 27.6 | 1.6 |
| Total | 326.5 | 28.2 | Total | 337.2 | 33.3 |
| Forwards | 28.2/254.2 | 14.5 | Forwards | 27.9/251 | 13.9 |
| Backs | 9/72.3 | 13.7 | Backs | 11.6/93.4 | 19.4 |
Queensland have five more missed tackles in them than New South Wales and they are in the backs. Freddie Fittler will be hoping Latrell Mitchell and James Roberts will expose those frailties. However, Queensland have a slightly higher tackling capacity, making 11 more tackles overall.
Look at Jimmy Maloney’s 5.8 missed tackles! I’m not sure I’ve ever seen a regular first grader with an average like that. His minders will have their work cut out for them, as will Ben Hunt’s. While not as bad as Maloney, he still misses 3.8 a game.
You can bet the Blues will target the six missed tackles of Dane Gagai and Will Chambers.
On the flipside, two great tacklers need to be pointed out. Andrew McCullough misses less than one tackle a match while averaging 40. That’s stellar. Nathan Cleary only missing 0.6 tackles a game as a 20-year-old in the halves is remarkable.
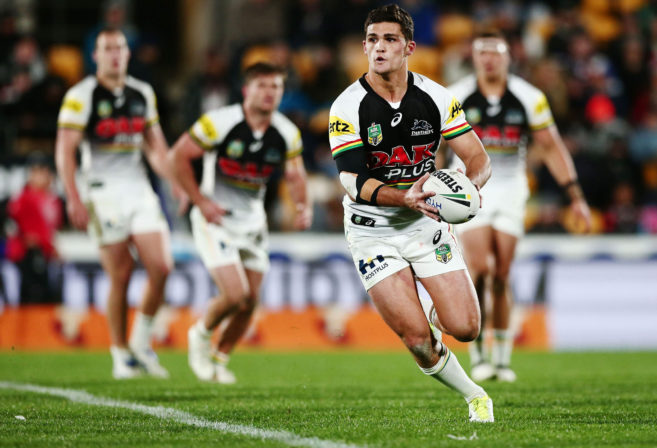
(Photo by Anthony Au-Yeung/Getty Images)
Did I mention how much I rate Jake Trbojevic? He’s pretty good. He’ll give old man Gavin Cooper some problems. In fact, I suspect that the ageing Cowboy has a target on him.
The attacking stats make great reading if you’re a Blues fan and grim reading if you are a Maroon-clad Queenslander.
| NSW | Tackle breaks | Line breaks | Try Assists | Tries | QLD | Tackle breaks | Line breaks | Try Assists | Tries |
| James Tedesco | 4.8 | 0.9 | 0.6 | 4 | Michael Morgan | 1.3 | 0.3 | 0.8 | 1 |
| Tom Trbojevic | 4.5 | 0.9 | 1 | 2 | Valentine Holmes | 2.1 | 0.7 | 0.1 | 11 |
| James Roberts | 3.4 | 0.5 | 0.5 | 6 | Greg Inglis | 1.8 | 0.4 | 0.3 | 7 |
| Latrell Mitchell | 4 | 0.7 | 0.2 | 6 | Will Chambers | 1.6 | 0.3 | 0.1 | 2 |
| Josh Addo-Carr | 4 | 1 | 0.2 | 12 | Dane Gagai | 3.1 | 0.2 | 0.3 | 1 |
| James Maloney | 1.6 | 0.2 | 0.8 | 2 | Cameron Munster | 2.7 | 0.3 | 0.8 | 1 |
| Nathan Cleary | 2.6 | 0.4 | 0.8 | 1 | Ben Hunt | 2.8 | 0.3 | 0.8 | 3 |
| Reagan Campbell-Gillard | 0.6 | 0.2 | 0.1 | 2 | Dylan Napa | 0.5 | 0.1 | 0 | 0 |
| Damien Cook | 3.4 | 0.8 | 0.3 | 3 | Andrew McCullough | 0.7 | 0.2 | 0.3 | 2 |
| David Klemmer | 1.3 | 0 | 0.1 | 0 | Jarrod Wallace | 0.8 | 0.1 | 0 | 2 |
| Tyson Frizell | 1.3 | 0.1 | 0 | 4 | Gavin Cooper | 0.4 | 0.4 | 0 | 4 |
| Boyd Cordner | 1.1 | 0.1 | 0.1 | 1 | Felise Kaufusi | 0.4 | 0.3 | 0.1 | 2 |
| Jake Trbojevic | 0.9 | 0.3 | 0.1 | 4 | Josh McGuire | 1.6 | 0 | 0 | 0 |
| Jack de Belin | 2.1 | 0.3 | 0 | 3 | Anthony Milford | 2.8 | 0.4 | 0.3 | 3 |
| Paul Vaughan | 1.4 | 0.1 | 0 | 2 | Josh Papalii | 2.1 | 0.3 | 0.2 | 2 |
| Tyrone Peachey | 3.4 | 0.3 | 0.3 | 4 | Coen Hess | 2.8 | 0.5 | 0 | 4 |
| Angus Crichton | 2.3 | 0.3 | 0.1 | 2 | Jai Arrow | 1.9 | 0.3 | 0 | 2 |
| Total | 42.7 | 7.1 | 5.2 | 58 | Total | 29.4 | 5.1 | 4.1 | 48 |
| Forwards | 1.6/14.4 | 2.2 | 0.8 | 21 | Forwards | 11.2 | 2.2 | 0.6 | 18 |
| Backs | 3.5/28.3 | 4.9 | 4.4 | 37 | Backs | 18.2 | 2.9 | 3.5 | 29 |
The Blues have 13 more tackle breaks in them than the Maroons. That’s a massive difference.
New South Wales have only one player – Jake Trbojevic (with 0.9) – who averages less than a tackle break a game. Queensland have five – Felise Kaufusi, Gavin Cooper, Jarrod Wallace, Andrew McCullough and Dylan Napa. Advantage NSW.
The Blues have an extra two line breaks in them a match. So much of this advantage comes from their back five who really look to have been selected due to their attacking credentials. Queensland will do well to hold them.
This all combines to see the Blues as a far more deadly attacking side as far as the statistics are concerned.
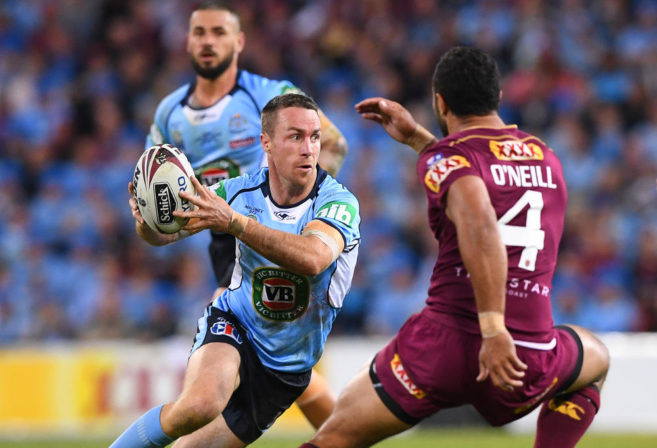
(AAP Image/Dave Hunt)
Queensland clearly have the edge here.
| NSW | Penalties | Errors | QLD | Penalties | Errors |
| James Tedesco | 0.2 | 1.8 | Michael Morgan | 0.3 | 1.3 |
| Tom Trbojevic | 0 | 1.5 | Valentine Holmes | 0.1 | 0.9 |
| James Roberts | 0.5 | 0.4 | Greg Inglis | 0.5 | 0.6 |
| Latrell Mitchell | 1.1 | 1.2 | Will Chambers | 0.6 | 1.4 |
| Josh Addo-Carr | 0.3 | 1.1 | Dane Gagai | 0.3 | 1.2 |
| James Maloney | 0.7 | 1.7 | Cameron Munster | 1.1 | 0.8 |
| Nathan Cleary | 0.6 | 1.2 | Ben Hunt | 0.7 | 0.7 |
| Reagan Campbell-Gillard | 0.8 | 0.3 | Dylan Napa | 0.9 | 0.2 |
| Damien Cook | 0.8 | 1 | Andrew McCullough | 0.7 | 0.4 |
| David Klemmer | 0.5 | 0.3 | Jarrod Wallace | 1.1 | 0.4 |
| Tyson Frizell | 0.8 | 0.5 | Gavin Cooper | 0.3 | 0.8 |
| Boyd Cordner | 0.3 | 0.5 | Felise Kaufusi | 0.2 | 0.6 |
| Jake Trbojevic | 1.4 | 0.4 | Josh McGuire | 0.9 | 0.1 |
| Jack de Belin | 0.8 | 0.5 | Anthony Milford | 0.5 | 0.9 |
| Paul Vaughan | 0.5 | 0.3 | Josh Papalii | 0.6 | 0.5 |
| Tyrone Peachey | 0.9 | 0.6 | Coen Hess | 1 | 0.5 |
| Angus Crichton | 0.9 | 1.4 | Jai Arrow | 0.5 | 0.2 |
| Total | 11.1 | 14.7 | Total | 9.9 | 11.5 |
| Forwards | 6.8 | 5.2 | Forwards | 6.2 | 3.7 |
| Backs | 4.3 | 9.5 | Backs | 4.1 | 7.8 |
This is the Maroons’ advantage. They give away fewer penalties and they make fewer errors. You can bet the Queenslanders will try and target debutant Latrell Mitchell and his propensity for making an error and conceding a penalty.
James Tedesco and Tom Trbojevic will also have a lot of play aimed at them and their errors. Note David Klemmer’s very low error and penalty rate for a bloke who runs the ball and tackles as much as he does.
The Will Chambers-Dane Gagai side of the field has more errors than anywhere else in the Maroons line, so a fair bit of traffic will be coming their way.
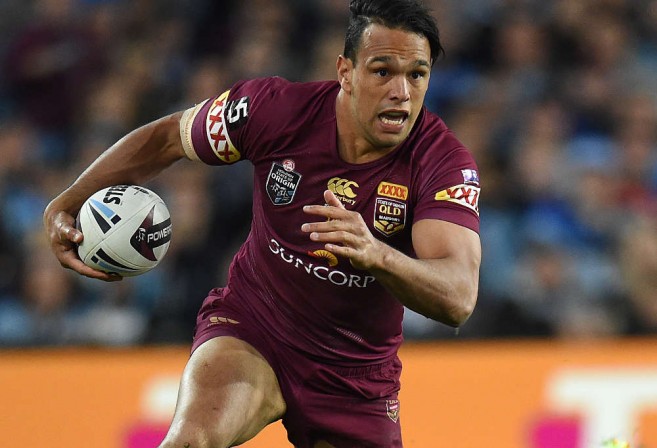
(AAP Image/Dean Lewins)
When you select 11 debutants it is no surprise that the other team is better in this regard.
| NSW | Origin Games | QLD | Origin Games |
| James Tedesco | 4 | Michael Morgan | 8 |
| Tom Trbojevic | 0 | Valentine Holmes | 2 |
| James Roberts | 0 | Greg Inglis | 30 |
| Latrell Mitchell | 0 | Will Chambers | 7 |
| Josh Addo-Carr | 0 | Dane Gagai | 7 |
| James Maloney | 10 | Cameron Munster | 1 |
| Nathan Cleary | 0 | Ben Hunt | 1 |
| Reagan Campbell-Gillard | 0 | Dylan Napa | 3 |
| Damien Cook | 0 | Andrew McCullough | 0 |
| David Klemmer | 9 | Jarrod Wallace | 2 |
| Tyson Frizell | 5 | Gavin Cooper | 4 |
| Boyd Cordner | 9 | Felise Kaufusi | 0 |
| Jake Trbojevic | 3 | Josh McGuire | 8 |
| Jack de Belin | 0 | Anthony Milford | 1 |
| Paul Vaughan | 0 | Josh Papalii | 9 |
| Tyrone Peachey | 0 | Coen Hess | 2 |
| Angus Crichton | 0 | Jai Arrow | 0 |
| Total | 40 | Total | 80 |
| Forwards | 26 | Forwards | 23 |
| Backs | 14 | Backs | 57 |
Please note that 25 per cent of the Origin experience belongs to one player: Bowraville’s own Greg Inglis. Thirty of the 120 games of experience are claimed by GI.
But then when you look at NSW you’ll find that 70 per cent of their experience belongs to just three players: Maloney, Boyd Cordner and David Klemmer. They are the only Blues who have played in more than two series. There are six Queenslanders who have played in three series or more.
How the worm turns. Last season Boyd Cordner was the inexperienced captain up against the leadership might of Cameron Smith, Cooper Cronk and Johnathan Thurston. This year he and Jimmy Maloney will be much happier facing Greg Inglis and Michael Morgan.
The most experienced Queensland forward is now Josh Papalii who has been a bench player for most of his nine Origin games. Still on the bench, he will need to step right into a leadership role if the Maroons are to prevail.
(Photo by Mark Kolbe/Getty Images)
New South Wales have too much attacking prowess for Queensland and the stats clearly show it. They make more runs, metres, tackle breaks and line breaks, and they score more tries. They should win.
However, they could choke. There are so many debutants and the side has quite a few penalties and errors in them. If they get spooked, if things start going wrong, then the more experienced Queenslanders could grind them down.
But I don’t think that the Blues will choke. Instead, they’ll outclass the Maroons and expose a few of the Queensland selections as being not up for it.
New South Wales by 20
Some other stats of interest
(Note: 1997 stats not included due to split competition)
• This will be the eighth State of Origin match held in Melbourne. Queensland have won four to New South Wales’ three
• It will be the fourth match at the MCG. The Blues have won two of the previous three.
• It will be the third Game 1 in Melbourne, Queensland have won both to date.
– 1990 Game 2 NSW 12-6 Olympic Park,
– 1994 Game 2 NSW 14-0 MCG,
– 1995 Game 2 Queensland 20-12 MCG,
– 2006 Game 3 Queensland 16-14 Docklands,
– 2009 Game 1 Queensland 28-18 Docklands,
– 2012 Game 1 Queensland 18-10 Docklands,
– 2015 Game 2 NSW 26-18 MCG.
• Of the nine times that New South Wales have won Game 1 away from home, they have won six of those series (1985, 1986, 1993, 1996, 2003, 2014). However, in 1983, 1987 and 2017, they lost the next two games to lose the series.
• The last Game 3 held in Brisbane was in 2015. Queensland beat New South Wales 52-6, the record defeat for the Blues.
• Last season was only the fifth time either side has used the same 17 players for the entire series (Queensland 1987, Queensland 1988, Queensland 1995, NSW 1996, NSW 2017). In every instance, the side has won the series – except 2017.
• The 11 debutants in the NSW side is the most in an Origin team (excepting 1995 when the ARL excluded Super League players) since the NSW Game 3 side in 1994.
• The 14 total debutants is the most in an Origin game since the inaugural match in 1980 (except for 1995 when the ARL excluded Super League players).