


- Video
-
Club Roar
Captured a great grassroots sporting moment? We want to see it!Content Collections
The Roar Community
- Join
- Login
Half way through the season, and we’re not all that closer to crowning either finalists or an eventual premier. Here’s what the numbers say is on the cards for the second half of 2018.
For the uninitiated, this is my annual half year health check for the AFL season as it is unfolding. It’s all numbers, and no takes: all we’re interested in here is understanding which teams have outperformed, who has underperformed, and why this might be.
By the time we get to the end there is enough evidence to make some predictions, of a fairly bland variety. This team underperformed so they’ll be better, or that one outperformed so they’ll be worse. The numbers game shows no fear nor favour.
The primer on the numbers and what they mean is here. Let’s get it.
For this edition of numbers game, we’ve added a pinch of oregano to the secret herbs and spices. Where Pythagorean wins were previously taking a team’s points for and against and converting that to wins, we’re now adjusting for strength of schedule.
This is because the relative strength of a team’s fixture can influence its ability to generate wins. The smaller the season sample, the more influence a fixture can have. Folks have been talking about Melbourne’s relatively soft draw in recent weeks, and it’s true: the Dees schedule was 95 points weaker than a hypothetical average schedule over the past six weeks.
Despite that, the Dees earned six schedule adjusted Pythagorean wins over that period, a sign of how strong the team has been. Yes it was a meek slate, but the margins Melbourne put up weren’t empty points – they were a sign of underlying strength.
That stretch has seen Melbourne rise to second on the strength of schedule adjusted Pythagorean win table, on 8.4 wins (from 11 games). Richmond sits in first with 8.8 wins, a pretty incredible rate that would see them win between 17 and 18 games if their underlying performance matched their wins for the second half of the season.
West Coast, on top of the ladder, is third, a relatively weak fixture eating away at what the formula says should be an 8-3 record (as opposed to 10-1).
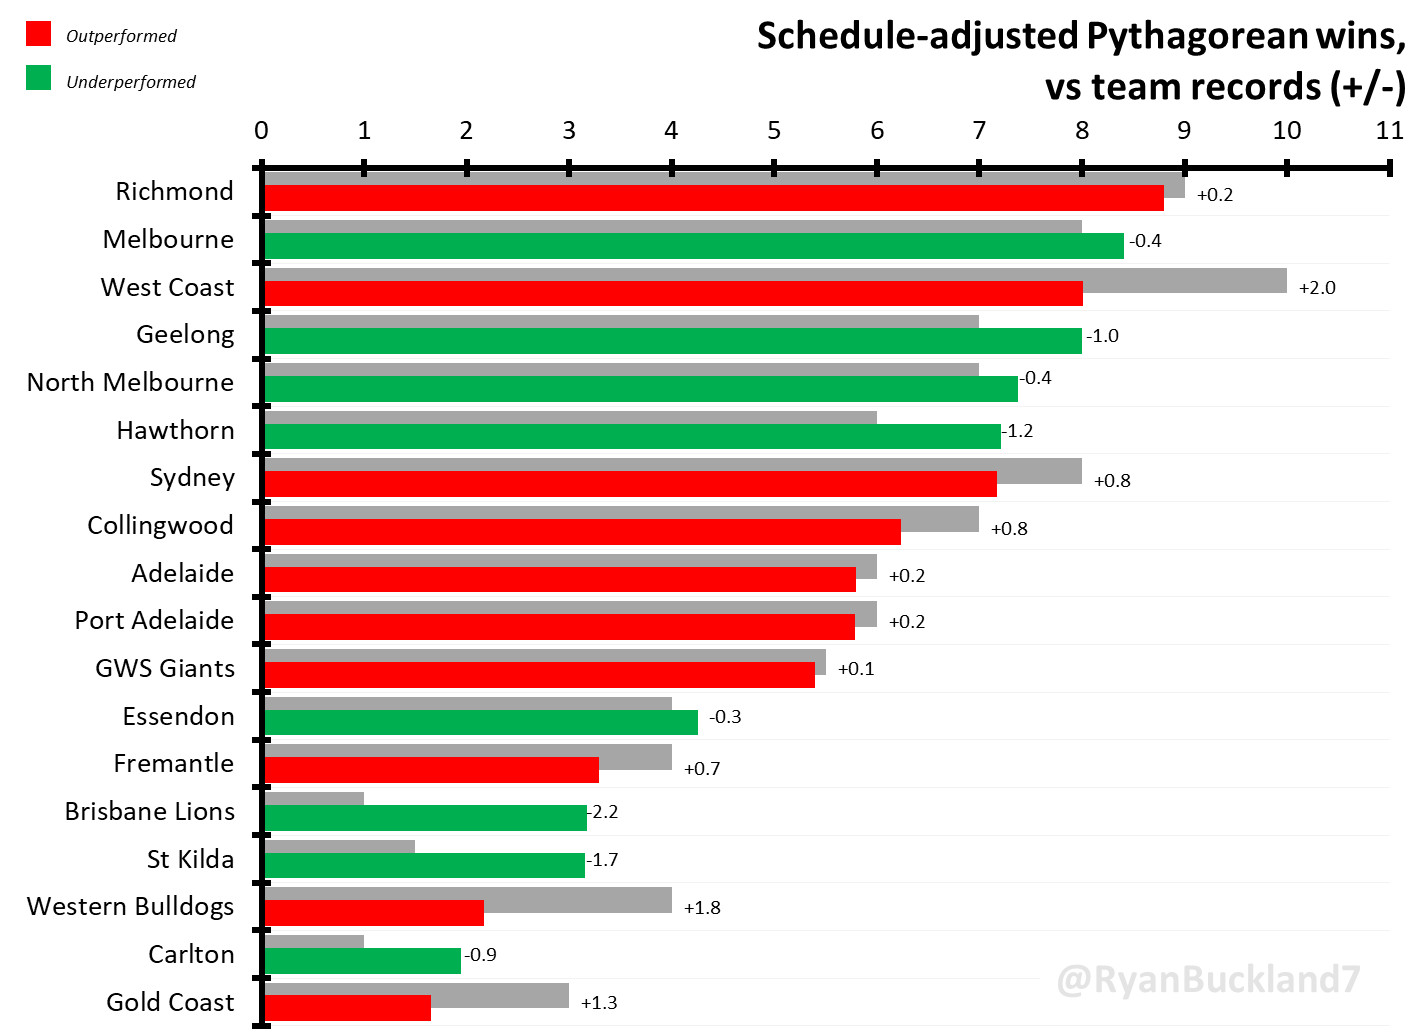
The Eagles have the largest gap between their actual and expected win total, suggesting they won’t be going 10-1 in their final 11 games. That was probably going to happen anyway – there have only been five instances of a team winning 20 games or more in a 22 game season, or in less than one per cent of all team seasons.
This week’s media whipping boy, the Western Bulldogs, come in second on Pythagorean differential, outperforming their underlying strength by 1.8 wins. The formula suggests the Dogs are only a 2-9 team, not a 4-7 team as their record indicates. This would suggest they’ll dip down the ladder in the second half.
It is a similar story for Gold Coast, who’ve outperformed by 1.3 wins. Indeed, the Pythagorean wins formula suggest they are the worst team in the competition, not Carlton. However, we can’t read too much into the Suns’ face value figures, given they’ve played a solitary game at their home ground in 2018.
At the other end of the spectrum, Brisbane has underperformed its Pythagorean win total by 2.2 wins, an extraordinary number for half a season. The Lions should’ve won at least three games, not the solitary victory they’ve managed to date. There’s a substantial reason for this which we’ll get to in a moment.
St Kilda has been similarly hard done by, underperforming their win total by 1.7 wins through 11 games. The club has been operating at a 3-8 level, still one of the four worst in the competition, and most certainly worse than Saints fans were hoping (and expecting) at the start of the season.
Two more teams have underperformed by one or more win: Hawthorn (1.2 wins) and Geelong (one win). The Cats have the fourth best record in the league, operating at an 8-3 level as oppose to their actual record of 7-4. By contrast, Hawks have played at a 7-4 level, and have the sixth best schedule-adjusted Pythagorean win total through 11 games.
The key reason for Hawthorn’s underperformance has been its fixture: by comparing a team’s raw Pythagorean performance to its schedule adjusted Pythagorean performance, we can get a glimpse into the role of a team’s slate of opponents in their year to date. The formula reckons Hawthorn’s schedule penalty has been worth 1.2 wins, which more or less explains their underperformance. The other team to be severely impacted by its fixture is St Kilda (1.1 wins). Meanwhile, Collingwood’s prospects have been boosted by around a win (0.9 wins) on account of its fixture.
| Raw Pythag | Schedule Pythag | Schedule Bonus/Penalty | |
| Adelaide | 6.3 | 5.8 | 0.5 |
| Brisbane Lions | 2.8 | 3.2 | -0.3 |
| Carlton | 1.3 | 1.9 | -0.6 |
| Collingwood | 7.2 | 6.2 | 0.9 |
| Essendon | 3.9 | 4.3 | -0.4 |
| Fremantle | 3.2 | 3.3 | -0.1 |
| Geelong | 8.2 | 8.0 | 0.2 |
| Gold Coast | 1.6 | 1.7 | -0.1 |
| GWS Giants | 5.5 | 5.4 | 0.1 |
| Hawthorn | 6.0 | 7.2 | -1.2 |
| Melbourne | 9.0 | 8.4 | 0.6 |
| North Melbourne | 7.9 | 7.4 | 0.6 |
| Port Adelaide | 5.7 | 5.8 | -0.1 |
| Richmond | 9.0 | 8.8 | 0.2 |
| St Kilda | 2.1 | 3.2 | -1.1 |
| Sydney | 7.4 | 7.2 | 0.2 |
| West Coast | 8.6 | 8.0 | 0.6 |
| Western Bulldogs | 2.4 | 2.2 | 0.2 |
That’s not the only quantitative explanation for a team’s record to differ from its underlying strength or weakness.
From the table above it’s pretty clear the fixture can play a significant role in a team’s performance. The other macro factor that chips at the reason for under- or outperformance is how a team has gone in close games. Over the long run a team will win more or less half of their games decided by 12 points or less.
That is unless the team is Geelong. The Cats have shown a frankly spooky ability to win games with skinny margins over the past decade. That sheen has faded a little in recent times: the Cats are 1-1 this year, squeaking over the line in Round One on account of Max Gawn’s missed set shot and falling against the Hawks on Easter Monday.
That was after the club went 5-1 during last year’s home and away season, 2-1 the year prior, and 3-1-0 in 2015. Their 77 per cent close game winning percentage (which includes three draws, which are assigned 0.5 wins) is streets ahead of Hawthorn (62 per cent), the Western Bulldogs (61 per cent) and Fremantle (60 per cent) – and most everyone else hovers around 50 per cent. Spooky.
Geelong’s two close games in 2018 show why close games regress to randomness in the long run. At a league wide level Gawn’s shot probably gets kicked 80 per cent of the time. Meanwhile, the closing stages of the Easter Monday game were frantic, after the Cats came back from a four goal deficit in the last ten minutes of the game.
Two hours of football involves millions of actions and reactions, so these closing moments aren’t necessarily the factors that decide who wins or loses. But they take on added meaning, because they represent a team’s last opportunity to take back or defend a lead lost or earned over the preceding minutes and hours of the game.
To date, the football gods have doled out the close wins in an almost perfectly random fashion. Just one team has been hard done by: the Brisbane Lions, who’ve gone 0-4 in 11 games. That has afforded them two fewer hypothetical wins, and almost wholly explains the club’s underperformance on Pythagorean wins in the year to date (-2.2 wins). It’s impossible to say whether Brisbane is “the best 1-10 team ever”, but it would certainly be one of the unluckiest.
West Coast has won both of its close games, affording an extra win than if the close games had gone to chalk. Every other club is within 0.5 of their expected 50-50 close game mark. Nothing to see here folks.
| Close Wins | Close Games | |
| Adelaide | 1.0 | 3 |
| Brisbane Lions | 0.0 | 4 |
| Carlton | 0.0 | 1 |
| Collingwood | 1.0 | 1 |
| Essendon | 1.0 | 1 |
| Fremantle | 0.0 | 1 |
| Geelong | 1.0 | 2 |
| Gold Coast | 1.0 | 2 |
| GWS Giants | 0.5 | 1 |
| Hawthorn | 2.0 | 3 |
| Melbourne | 0.0 | 1 |
| North Melbourne | 1.0 | 2 |
| Port Adelaide | 2.0 | 3 |
| Richmond | 1.0 | 1 |
| St Kilda | 0.5 | 1 |
| Sydney | 2.0 | 4 |
| West Coast | 2.0 | 2 |
| Western Bulldogs | 2.0 | 3 |
Another reason a team’s record doesn’t reflect its underlying strength is blowout wins or losses: games decided by the season’s average margin plus one standard deviation. That’s because a win is a win is a win. Melbourne received four competition points for smacking Carlton by 109 points, as did Hawthorn for eeking past Geelong by one point.
The extra 108 points put up by the Dees reflect their ability to play football. But the competition is broken up into 198 four point chunks, and isn’t decided by points for and against alone. Fundamentally that’s what Pythagorean wins are about: correcting for that fact.
So it holds that a team which is able to blowout their opponents with relative frequency is better than average, and the same in reverse. Chalk one up to the Tigers here, who are +3 on blowout differential having gone large against Brisbane, Fremantle and Essendon. Richmond hasn’t been blown out so far in 2018. Melbourne has also executed three smack downs, but have been blown out once themselves (by Hawthorn in Round 4).
Geelong has also had multiple blowout wins (two), while a range of teams have had just one. Not among them is Adelaide, which ended the 2017 with seven of the things. It is a sure fire indication of the extent to which they’ve dropped away in 2018.
At the other end of the spectrum sit Fremantle and Gold Coast, who’ve been in three blowout losses each. Carlton has been in two. A raft of teams have been blown out at least once.
| Blow Out Wins | Blow Out Losses | |
| Adelaide | 0 | 1 |
| Brisbane Lions | 0 | 1 |
| Carlton | 0 | 2 |
| Collingwood | 1 | 0 |
| Essendon | 0 | 1 |
| Fremantle | 0 | 3 |
| Geelong | 2 | 0 |
| Gold Coast | 0 | 3 |
| GWS Giants | 1 | 1 |
| Hawthorn | 1 | 0 |
| Melbourne | 3 | 1 |
| North Melbourne | 1 | 0 |
| Port Adelaide | 0 | 0 |
| Richmond | 3 | 0 |
| St Kilda | 0 | 0 |
| Sydney | 1 | 0 |
| West Coast | 1 | 0 |
| Western Bulldogs | 0 | 1 |
This is an important indicator of underlying performance, but it isn’t the be-all and end-all. Richmond ended the 2017 home-and-away season with a blowout differential of -1, having blown out just one opponent (Fremantle in Round 22) and being blown out twice themselves (against Adelaide in Round 6 and St Kilda in Round 16).
In light of the earlier discussion it’s important to consider the role that a team’s fixture can and will have in its performance. We saw, for example, St Kilda’s fixture had penalised them 1.2 hypothetical wins through 11 games. Theirs rated as the most difficult fixture in the league on my strength of schedule calculation, with a difficulty of around 9.8 points per game on average versus a hypothetical even draw.
St Kilda will get some relief in the second half, with their projected fixture difficulty dropping to 0.2 points per game. However, this still rates as the ninth-toughest fixture in the league in the second half, suggesting the Saints have been hard done by in their double ups this year (North Melbourne, GWS, Hawthorn, Melbourne and Richmond…yeah that’s tough).
Similarly, Hawthorn’s fixture opens up a little after a tough start. Their fixture rating drops from 8.7 points per game on average to a league low of -10.7 points per game. With seven games to come against the bottom seven (oh yes), plus an eighth against an Adelaide team that might run out of players, the Hawks would have to fall away materially to not jump back into the top eight.
Carlton’s fixture also opens up quite a bit in the second half, after the Blues were once again hit with a slate that was tougher than average to start the season. It’s become something of an annual tradition.
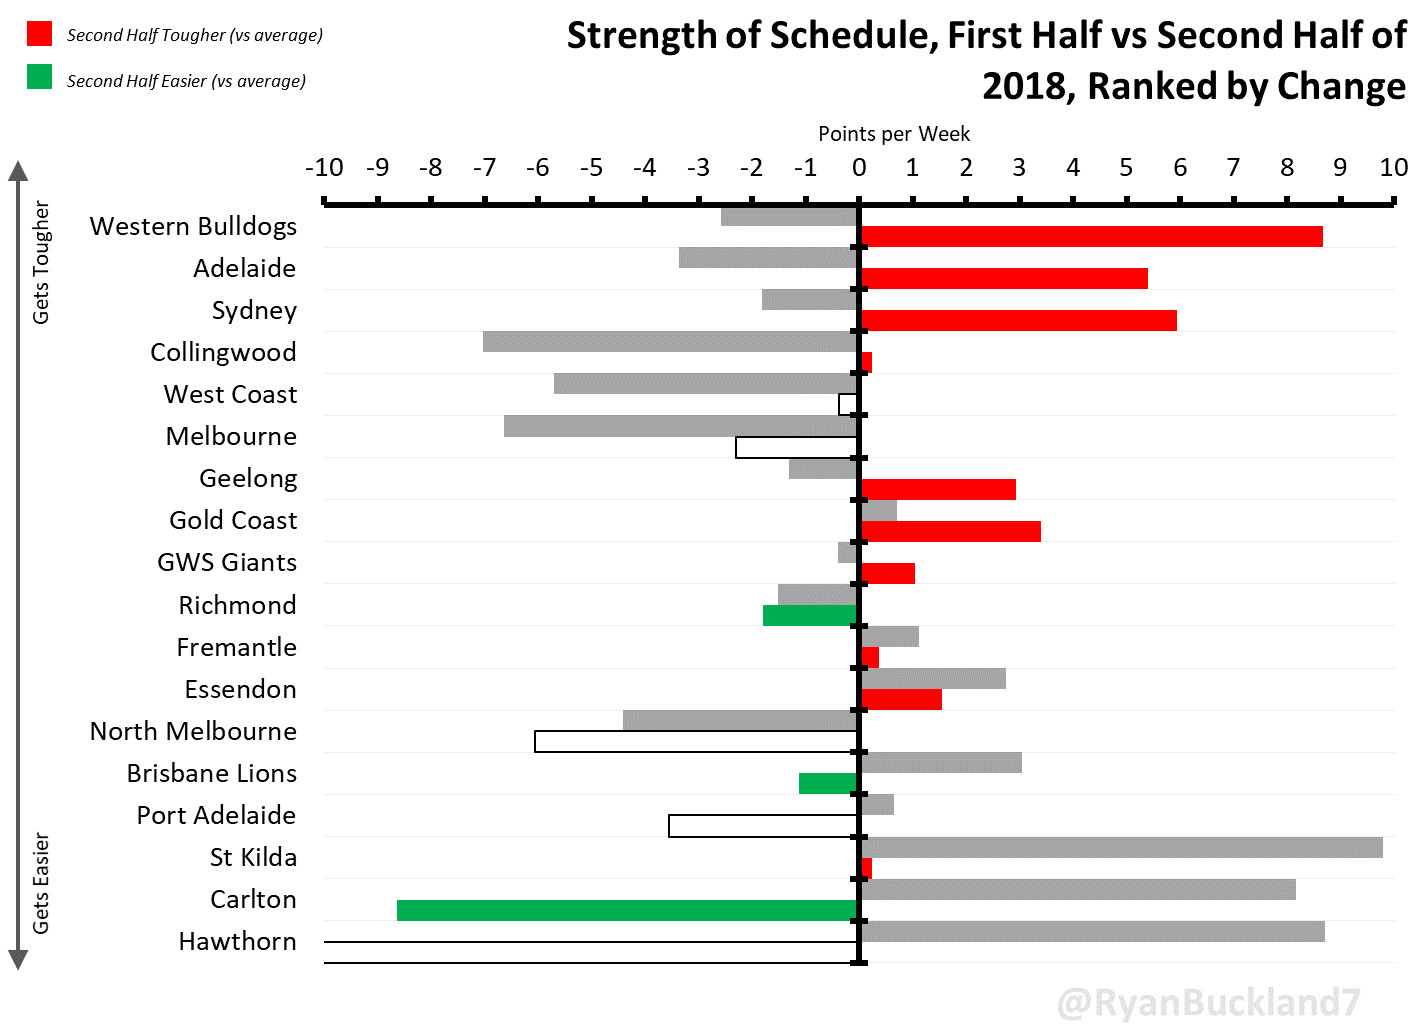
A few teams will have a much tougher time of it come the second half of the season. Chief among them is the Western Bulldogs, who rate as the number one most difficult fixture in the second half of the season (from 13th in the first half). while Sydney’s difficulty ramps up from 12th to second toughest.
Adelaide goes from the 14th toughest to third toughest, which will make the Crows’ climb back up the ladder even more challenging that it looks right now with all of its injuries. The Crows have been absolutely ravaged, and must be close to the point of knowing a push for a spot in the eight may not be the best course of action.
Indeed, major published projections systems have soured on the Crows in the past few weeks. A consensus probability of The Arc Footy, Matter of Stats and Champion Data suggests Adelaide only has a 50-50 chance of making the top eight from here, and that’s with Champion Data’s player-based rating system (which would be assuming many of Adelaide’s injured stars return) giving them a much higher chance than either of the other systems.
Finally, a brief glimpse at a handful of the high level Key Performance Indicators I use to track how the league and its teams are progressing. They are inside 50 differential, time in possession differential, and adjusted contested possession (contested possessions less free kicks and contested marks) differential. Together, the three represent ball-winning, ball control and territory.
One team has lapped the rest of the competition on these KPIs: Melbourne. They’re ranked number one in all three, by an enormous margin. In terms of second place, that belongs to Sydney on ball-winning, Richmond on territory and West Coast on time in possession. Five teams are rated in the top six on at least two of the metrics: Collingwood, Melbourne, North Melbourne (!!), Sydney and West Coast.
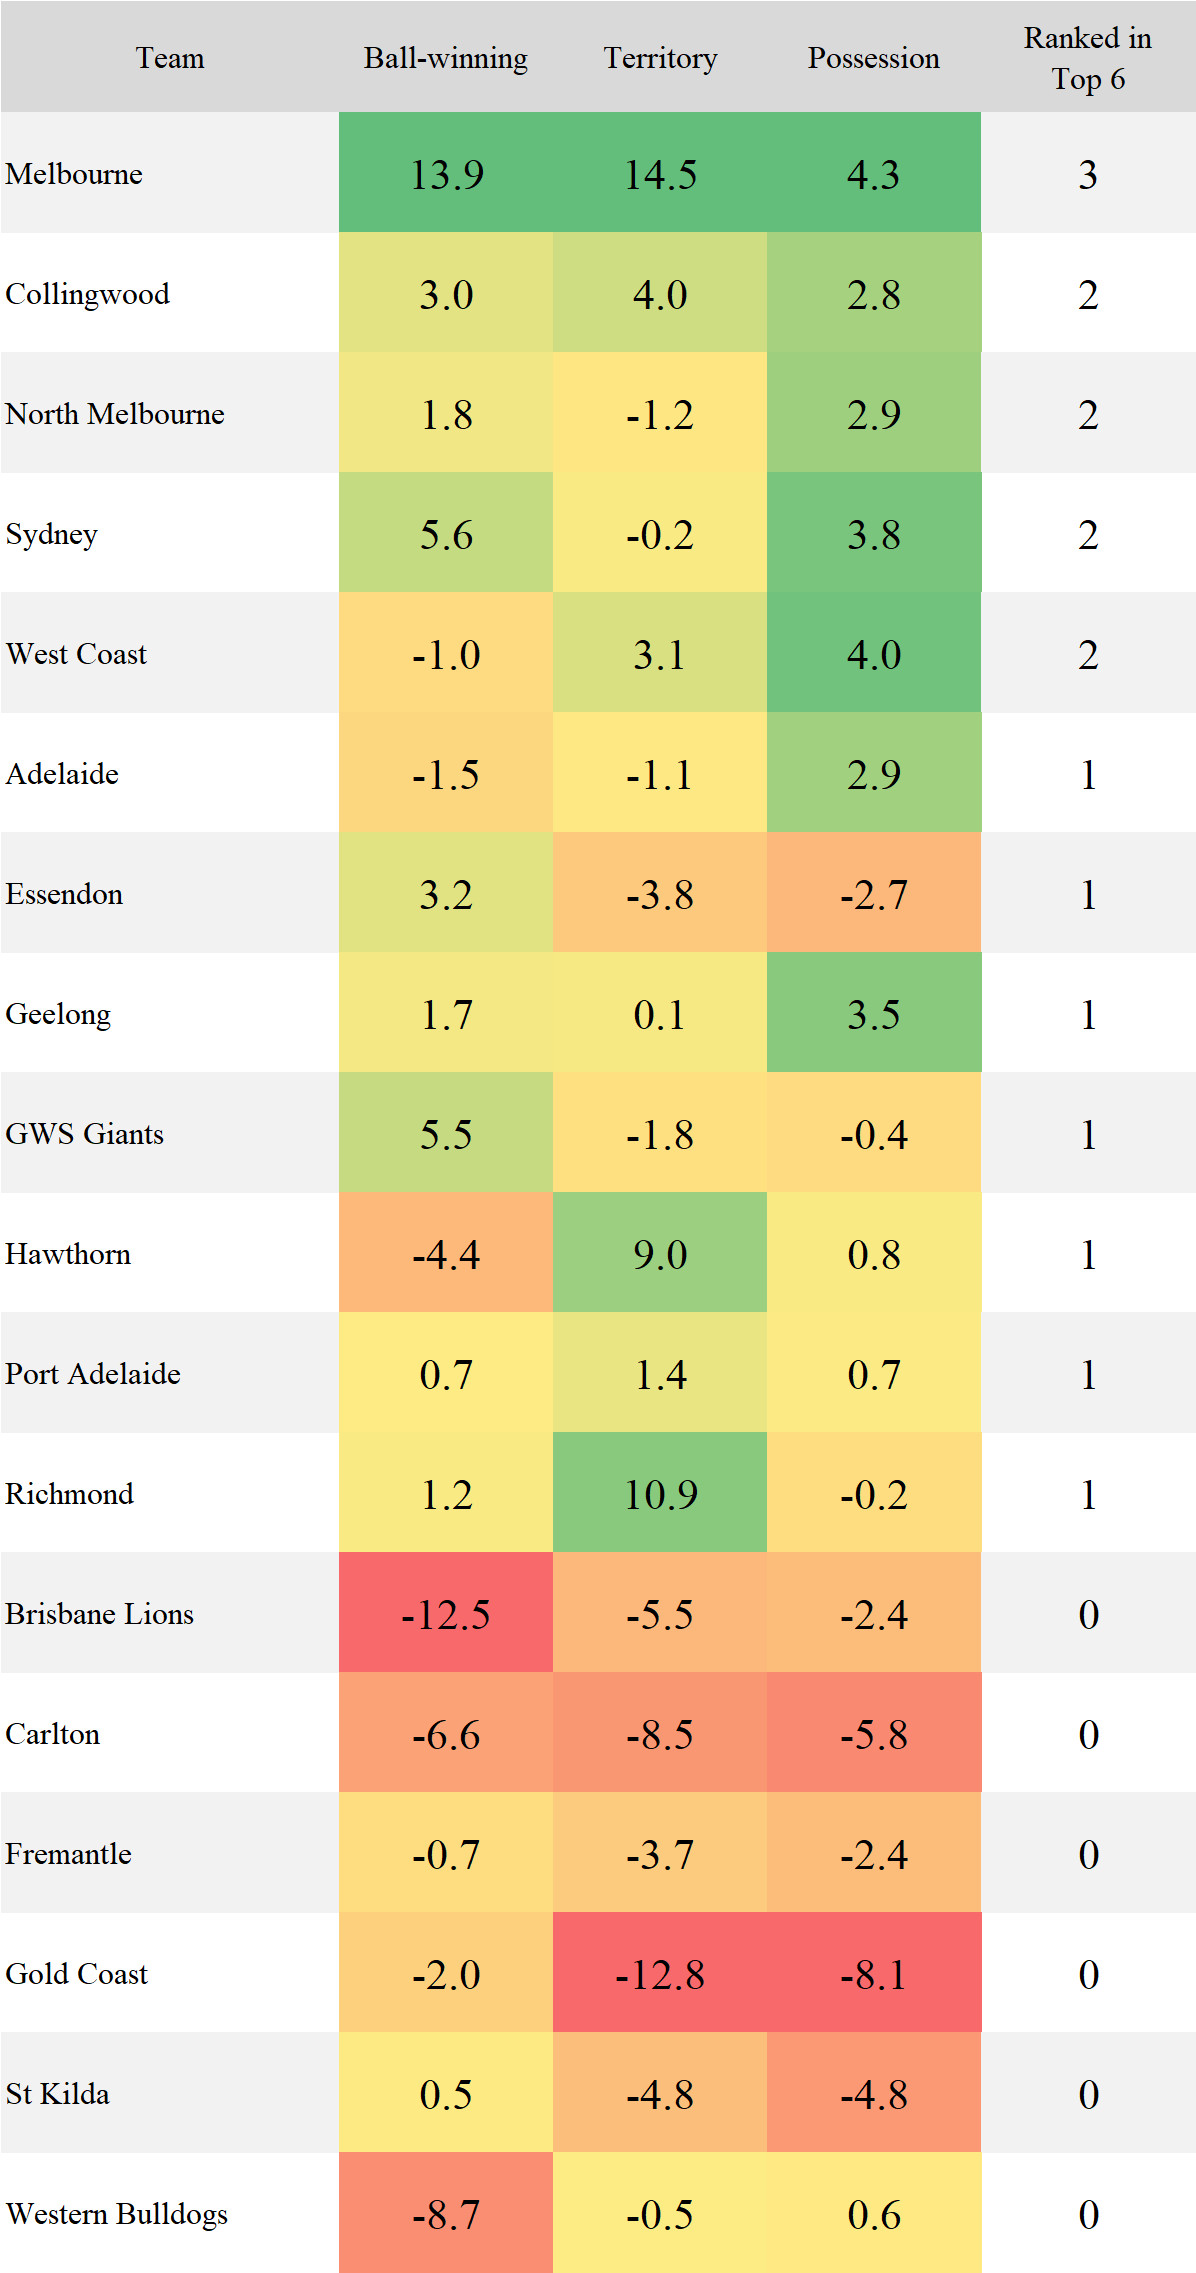
We reach that point in the numbers game where everyone is left scratching their heads: what does this all mean? Well, here’s a ready reckoner, comparing how each team is performing in each of the categories. A lot of green is good, as it suggests the second half of the year will be kind to your team. A lot of red is bad, as it suggests the Angel of Mean Regression is lurking around the corner.
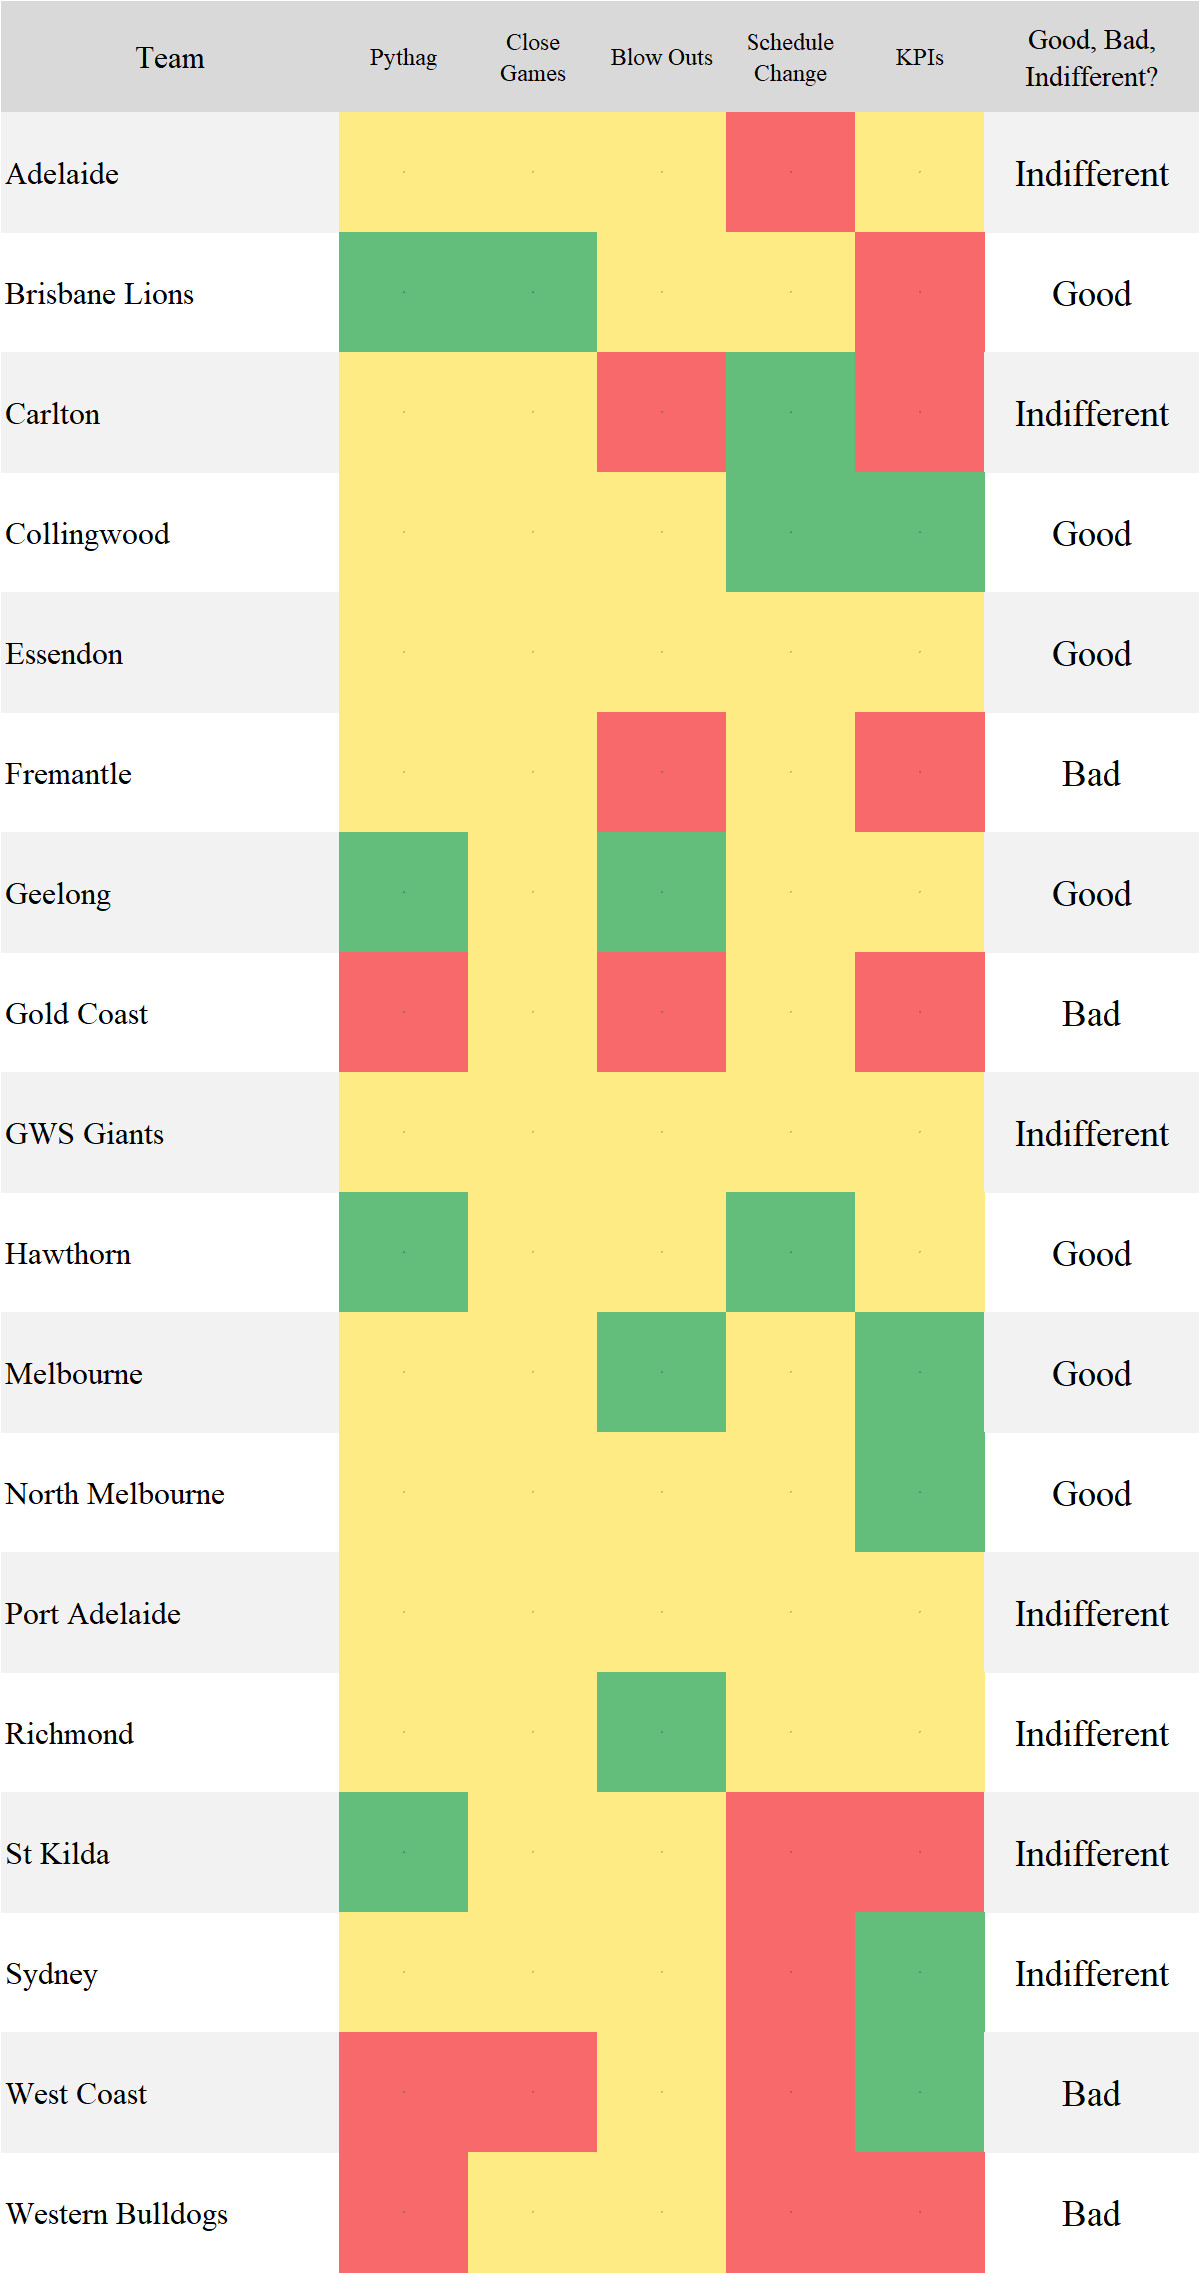
My read? Cam Rose was probably right with his Tuesday column: Richmond, West Coast and Melbourne (in that order) are the three most likely teams to win the premiership from here. Geelong looms as the pre-finals bolter for mine, while Sydney will hang about all year because that’s what they do.
The final three top eight spots come down to six teams: Collingwood, North Melbourne, Hawthorn, Port Adelaide, Adelaide and Greater Western Sydney (who’d have been all-but ruled out were it not for their win over the weekend). Everyone else has some kind of fatal flaw or is too far off the pace.
The first half of the season has been derailed by plenty of off-field chatter and state of the game talk. As the 2018 race enters the second half, the jostling for finals spots and positions in the eight will take over. We can only hope.