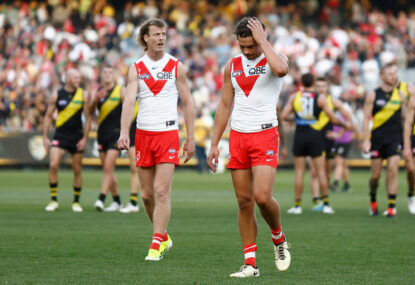
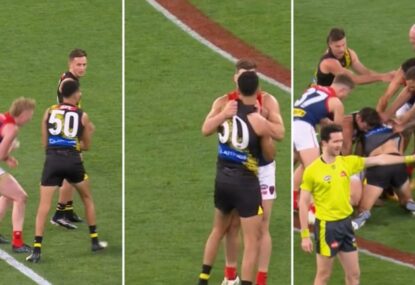
Marlion Pickett gut-punches Oliver right next to Jack Viney, melee obviously ensues
Spicy stuff at the MCG!

There are four rounds to go, and while the top spot on the ladder seems destined to be coloured yellow and black and the bottom spot is predipped in blue, there are many questions left to be answered.
Who makes top two? Four? Eight? Who wins the Brownlow? The Coleman? Is Sydney’s finals streak in real jeopardy? Is Melbourne going to find a way to choke on its finals spot when everything seems destined to end an 11-year drought? Can the Kangaroos really make the eight, as dismal as we thought they would be this season?
Let’s start by looking at the ELO-Following Football ratings for the 18 AFL teams as of Round 19.
Richmond has the same kind of lead here as they do on the ladder: almost insurmountable, holding more than a 13-point gap over second-placed Melbourne. The Tigers sit at 81.7 with a pack of eight competitors in a tight pack between 57 and 69. The Dees are at 68.3 and Geelong are at 66.5, Hawthorn is fourth with 64.9 and the Giants and Magpies are tied at 63.5 apiece. Then there’s a small break before the seventh-place tie between West Coast and Essendon with 59.0. Port is right behind them at 57.2.
Significantly, Adelaide, Sydney and North Melbourne all sit well behind those teams in the 51s. Those numbers represent a form difference that implies they should be underdogs in games against those nine higher-rated teams, barring other circumstances.
For the record, the remaining six ratings have Brisbane up at 48.9, St Kilda at 36.3, Fremantle 27.2, the Bulldogs at 24.2, Carlton with 14.8 and Gold Coast down at 11.2.
(Scott Barbour/Getty Images)
Going strictly by the ratings, Richmond should win their last four to go 18-4 for the season. West Coast has two fairly sure wins, and let’s hypothesise a split with Port in Adelaide and Melbourne in Perth given the Eagles’ frontline issues. That would get them to 16-6 or, at worst, 15-7. Collingwood could win four – Sydney at the SCG and Port at home are the scariest propositions – but are more likely to finish 15-7 as well. Percentage might be the difference between a quarter-final in Melbourne or Perth.
Port Adelaide has to play both West Coast (at home) and Collingwood (at the MCG), plus Adelaide and Essendon at the Oval. With a rating below three of those four opponents, it’s hard to see them winning three, and I have them optimistically pegged at 14-8.
GWS could win all four – Carlton should be a win, and Adelaide and Sydney are both out of form and are home games for the Giants; only Melbourne at the MCG looks like an underdog situation. That puts them at 14-7-1, ahead of Port but behind Richmond, West Coast, and Collingwood.
Could the Demons go four-for-four and grab a top-four spot? They face Gold Coast at home (check), Sydney at home (probably but not certain), West Coast on the road (depends on whether Josh Kennedy is playing), and GWS at home (favoured but far from certain). They look more likely to drop one of the last two and go 14-8, which still puts them comfortably into the finals with a high percentage but not in the top four. Could they drop out of finals? If Sydney wins in Roundn 21, yes. Then they could go on a three-game skid to end 12-10 and certainly be out of finals.
(Quinn Rooney/Getty Images)
Hawthorn also has a potential four-game streak home to make the top four, which for them would make it eight straight wins to end the home-and-away. Essendon and Geelong at the MCG are both toss-ups, but then they have the Saints at Etihad and Sydney at the SCG. If they can get past the Dons and Cats, which our ratings say they should by the skin of their beaks, they can break into the top four. More likely, though, would be a three-one split and a 14-8 finish.
Geelong has a great rating and is playing well but has to negotiate two daunting foes at the MCG over this fortnight to come: Richmond and Hawthorn. They’ll be underdogs in both (though barely in the second case), and seem guaranteed to drop at least one of them. If they could then sweep also-rans Fremantle and the Suns over the last two rounds, they’re looking at either 14-8 (in) or 13-9 (maybe in) to finish the season.
The Swans’ run home has been dissected multiple times in public. Suffice to say it’s going to be tough. They could very well lose all four given current form (and rating) – Collingwood (home), Melbourne (MCG), GWS (Spotless), and Hawthorn (home). An objective observer would say that a split of those four games would be a welcome reward, but that still puts them at just 13-9 and certainly still behind the Cats on percentage. It’s hard to see Sydney making the finals at this point.
Could North Melboiurne make it? They might win all four left – Brisbane in Brisbane (favoured by the punters, not by our ratings), Western Bulldogs at Etihad (check), Adelaide in Adelaide (tough call; I’d take Adelaide) and St Kilda at Etihad to end the season (I’d favour the team with something to play for, if the Kangas still have something to play for).
To me that looks like two sure wins and two coin flips. I’d call it three and one, which puts them at 13-9 as well but certainly behind the Cats on percentage, barring hundred-point beatdowns of their Etihad housemates.
(Quinn Rooney/Getty Images)
Could Essendon make it? No – Richmond wouldn’t lose at the MCG in Round 22, and that alone knocks them out of a 14-win season. Add Port Adelaide in Adelaide and Hawthorn this week and 12-10 looks more reasonable.
Adelaide can’t even reach 14 wins now, and 13 won’t catch the Cats in eighth unless they boost their percentage by 20 points. For the record, they’d have to beat GWS on the road, North Melbourne and Port Adelaide at home plus Carlton to even reach 13 wins; 11-11 is our best guess for them.
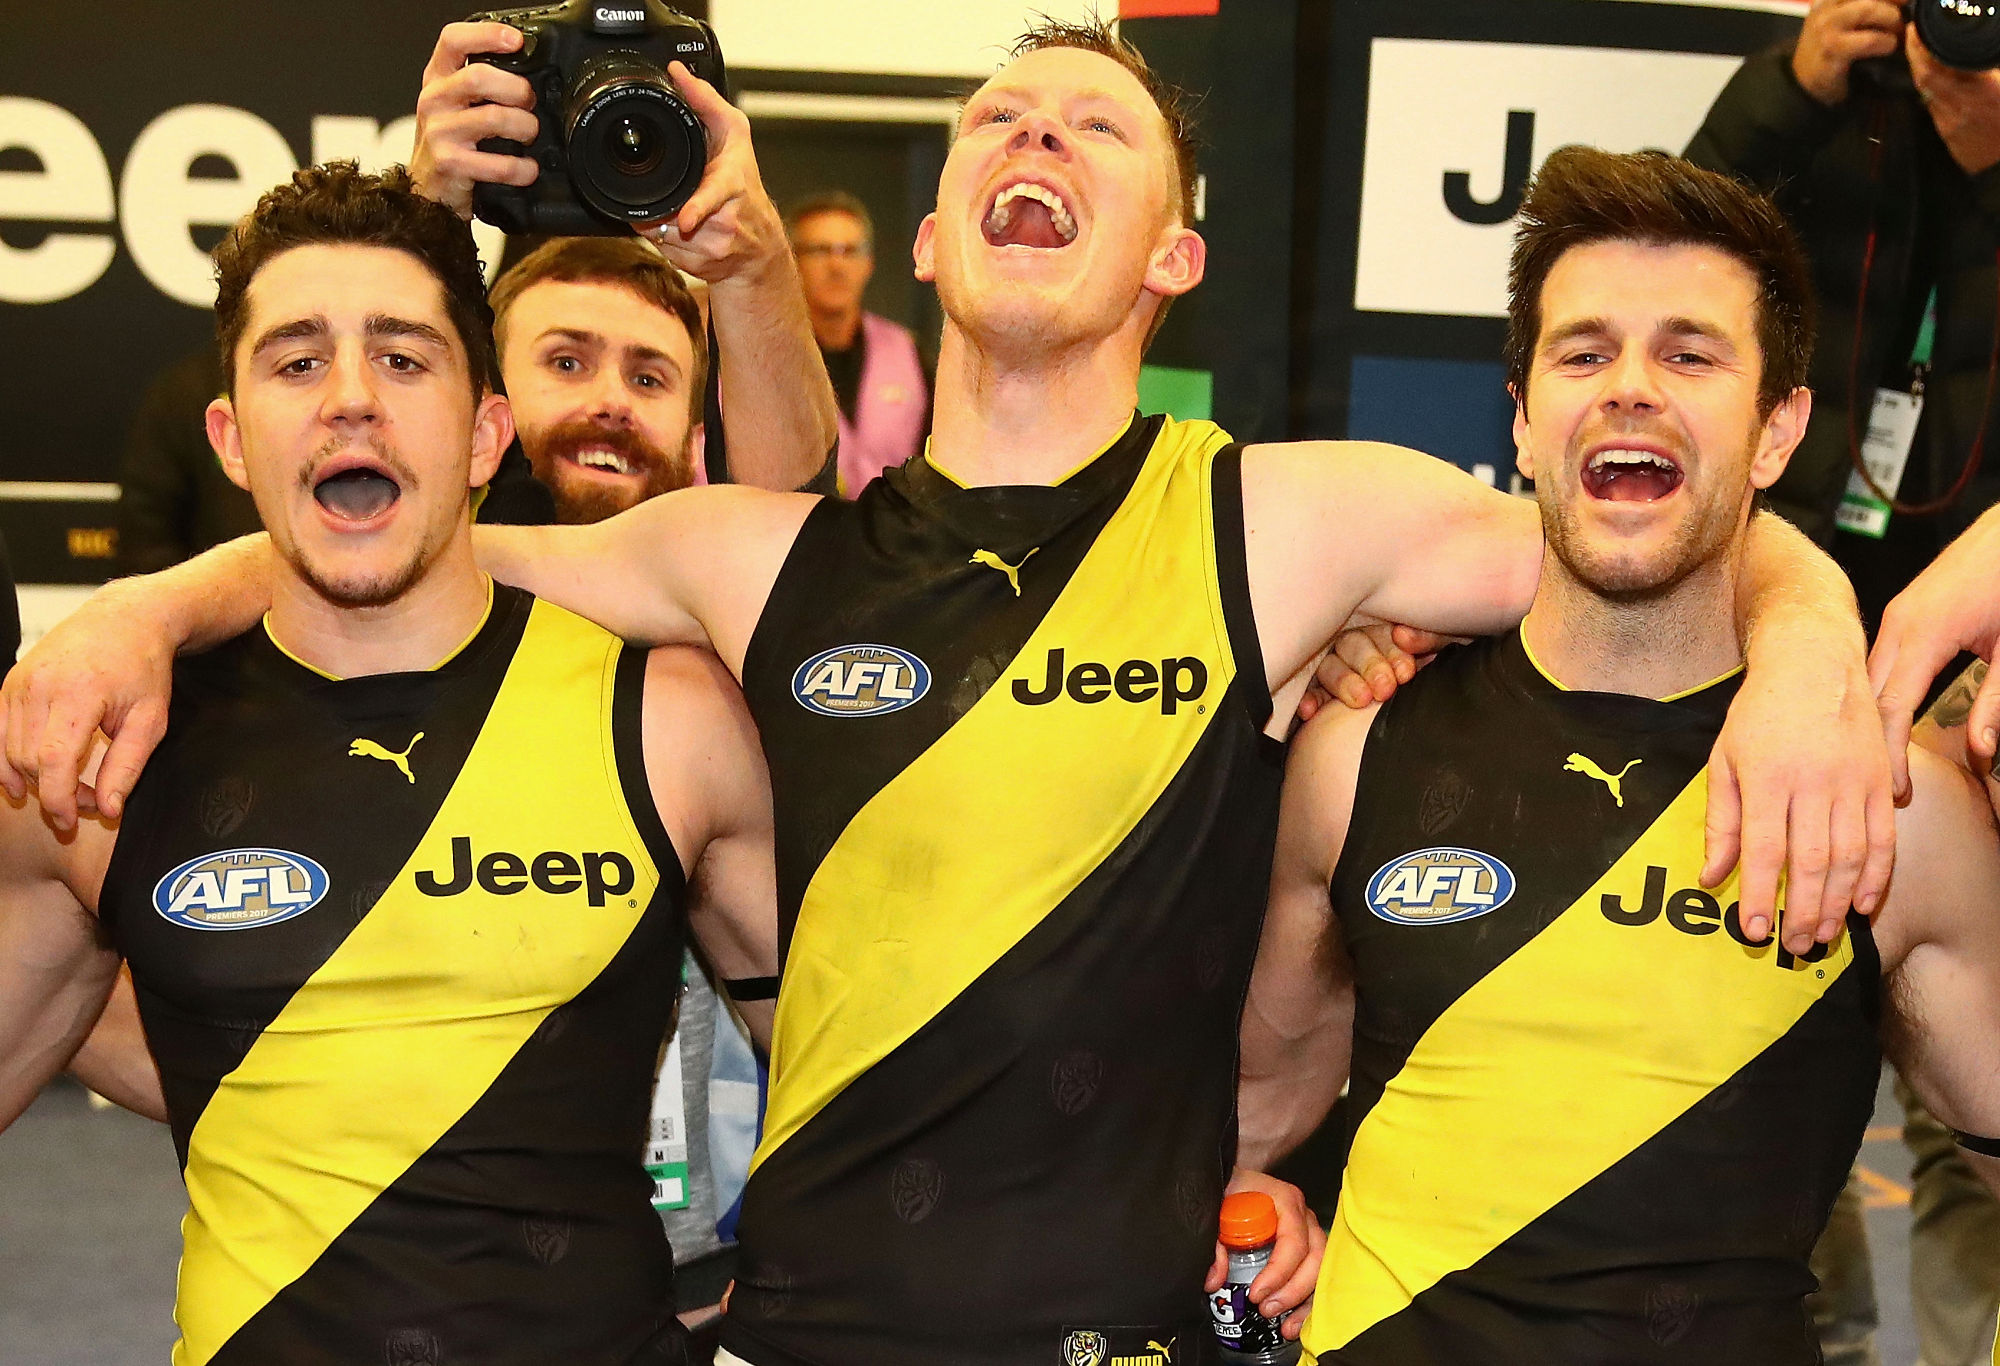
So, what do the numbers and match-ups tell us for finals? Richmond will host one qualifying final, probably against the Giants in another of the most lopsided fan base match-ups in AFL history. West Coast and Collingwood would play in the other, with the location depending on the condition of the Eagles’ forward line in August.
The two elimination finals will see some combination of Port Adelaide, Hawthorn, Melbourne and Geelong battling to make it to the semi-finals in Western Syndey and at the visitor of the West Coast versus Collingwood tilt. The winner of that tilt and Richmond will get another week off and provide another test of the prevailing theory that two games in four weeks make even the best teams rusty.
Book it! We’re setting that prediction in stone.
(Paul Kane/Getty Images)
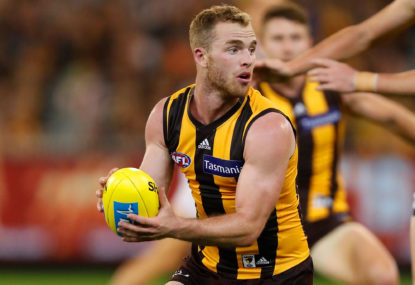
What about the Brownlow? We have Hawthorn’s Tom Mitchell ahead in our meta-player of the year tally right now, having passed Max Gawn of Melbourne last week and extended the lead this week.
The thing to remember about the Brownlow is that you aren’t comparing games across the same round; you’re only worried about who the best player in each particular game happens to be.
With Mitchell being the unadulterated star of a Hawks team that has given him 11 games so far to be on the winning side and that rarely has a player who outshines Mitchell’s 36-plus disposals per game (he averages about 40 per win, which is when he’ll be earning the three votes most often), it’s hard to imagine the midfielder won’t win a midfield-biased award over the dominant ruckman from a team with multiple stars.
Again, for the record, our current point totals for the top ten players of the year as of Round 19 are as follows:
[latest_videos_strip category=”afl” name=”AFL”]
What about the race for the Coleman Medal, the prize for most goals kicked in a season? Let’s assume good health for all involved – albeit a bit of a stretch for West Coast star kicker Josh Kennedy.
Ben Brown has been leading the race virtually all season and holds a five-goal lead after Round 19 over the fast-closing Tom Hawkins, the two on 53 and 48 respectively. Luke Breust has quietly amassed 45 goals this season, while Lance Franklin and Jack Riewoldt are holding fourth place together with 44 goals. Melbourne’s Jesse Hogan and Tom McDonald are the only others with 40 or more goals, with 42 and 40 respectively.
Let’s examine the opportunities these men will have to add to their totals during August.
Brisbane’s back six have been the key to their surge (I can’t call it a ‘resurgence’ because they haven’t been good for quite a while), and they may hold him down to a goal. It’s hard to imagine the Bulldogs or Crows having quite the same success, although either one could make it their resolution that the curly redhead won’t be the reason they lose and tag him well. If it comes down to Round 23, though, Brown could unload a bag on the Saints – he kicked six on them in Round 2.
His closest rival, Hawkins, may not have another seven this Friday night against Richmond and probably won’t when the Cats face Hawthorn in Round 21. But Geelong close with games at home against bottom-six clubs Fremantle and Gold Coast, and it’s certainly a possibility that he could catch Brown in those last two weeks.
Breust has games against the back lines of Essendon (tough), Geelong (very tough), St Kilda (doable) and Sydney in Sydney (hard to know – it might depend on whether they still have a chance for finals in Round 23). Scoring some goals may be doable but making up an eight-goal deficit might not, and Alastair Clarkson is not the type to change an offensive game plan to rack up statistics for one person (Mitchell does his work on consignment, I’m sure).
Jack Riewoldt is nine goals behind the Tasmanian star, and with the wide range of goal-kickers that the Tigers utilise, it’s hard to imagine he’ll have the eight-goal bag he needs to catch Brown.
It’s not hard, however, to picture Buddy Franklin doing it – he did exactly that last season, kicking ten goals in Round 23 to overtake Josh Kennedy and win his fourth medal. Even against his old team Hawthorn in Round 23 this season I’d certainly give him a puncher’s chance of catching Brown, maybe even more of a chance than Hawkins, Breust or Riewoldt.
At the moment it’s still Ben Brown’s Coleman medal to lose.
(Quinn Rooney/Getty Images)
One more thing: long-time readers know that I track the results of the much-bantered but never seriously considered (I hope) ‘once-around’, or 17-game round-robin schedule where every team plays every other team exactly once,
Either the last five games are lopped off (financially unimaginable) or some form of 17-5 reschedule is implemented after Round 18 (assuming a bye still exists – though it would be better placed between rounds 17 and 18 if you were serious about this system).
There is also my favourite hypocrisy, the 18-game version, because nothing says tat we’re doing this for fairness than to tell Adelaide and Port Adelaide that they have to play each other a second time while the Lions and Suns get an extra chance at a win in a second QClash every season.
With four ‘real’ games left for each team, the clubs each have between zero and three non-duplicate games remaining, so the records don’t quite even out midseason. I’ve listed the teams in the AFL’s preferred ‘points-and-points’ order of placement, ignoring actual winning percentage, out of deference to the almighty league, hallowed be its name. I’ve also included the 18-game version record of each team as well.
| Team | Wins | Losses | Draws | Pt differential | GR | 18-game record |
| Richmond | 11 | 4 | 0 | +352 | 2 | 11-4-0 |
| Hawthorn | 11 | 6 | 0 | +335 | 0 | 11-6-0 |
| West Coast | 11 | 4 | 0 | +234 | 2 | 11-4-0 |
| Port Adelaide | 11 | 5 | 0 | +171 | 1 | 11-5-0 |
| Collingwood | 10 | 5 | 0 | +250 | 2 | 11-5-0 |
| Greater Western Sydney | 9 | 5 | 1 | +142 | 2 | 9-5-1 |
| Melbourne | 9 | 5 | 0 | +342 | 3 | 9-6-0 |
| Geelong | 9 | 7 | 0 | +256 | 1 | 9-7-0 |
| Sydney | 9 | 6 | 0 | +127 | 2 | 9-6-0 |
| North Melbourne | 9 | 7 | 0 | +119 | 1 | 9-7-0 |
| Adelaide | 9 | 7 | 0 | +34 | 1 | 9-7-0 |
| Essendon | 9 | 7 | 0 | +28 | 1 | 9-7-0 |
| Fremantle | 6 | 10 | 0 | -294 | 1 | 6-10-0 |
| Western Bulldogs | 5 | 10 | 0 | -370 | 2 | 5-10-0 |
| Gold Coast | 4 | 12 | 0 | -526 | 1 | 4-12-0 |
| St Kilda | 3 | 11 | 1 | -337 | 2 | 4-11-1 |
| Brisbane | 3 | 13 | 0 | -174 | 1 | 3-13-0 |
| Carlton | 1 | 15 | 0 | -689 | 1 | 1-16-0 |
(There was an error in this ladder the last time I published it; thanks to the readers who noted it for me, and it’s been corrected on this version.)
What strikes me is how similar the ladder looks to the actual ladder. That was true as well in the two previous years I’ve tracked this; what changed, because I was using actual games played for finals wherever possible, was how drastically different September comes out, probably because of the domino effect.
For example, in this set-up last year Richmond and Adelaide played away games in their qualifying finals and lost, keeping them out of the grand final and throwing everything else into chaos. Geelong won the ‘once-around’ finals series last year.
Who’s in your ultimate team? Pick the best team and compete with other fans for daily prizes on Draftstars. For the best odds on the game try out Aussie bookmaker PlayUp. Think. Is this a bet you really want to place? Set a deposit limit.
Spicy stuff at the MCG!

Round 5 of the AFL provided plenty of action, from big scorelines to upset wins and pressure starting to build on some clubs and coaches already.
Brisbane forward Charlie Cameron has been handed a one-match suspension for a dangerous tackle on Jake Lever during the Lions' Thursday night win over…


Geelong has been crafty and creative in its list management and has quietly assembled a very exciting young group of midfielders and half-forwards.

Brisbane co-captain Lachie Neale will be looking to lead his team to a victory against Melbourne in what will be his 250th AFL game.


Overreacting to a single loss is one of the most overplayed scenarios in sport, but it’s important for the Swans to still believe that…