George Nepia made his New Zealand debut 100 years ago, but was he really an All Black at just 16 years of age?
He was born 1905, 1904 or 1908 according to various reports, in Wairoa, Hawkes Bay, and is remembered as one of the great Māori players.


“Time, is on my side – yes it is”, Michael Philip Jagger.
Rugby union is a game of two halves, each set for 40 minutes duration. For years, fans and critics have argued about the relative merits and balance of actual playing time versus stoppage, or non-playing time, and its impact on the game as a contest and spectacle being presented to the viewing (and paying) public.
The table below is from an article on The Roar in 2012.
| Rugby World Cup | Time in play (out of 80 minutes) | Percentage of time in play |
| 1991 | 24 mins 48 seconds | 31% |
| 1995 | 26 mins 43 secs | 33.4% |
| 1999 | 30 mins 43 secs | 38.4% |
| 2003 | 33 mins 35 secs | 42% |
| 2007 | 35 mins 12 secs | 44% |
| 2011 | 35 mins 25 secs | 44.3% |
(Source: IRB Report 2011)
The trend shown, while positive in terms of actual game time, indicated that a lot of time was lost with the 80-minute window of combat. I thought I would conduct a short (80 minute) experiment purely for my own gratification to see where we stood in 2018.
My results were based on watching the Fox Sports coverage (with the sound turned down – that’s a story for another day) and using the match clock as my reference.
My criteria for scrums was from whistle to feed. For lineouts, I used ball into touch to throw-in (or random toss in for the Wallabies). Stoppages were all tries, conversions, and returning to halfway for kick-off.
Now, I am no Nicholas Bishop, but here is what I came up with.
First of all, the match lasted 4812 seconds (80:12 minutes). The table below shows a breakdown of ‘lost time’ by event.
| Event | Scrums | Lineouts | Penalties | Stoppages |
| Number of events | 15 | 24 | 15 | 16 |
| Total time (seconds) | 909 | 401 | 478 | 601 |
| Average seconds per event | 61 | 17 | 32 | 38 |
| First half average seconds per event | 65 | 17 | 33 | 26 |
| Second half average seconds per event | 56 | 17 | 30 | 42 |
| Longest event time | 103 | 28 | 98 | 80 |
| Shortest event time | 30 | 7 | 18 | 17 |
So, by my amateur calculations, I observed 2389 seconds of ‘down’ time, or roughly 50 per cent of the total game time. On face value this seems an improvement on the older World Cup statistics – but it also indicates significant room for improvement in time management of our game.
| Event | Downtime |
| Scrums | 19% |
| Stoppages | 12% |
| Penalties | 10% |
| Lineouts | 8% |
| Total | 49% |
Breaking down the lost time, the majority for a single event (19 prt cent) clearly comes from scrum time. There’s no real surprises there, and there were actually few collapses or resets on show in Sydney. An argument for time off at the whistle for stoppage and back on at the feed would seem an uncomplicated option of increasing time-in-play (with all of its flow on effects on the game and it’s outcome – fatigue, required fitness levels, etc).
The same rationale would apply to time-out from a score to the restart and also from whistle for penalties to the restart play. These events came in with a combined value of 22 per cent of total game time. Lineouts were surprisingly quick (eight per cent) and relatively more time effective, though time-off from touch being found to throw-in would add more game time.
It felt like the game did speed up in the latter stages of the second half, compared to what seemed a more dour and error-ridden first half, as the Wallabies chased the game and the All Blacks counter-attacked more – but average stoppage times were similar in each half.
A very long initial scrum time in the first half skews the scrum times, and more tries in the second half skews the stoppage times.
“Time passed. We couldn’t stop it.”, The Goons
While the Goon’s were unable to stop time, rugby union officialdom can.
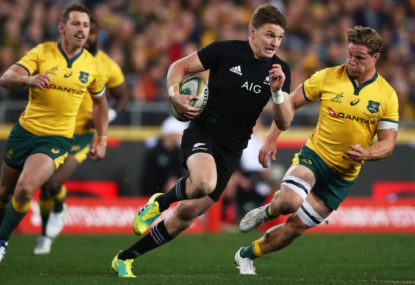
Bledisloe 1 produced a relatively action-packed spectacle in terms of time in play (almost 50 per cent) when compared to Test matches in previous years.
There is, however, a lot of room within the 80-minute game window to increase ball-in-play time. This would have ramifications for many things including player fatigue and fitness, the overall spectacle and ‘feel’ of the game, with both positive and negative consequences.
The question is do we – fans, players, coaches and officials – want or need to implement any changes?
“Timing is everything!” , Anonymous
To finish on a lighter note, let me deal with the elephant in the room from Bledisloe One.
Having scored his first test try, Wallaby No. 921 was gloriously announced to the rugby viewing millions by Greg Clarke. On screen he was shown first emptying both barrels on to the field and then producing a prodigious gob to punctuate his ‘arrival’ to the international rugby scene.
What a terrific advertisement for the game and a great image for all the kiddies viewing at home with mum and dad at home. I wonder if it was also shown on the big screen at the game?
Finally, perhaps the Wallabies should use time as a weapon and milk it for all they can. Taking time away from the All Blacks at Eden Park by using the clock and adding a few seconds here and there will limit their exposure to the attacking weapons of the Kiwi’s.
Time will tell.
Join The Roar rugby editor Christy Doran, former Wallaby Matt Toomua and a cast of regular and special guests as they look at the biggest issues in the game on The Roar Rugby Podcast. If you’re looking for great odds on the next game check out Aussie bookmaker PlayUp. Chances are you’re about to lose. Set a deposit limit.
He was born 1905, 1904 or 1908 according to various reports, in Wairoa, Hawkes Bay, and is remembered as one of the great Māori players.

I don’t really get the comparisons between Joey Manu and Sonny Bill Williams. I realise they have the Roosters in common, along with a…


All Blacks star Jordie Barrett has announced a sabbatical to play with Irish club Leinster at year's end, while committing his future to New…

There are those who will forever play the man - and not the ball - where TJ Perenara is concerned. The All Blacks and…

I well remember the day a New Zealand Rugby staffer put their hands on me. It seems I’d made them angry.The Wellington Sevens was…

New Zealand Rugby (NZR) have described the players' union call for the board to step down while governance reforms are carried out as a…