WATCH: Fyfe tries to put Harley Reid on his backside, gets sat down himself
The young gun is already taking down Brownlow Medallists!

Joshua Cole wrote a very nice piece that used last season’s positions to lay out statistical likelihoods for this season. After the first game or two, we have a small amount of recent data to work with, so let’s use what’s happened in the first 11th of the season to give you a similar forecast for the remainder of the AFL season.
Let’s start by looking at recent seasons.
Season 2018
Only five of the final top eight won their first game, and neither of the eventual grand finalists, West Coast and Collingwood, were among them!
Season 2017
Six of the eight finalists started the season 1-0, including both Richmond and Adelaide.
Season 2016
Just four of the finalists won their first game, although eventual premiers Western Bulldogs were in the top spot, having routed the reigning minor premier Fremantle 103-38. The others were Geelong, Sydney and North Melbourne.
Season 2015
Six of the eight finalists went 1-0, including both Hawthorn and Fremantle.
Season 2018
Interestingly, GWS led after R1 last year too. Four of these eight made finals. West Coast was ninth at 1-0.
Season 2017
Six of the top eight after R1 were there in R23 too. Both exceptions came from Sydney.
Season 2016
Four of the top eight were there at season’s end. It’s a curiously low number, since by Round 6 all eight finalists were in the top eight and stayed there for the rest of the year.
Season 2015
Five of the top eight after Roundn 1 made the finals in 2015.
The average number of wins for teams that end the season in the top eight in any particular round of the season (with nine games) is 5.4 wins, both for 2018 and for the last four seasons combined. That’s close to a two-in-three chance, so none of those numbers listed above are particularly out of line – a team that wins in any specific round, including Round 1, has a two-to-one chance of making the finals.
By the way, in Round 11 of last year the nine winners were precisely the same teams that finished in places one to nine on the ladder at the end of the season! To my knowledge, the reverse has never happened, although in Round 7 of 2017 all nine games were won by the team which began the day on the lower position on the ladder. Those nine higher-placed losers included the first five teams on the final ladder; however, the eventual sixth-placed team, Sydney, entered Round 7 0-6 and in 18th place before beating 17th-placed Brisbane.
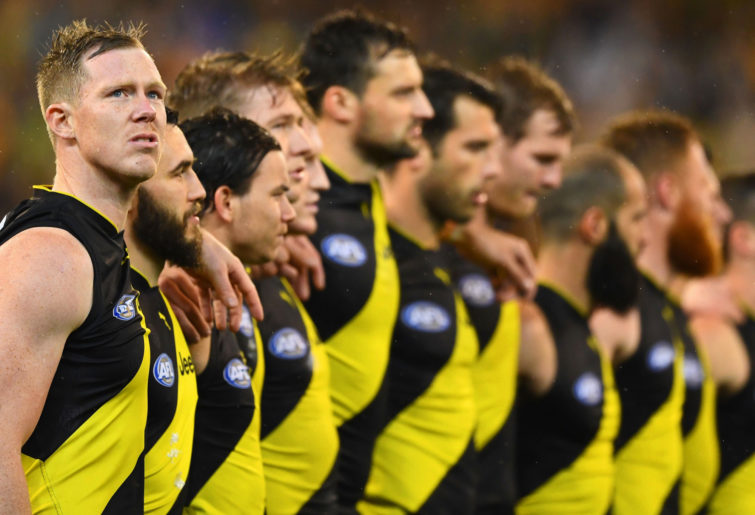
The Richmond Tigers (Quinn Rooney/Getty Images)
Season 2018
Three teams made the finals anyway – in fact three of the four were preliminary finalists: West Coast, Collingwood and Melbourne.
Season 2017
GWS and Sydney were the only two 0-1 teams to make finals in 2017.
Season 2016
Four teams lost their first match and still made finals: Hawthorn, Adelaide, GWS and West Coast.
Season 2015
North Melbourne and West Coast were the only teams to lose their first match and make finals. To those of you who realised, “Well, duh, that’s simple subtraction!”, congratulations. It was written for your neighbour.
Season 2018
Just two of the four 2-0 teams made finals – Port Adelaide and Gold Coast did not – while one of the four 0-2 teams ended up making finals. Did you remember it was Collingwood? Very good!
Season 2017
There were eight 2-0 teams that year, six of which were eventual finalists. Sydney, as we mentioned, was not just the only 0-2 team to make finals (out of eight as well), but they were 0-6 before winning 14 of 16 to make it to September.
Season 2016
Three of four teams that went 2-0 made the finals: West Coast, North Melbourne and Sydney. Gold Coast was the fourth; they reached 3-0 and then finished 6-16. None of the four 0-2 teams played finals that year.
Season 2015
Four of the five 2-0 teams made finals: Adelaide, Sydney, Fremantle and the Dogs; GWS also went 2-0 but missed finals for the last time so far. None of the five 0-2 teams made finals in 2015.
Over the last four years the chances of a 2-0 team making finals was 15 out of 21, or 71.4 per cent. Meanwhile, the chances of an 0-2 team making finals are just 2 out of 21, or 9.5 per cent. If you were 1-1, then you had a 15 out of 46, or 32.6 per cent, chance for making finals.
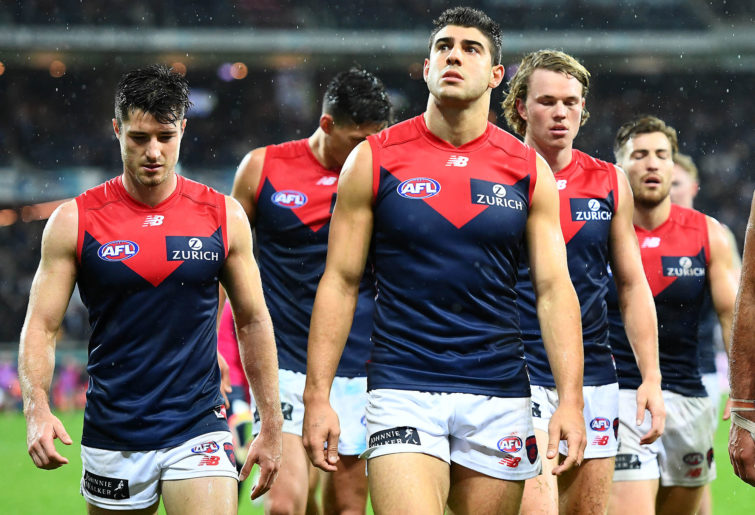
Alex Neal-Bullen and Christian Petracca of the Demons (Quinn Rooney/Getty Images)
Let’s wrap this up as it fits the 2019 season so far.
Beyond the two-game generalisations above, if we consider Mr Cole’s input regarding previous years’ positions – and I’ll throw some more of my own data in as well – then we can refine the figures a bit more.
Last year’s minor premiers
Since 1990 only four teams placing first on the ladder failed to make finals in the following year (four from 28, or 14 per cent). Of course two of those occurred in the last four years – Fremantle in 2016 and Adelaide last year – so do we use the last four years or all 28?
Normally I’d take the 14 per cent version, except that the reason for both Freo and Adelaide’s sudden drop was injury to their stars – exactly what the Tigers are already facing. So let’s split the difference between 50 per cent and 14 per cent and say they have a 32 per cent chance of failure. That gives Richmond a 68 per cent chance of returning to finals. Combine that with the 32 per cent chance of a 1-1 team making finals, and we could assume that Richmond has a 50-50 shot at finals.
Last year’s premiers
As Mr Cole pointed out, this is flukier than the minor premiership, and six teams have gone from premiership to outsiders in one season since 1990 (a 21 per cent possibility). I realise that’s safer than what we just gave the ‘safer’ minor premiers odds, but West Coast isn’t facing Richmond’s injury problems either. Combine that with West Coast’s current 1-1 record and you get a 55 per cent chance for September.
Last year’s other finalists
Collingwood was the grand final runner-up, a placement from which teams have failed to return to finals seven times in the AFL era – four have gone from runner-up to champion the next year, two examples of which were West Coast. On that alone the Pies have about a 25 per cent chance of falling out of finals, or a 75 per cent chance of making finals. Combine that with the one-in-three chance for a random 1-1 team and the Pies have just under 54 per cent odds of returning to finals.
As for Melbourne, only 12 of the last 47 preliminary finalists have failed to return to finals the next year. But combine a 74.5 per cent success rate with the 9.5 per cent rate for Melbourne’s current 0-2 record and they’re down to a 42 per cent chance of making the eight.
We’ll consider the rest of the field in groups.
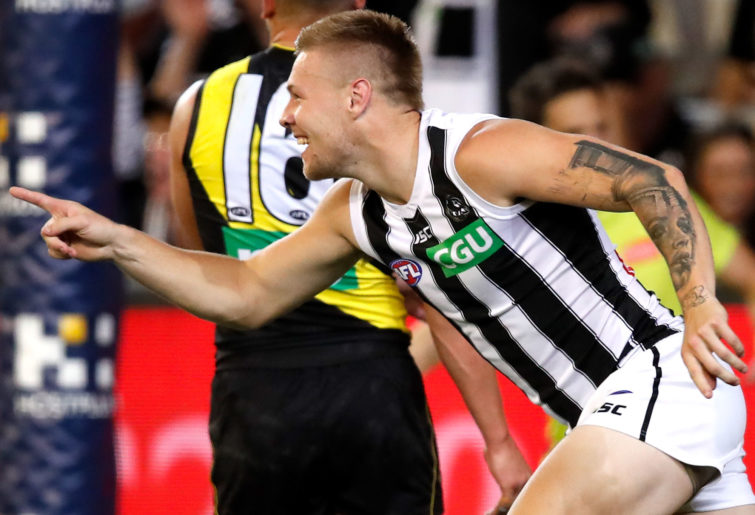
Jordan de Goey of the Magpies (Dylan Burns/AFL Photos)
One or two-week finalists
Only 34 teams of 80 returned to finals the next season over the last 20 years for a return rate of just 42.5 per cent. So Geelong at 2-0 has about a 57 per cent shot at finals (midway between 42.5 per cent and 71.4 per cent). GWS and Hawthorn at 1-1 rounds to 38 per cent (42.5 and 32.6) and Sydney at 0-2 should have something halfway between 42.5 per cent and 9.5 per cent for their record, which is 26 per cent.
The four most competitive non-finalists, positions nine to 12
Of the 80 teams in this category over the last 20 seasons, 36 have made finals the following year, or 45 per cent. For the purposes of this calculation I counted Essendon as the finalist in 2013, not Carlton*. Oddly, those are slightly better odds than the four actual finalists above them!
Therefore Port Adelaide (2-0) might have around a 58 per cent chance (halfway between 45 per cent and 71 per cent), Adelaide at 1-1 could be at around 39 per cent (32.6 per cent and 45 per cent) and Essendon and North at 0-2 may be down to 27 per cent (45 per cent and 9.5 per cent).
The bottom six from 2018
Of the 109 teams that finished 13th or lower over the last 20 years, 21 have made finals the following season – but that’s worth subdividing. Since this decade’s expansion, the teams in 13th and 14th – now above the ‘bottom four’ – have had much more success than the teams below them. Of those 13 teams, five made finals, famously including the last two premiers, while during that same time frame, zero* teams in the bottom four made finals.
*Technically Essendon went from the wooden spoon to finals two years ago, but those were exceptional circumstances that I pray will never be repeated. They’re included statistically, though, because they actually placed last on the field that year, unlike their 2013 ‘ninth-place’ season, which I credited as the seventh place they earnt, and I gave Carlton their original ninth place.
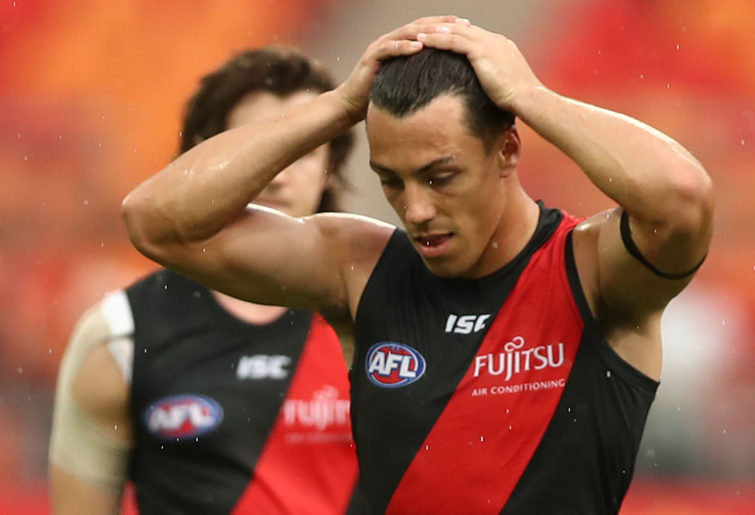
Dylan Shiel of the Bombers (Mark Metcalfe/AFL Photos/Getty Images)
So for the teams in 13th and 14th (the Bulldogs and Dockers; I fought off the temptation to slip the Lions in here), there’s a 38 per cent chance of making finals, which is not far off from the teams just above them, and that’s been shown to coincide with the easier schedule a bottom-six team gets. Only 12 of 80 bottom-four teams have made finals the next year (15 per cent).
Thus the 2-0 Dogs average that 38 with the 71-plus per cent from before and shows a 55 per cent chance of making finals, while Fremantle at 1-1 should be about a 35 per cent chance (38 per cent and the 32 per cent for 1-1 teams).
From the 2018 bottom four Brisbane and St Kilda at 2-0 halfway between 15 per cent and that 71 per cent shot, or 43 per cent. Gold Coast at 1-1 would be 24 per cent, the average 15 per cent and 32.6 per cent, and Carlton at 0-2 has just a 12 per cent chance of making finals (between 15 per cent and 9.5 per cent).
To summarise, here’s your team’s probability of making finals in 2019, given just last year’s finish and their current record.
| Pos. | Team | Chance |
|---|---|---|
| 1. | Port Adelaide Power | 58 per cent |
| 2. | Geelong Cats | 57 per cent |
| 3. | West Coast Eagles | 55 per cent |
| 3. | Western Bulldogs | 55 per cent |
| 5. | Collingwood Magpies | 54 per cent |
| 6. | Richmond Tigers | 50 per cent |
| 7. | Brisbane Lions | 43 per cent |
| 7. | St Kilda Saints | 43 per cent |
| 9. | Melbourne Demons | 42 per cent |
| 10. | Adelaide Crows | 39 per cent |
| 11. | GWS Giants | 38 per cent |
| 11. | Hawthorn Hawks | 38 per cent |
| 13. | Fremantle Dockers | 35 per cent |
| 14. | Essendon Bombers | 27 per cent |
| 14. | North Melbourne | 27 per cent |
| 16. | Sydney Swans | 26 per cent |
| 17. | Gold Coast Sunds | 24 per cent |
| 18. | Carlton Blues | 12 per cent |
And remember: the most important thing is that none of this is at all guaranteed to be accurate even next week, let alone in August. So please don’t take any of this too seriously!
Who’s in your ultimate team? Pick the best team and compete with other fans for daily prizes on Draftstars. For the best odds on the game try out Aussie bookmaker PlayUp. Think. Is this a bet you really want to place? Set a deposit limit.
The young gun is already taking down Brownlow Medallists!
Tomahawk didn't know this is illegal, apparently!
Was Marc Pittonet dudded?

A little over 12 months ago, Collingwood demolished Port Adelaide on a sunny Saturday afternoon at the MCG in the first of many, many…