


- Video
-
Club Roar
Captured a great grassroots sporting moment? We want to see it!Content Collections
The Roar Community
- Join
- Login
State of Origin is several hours away from kick-off and already every man and his rugby league-aligned canine have voiced their opinion as to who will win Game 1 of the 2019 series.
Betting markets look to be solidly favouring the Blues to win the opener and the series. But is the game going to be that much of a foregone conclusion?
One of the best ways to find out is to look at each positional clash statistically and find out whose form will give them the edge over their opponent.
More State of Origin
» Five talking points from Origin 1
» Match report: Queensland win 18-14
» WATCH: Video Highlights from Origin 1
» Re-live the match with our live blog
Key for below stats
Min=Minutes, TA=Try Assists, Run=Runs, Metre=All Run Metres, LB=Line Breaks, OL=Offloads, Tkl=Tackles made, MT=Missed Tackles, Err=Errors, PC=Penalties conceded, MPR=Metres per run, TKL%=Tackle effectiveness
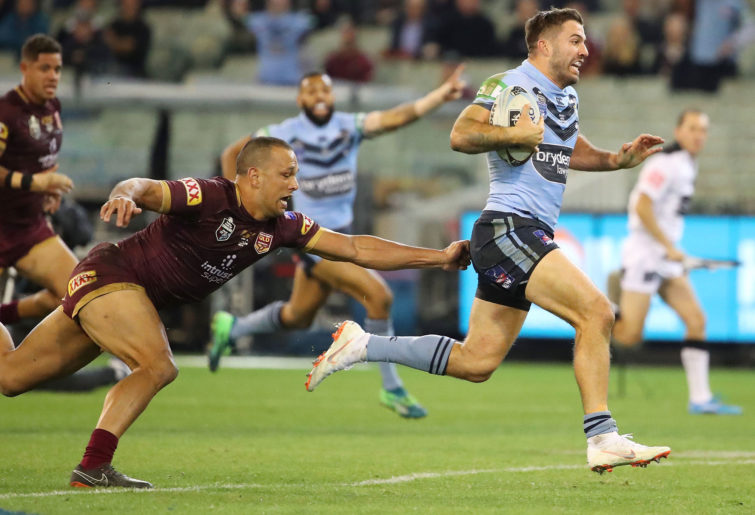
Fullback: Kalyn Ponga vs James Tedesco
Tedesco has played all 11 of his games this year at fullback, while Ponga has played the last eight of his 11 games in the no.1 jumper after starting the year at five-eighth. Ponga has six try assists to Tedesco’s four, however the New South Welshman outperforms his opposite number when it comes to number of runs per game (six more), metres made (70 more per game) and has made one more line break.
Tedesco also has the advantage when it comes to tackle breaks per game (5.55 to 4.0) and offloads (9 to 5). Ponga, though, has dwarfed the Roosters custodian when it comes to defence, making 71 tackles at 79.80 per cent effectiveness, compared to Tedesco’s 27 tackles at 67.50 per cent.
Tedesco has scored eight tries to seven, but Ponga is obviously the better goal-kicker.
| Fullbacks | Min | TA | Run | Metre | LB | TklBrk | OL | Tkl | MT | Err | PC | MPR | TKL% |
|---|---|---|---|---|---|---|---|---|---|---|---|---|---|
| Ponga | 77.4 | 0.5 | 9.7 | 103.9 | 1.2 | 4 | 0.5 | 6.5 | 1.3 | 0.9 | 0.3 | 10.7 | 79.80% |
| Tedesco | 80.2 | 0.4 | 15.7 | 173 | 1.3 | 5.5 | 0.8 | 2.5 | 0.7 | 1.3 | 0 | 11 | 67.50% |
(Photo by Scott Barbour/Getty Images)
Winger: Corey Oates vs Nick Cotric
Oates has the upper hand over his debutant opponent. While Cotric has two try assists to Oates’ nil, the big Broncos winger has had more runs, made more metres, line breaks and tackle breaks. Oates has also scored nine tries to his opponent’s two.
The Maroons will favour Oates in attack, however, defence is one aspect where Cotric outperforms him, as he has made 80.6 per cent of his tackles effectively, almost 2.5 per cent better than the Queenslander.
| Wingers | Min | TA | Run | Metre | LB | TklBrk | OL | Tkl | MT | Err | PC | MPR | TKL% |
|---|---|---|---|---|---|---|---|---|---|---|---|---|---|
| Oates | 80 | 0 | 13.7 | 152.9 | 1.1 | 3.8 | 0.2 | 3.9 | 1 | 1.6 | 0.1 | 11.1 | 78.20% |
| Cotric | 80 | 0.2 | 11.9 | 109 | 0.6 | 3.4 | 0.3 | 4.9 | 1 | 0.5 | 0.1 | 9.2 | 80.60% |
Centre: Michael Morgan vs Josh Morris
This is quite a mismatch as Morgan has only ever started a top-level game at centre once in his career, for Queensland in 2017. Morris has started all 11 of his games this year at centre, meaning he overwhelms the Cowboys half when it comes to centre play, with 600 more metres made from 33 more runs, eight line breaks to one, eight tackle breaks more, more effective defence, and fewer of both handling errors and penalties conceded. Morgan dominates try assists by 13 to 1.
| Centres | Min | TA | Run | Metre | LB | TklBrk | OL | Tkl | MT | Err | PC | MPR | TKL% |
|---|---|---|---|---|---|---|---|---|---|---|---|---|---|
| Morgan | 79.9 | 1.2 | 6 | 43.1 | 0.1 | 1.5 | 0.8 | 14.1 | 3.7 | 2 | 0.7 | 7.2 | 75.20% |
| Morris | 80 | 0.1 | 9 | 97.5 | 0.7 | 2.2 | 0.4 | 9.8 | 0.9 | 0.7 | 0.2 | 10.8 | 87.10% |
Centre: Will Chambers vs Latrell Mitchell
Chambers has started at centre in ten of his 11 games this year, while Mitchell has had eight starts there. The Roosters star has six try assists to Chambers’ one. The experienced Maroon has had more runs, but Mitchell has made more metres. Latrell also has more line breaks, tackle breaks, offloads, tries scored and obviously, goal kicking capability.
Chambers, though, is a better defender and concedes fewer penalties, however he has more handling errors in him.
| Centres | Min | TA | Run | Metre | LB | TklBrk | OL | Tkl | MT | Err | PC | MPR | TKL% |
|---|---|---|---|---|---|---|---|---|---|---|---|---|---|
| Chambers | 79.2 | 0.1 | 8.9 | 74.5 | 0.3 | 1.2 | 0.5 | 10.1 | 1 | 1.3 | 0.2 | 8.4 | 82.20% |
| Mitchell | 77.5 | 0.5 | 7.2 | 77.1 | 0.5 | 2 | 0.9 | 8.2 | 1.2 | 0.9 | 1.2 | 10.7 | 84.90% |
(Photo by Michael Dodge/Getty Images)
Winger: Dane Gagai vs Josh Addo-Carr
Gagai has spent most of the year at centre, playing just two games on the wing, while Addo-Carr is a specialist wide man. Gagai averages more runs per game but Addo-Carr runs for more metres, both per game and per run, as well as dominating the line-breaks by ten to one.
The Queenslander has had slightly more tackle breaks and has done vastly more work in defence, although tackle effectiveness between the two is similar.
| Wingers | Min | TA | Run | Metre | LB | TklBrk | OL | Tkl | MT | Err | PC | MPR | TKL% |
|---|---|---|---|---|---|---|---|---|---|---|---|---|---|
| Gagai | 80.5 | 0.1 | 13.5 | 121 | 0.1 | 3.7 | 0.3 | 13 | 2.1 | 0.8 | 0.4 | 9 | 79.40% |
| Addo-Carr | 80.2 | 0 | 11.4 | 126 | 1 | 3.4 | 0.5 | 3.8 | 0.5 | 1.1 | 0.3 | 11.1 | 77.50% |
Five-eighth: Cameron Munster vs Cody Walker
Arguably the two form players in the NRL, Munster has had ten try assists this year to Walker’s 11. The Melbourne star is more of a ball runner, making nearly two runs more per game to go with 22 metres per game more. Walker has made three line breaks and 12 tackle breaks more, while Munster has been a considerably better defender. The NSW debutant, though, is also the NRL’s top try-scorer.
| Five-eighths | Min | TA | Run | Metre | LB | TklBrk | OL | Tkl | MT | Err | PC | MPR | TKL% |
|---|---|---|---|---|---|---|---|---|---|---|---|---|---|
| Munster | 80.1 | 0.9 | 7.9 | 65 | 0.5 | 2.4 | 0.5 | 21.6 | 1.8 | 0.8 | 0.3 | 8.2 | 89.10% |
| Walker | 80.5 | 1 | 6 | 43 | 0.7 | 3.5 | 0.5 | 11.8 | 2 | 1.1 | 0.4 | 7.2 | 80.30% |
Halfback: Daly Cherry-Evans (c) vs Nathan Cleary
Both players have had quite different seasons so far. Cleary has been underperforming for much of the year, but pulled out a great last game for Penrith to retain his place. Cherry-Evans has been in sublime form but has been missing due to an injury for the last four weeks.
Despite playing four fewer games, Queensland’s new skipper has produced more try assists and line breaks than Cleary. And as far as averages go, Cherry-Evans is also ahead for metres per game and per run, tackle breaks, tackles, fewer missed tackles and has only been outscored by his young opposite number by four points. Cleary makes fewer errors and concedes fewer penalties.
| Halfbacks | Min | TA | Run | Metre | LB | TklBrk | OL | Tkl | MT | Err | PC | MPR | TKL% |
|---|---|---|---|---|---|---|---|---|---|---|---|---|---|
| Cherry-Evans | 76.1 | 0.7 | 5.7 | 59.9 | 0.7 | 1.9 | 1 | 17.7 | 1.9 | 2 | 0.4 | 10.5 | 86.10% |
| Cleary | 79.4 | 0.4 | 6.1 | 48.1 | 0.3 | 1.6 | 1.3 | 15.6 | 2.1 | 1 | 0.3 | 7.9 | 83.90% |
(Bradley Kanaris/Getty Images)
Prop: Jai Arrow vs Paul Vaughan
Arrow has only played four games in his career at prop, one in 2016 and the first three NRL games of 2018. He’s been at lock ever since, while Vaughan has spent all year starting in the front row.
The stats between these two are very close. Arrow averages eight minutes more per game in 2019, while also being marginally ahead in runs and metres, tackle breaks and offloads, while Vaughan is in front for tackles made, fewer missed tackles and errors while also being ahead for metres per run and tackle effectiveness.
| Props | Min | TA | Run | Metre | LB | TklBrk | OL | Tkl | MT | Err | PC | MPR | TKL% |
|---|---|---|---|---|---|---|---|---|---|---|---|---|---|
| Arrow | 62.2 | 0.1 | 16.5 | 147.6 | 0.2 | 1.4 | 1.6 | 28.9 | 2.4 | 0.3 | 0.3 | 8.9 | 88.70% |
| Vaughan | 54.3 | 0.1 | 15 | 138.5 | 0.1 | 1.2 | 0.6 | 30.5 | 1.3 | 0.1 | 0.5 | 9.2 | 91.50% |
Hooker: Ben Hunt vs Damien Cook
Another Queenslander playing out of position. This time it’s Dragons halfback Ben Hunt, who hasn’t started at hooker since the 2017 finals series, whereas Cook is a specialist. Hunt outperforms Cook in two areas – offloads and tries scored. Cook has had 16 try assists to nine, more runs, metres and metres per run, line breaks and has much better defence.
| Hookers | Min | TA | Run | Metre | LB | TklBrk | OL | Tkl | MT | Err | PC | MPR | TKL% |
|---|---|---|---|---|---|---|---|---|---|---|---|---|---|
| Hunt | 79.6 | 0.8 | 4.5 | 37.5 | 0.2 | 1.7 | 1.3 | 21.1 | 3.7 | 1.7 | 0.6 | 8.4 | 82.00% |
| Cook | 80.4 | 1.5 | 5.1 | 47 | 0.5 | 1.8 | 0.9 | 39.2 | 1.4 | 1 | 0.3 | 9.2 | 93.50% |
(Photo by Quinn Rooney/Getty Images)
Prop: Josh Papalii vs David Klemmer
Klemmer has edged out Papalii in most of the stats, playing seven minutes more per game for four more runs, 43 more running metres, five-and-a-half more tackles, slightly fewer missed tackles, metres per run and tackle effectiveness than Papalii. But the figures for both are very similar.
| Props | Min | TA | Run | Metre | LB | TklBrk | OL | Tkl | MT | Err | PC | MPR | TKL% |
|---|---|---|---|---|---|---|---|---|---|---|---|---|---|
| Papalii | 55.6 | 0.1 | 13.9 | 127.9 | 0.2 | 1.4 | 0.8 | 24.5 | 0.7 | 0.1 | 0.4 | 9.2 | 94.10% |
| Klemmer | 62.6 | 0 | 18.2 | 171.6 | 0 | 1 | 1 | 30 | 0.5 | 0.4 | 0.6 | 9.4 | 97.10% |
Second rower: Felise Kaufusi vs Tyson Frizell
Kaufusi has played every game in the back row this year, while Frizell has battled some minor injuries during the season. The Melbourne second rower also averages 25 minutes per game more than Frizell on account of having played every minute so far. He is also averaging more runs, metres, metres per run, offloads and tackles than Frizell. Every other field where the Dragons back rower is ahead, it is by the slimmest of margins.
| Second rowers | Min | TA | Run | Metre | LB | TklBrk | OL | Tkl | MT | Err | PC | MPR | TKL% |
|---|---|---|---|---|---|---|---|---|---|---|---|---|---|
| Kaufusi | 80.2 | 0.1 | 10.5 | 94.6 | 0 | 0.3 | 0.5 | 29.8 | 1.3 | 0.6 | 0.7 | 9.1 | 92.90% |
| Frizell | 55.1 | 0.1 | 9.2 | 82 | 0.1 | 0.3 | 0.3 | 25.2 | 1.2 | 0.6 | 0.2 | 8.9 | 89.70% |
Second rower: Matt Gillett vs Boyd Cordner (c)
Cordner has played one game less than Gillett this year, but two games more than him in the second row. Despite this, the NSW captain has played just four minutes less than the returning Maroon. Cordner outperforms Gillett in nearly every area, with the exception of tackling, and even then, the difference is very slim.
| Second rowers | Min | TA | Run | Metre | LB | TklBrk | OL | Tkl | MT | Err | PC | MPR | TKL% |
|---|---|---|---|---|---|---|---|---|---|---|---|---|---|
| Gillett | 65.8 | 0 | 8.1 | 62.4 | 0.1 | 0.8 | 0.2 | 31.5 | 1.6 | 0.5 | 0.3 | 7.7 | 89.90% |
| Cordner | 72 | 0.1 | 12.2 | 112.4 | 0.2 | 2.1 | 0.5 | 23.2 | 1.7 | 0.5 | 0.2 | 9.2 | 87.20% |
(Photo by Mark Kolbe/Getty Images)
Lock: Josh McGuire vs Jake Trbojevic
McGuire has played two fewer games than Trbojevic and eight fewer at lock this year. The Manly star hasn’t missed a minute while McGuire is averaging just over an hour of playing time per game. Despite this, McGuire leads all the statistical fields except for tackling, line breaks (neither player has made one yet this year) and tries scored (Trbojevic leads one to nil).
| Locks | Min | TA | Run | Metre | LB | TklBrk | OL | Tkl | MT | Err | PC | MPR | TKL% |
|---|---|---|---|---|---|---|---|---|---|---|---|---|---|
| McGuire | 62.2 | 0 | 16.3 | 139.8 | 0 | 1.6 | 0.8 | 25.6 | 1.7 | 0.6 | 0.7 | 8.6 | 88.10% |
| Trbojevic | 80.1 | 0.3 | 13.3 | 109.3 | 0 | 0.2 | 0.4 | 40.5 | 1.1 | 0.5 | 0.8 | 8.2 | 93.70% |
Bench: Moses Mbye vs Jack Wighton
Mbye has been at fullback for the Tigers in nine games this year while Wighton, a former no.1, has been in blistering form at five-eighth. Hard to split these two because of their different roles. Mbye leads statistically, but Wighton leads based solely on form.
| Bench | Min | TA | Run | Metre | LB | TklBrk | OL | Tkl | MT | Err | PC | MPR | TKL% |
|---|---|---|---|---|---|---|---|---|---|---|---|---|---|
| Mbye | 80.6 | 0.2 | 13 | 104 | 0.1 | 3.4 | 0.4 | 10.3 | 1.3 | 1.2 | 0.2 | 8 | 84.50% |
| Wighton | 80 | 0.2 | 7.8 | 77 | 0.2 | 2.7 | 0.4 | 17.3 | 2 | 1.8 | 0.9 | 9.8 | 84.10% |
Bench: Joe Ofahengaue vs Cameron Murray
Rabbitohs lock Murray has been in sensational form and has averaged near 18 minutes and 11 tackles more per game than Ofahengaue has. All their other stats are fairly similar, mostly with the Queenslander ahead.
| Bench | Min | TA | Run | Metre | LB | TklBrk | OL | Tkl | MT | Err | PC | MPR | TKL% |
|---|---|---|---|---|---|---|---|---|---|---|---|---|---|
| Ofahengaue | 43.7 | 0 | 12.7 | 114.5 | 0.1 | 1.3 | 0.8 | 22.7 | 1.5 | 0.5 | 0.7 | 9 | 91.60% |
| Murray | 61.5 | 0.1 | 11.5 | 107.2 | 0.5 | 2.1 | 1.4 | 33.5 | 1.1 | 0.5 | 0.9 | 9.3 | 92.50% |
Bench: Dylan Napa vs Angus Crichton
Napa is a prop and Crichton a back rower, so some stats will be lopsided. Game time is one such example, where Crichton is nearly 30 mins per game higher. The Rooster looks to be stronger defensively, while Napa has the edge when it comes to making metres.
| Bench | Min | TA | Run | Metre | LB | TklBrk | OL | Tkl | MT | Err | PC | MPR | TKL% |
|---|---|---|---|---|---|---|---|---|---|---|---|---|---|
| Napa | 43.3 | 0.3 | 11.5 | 100.9 | 0.1 | 1.3 | 0.1 | 19.5 | 2.5 | 0.4 | 0.5 | 8.8 | 84.80% |
| Crichton | 72.7 | 0 | 10.4 | 81.1 | 0.2 | 1.8 | 0.8 | 30.1 | 1.6 | 0.7 | 0.6 | 7.8 | 89.20% |
(Photo by Cameron Spencer/Getty Images)
Bench: David Fifita vs Payne Haas
Both Broncos are on debut and have had strong seasons, especially he New South Welshman. Fifita has played all 11 games, while Haas has run out for seven matches this year. Despite that, Haas has played more minutes, made 32 more runs, 350 more metres, 19 more tackle breaks, one more offload and 20 more tackles in total.
| Bench | Min | TA | Run | Metre | LB | TklBrk | OL | Tkl | MT | Err | PC | MPR | TKL% |
|---|---|---|---|---|---|---|---|---|---|---|---|---|---|
| Fifita | 37.6 | 0.1 | 8.2 | 74.5 | 0.2 | 0.7 | 0.4 | 17.8 | 0.8 | 0.1 | 0.2 | 9.1 | 91.60% |
| Haas | 64.9 | 0 | 17.4 | 167.4 | 0.1 | 3.9 | 0.7 | 31.1 | 0.9 | 0.3 | 0.4 | 9.6 | 92.80% |
In the head-to-head rankings (stats fields won)
Fullback: NSW 11-5
Winger: QLD 11-9
Centre: NSW 13-4
Centre: NSW 10-6
Winger: Drawn 8-all
Five-eighth: QLD 11-7
Halfback: QLD 9-8
Prop: QLD 10-8
Hooker: NSW 14-3
Prop: NSW 10-8
Second rower: QLD 10-8
Second rower: NSW 13-4
Lock: NSW 10-8
Bench #1: QLD 11-5
Bench #2: NSW 12-5
Bench #3: NSW 9-8
Bench #4: NSW 9-7
Total: NSW 164-128
Backs (including bench #1): NSW 56-45
Halves: QLD 20-15
Forwards (including bench #2, #3 and #4): NSW 93-63
Spine (fullback, five-eighth, halfback and hooker): NSW 40-28
Expect New South Wales to play this game largely through the middle, especially for the majority of the first hour, before they start looking to shift the ball wide. Queensland, though, will be looking to play more on the edges of the ruck.
The figures though show the Blues should win this game.