


- Video
-
Club Roar
Captured a great grassroots sporting moment? We want to see it!Content Collections
The Roar Community
- Join
- Login
As every NRL season rolls into the first State of Origin game of the year, the excitement is palpable.
It lasts all the way up until the first round after Game 1 is completed before the emotions take a dramatic 180-degree turn. The attention then falls onto the NRL competition and the negative impact Origin has on the quality of club games, with players omitted due to representative commitments, which invariably leads to lower-ranked sides beating depleted top teams.
It’s punishing top sides and rewarding poor ones, which is seen to be quite unfair. But just how warranted is that theory?
Below is a ladder showing the record of each current NRL side during the Origin period, from 2007 to 2018 (inclusive).
Origin-period records: 2007-2018
| Wins | Draws | Losses | Byes | For | Against | Points | +/- | |
|---|---|---|---|---|---|---|---|---|
| Melbourne | 45 | 0 | 28 | 21 | 1554 | 1143 | 132 | 411 |
| Manly | 44 | 0 | 29 | 21 | 1721 | 1332 | 130 | 389 |
| Cronulla | 43 | 1 | 32 | 18 | 1427 | 1493 | 123 | -66 |
| Sydney | 41 | 1 | 33 | 19 | 1530 | 1538 | 121 | -8 |
| Warriors | 42 | 0 | 34 | 18 | 1654 | 1459 | 120 | 195 |
| St.George-Illawarra | 39 | 1 | 34 | 20 | 1451 | 1338 | 119 | 113 |
| Brisbane | 37 | 1 | 34 | 22 | 1521 | 1539 | 119 | -18 |
| Canterbury | 39 | 0 | 37 | 18 | 1538 | 1521 | 114 | 17 |
| South Sydney | 39 | 0 | 38 | 17 | 1634 | 1545 | 112 | 89 |
| North Queensland | 33 | 0 | 39 | 22 | 1480 | 1673 | 110 | -193 |
| Penrith | 36 | 1 | 39 | 18 | 1566 | 1601 | 109 | -35 |
| Canberra | 35 | 0 | 40 | 19 | 1716 | 1668 | 108 | 48 |
| Parramatta | 33 | 1 | 42 | 18 | 1420 | 1595 | 103 | -175 |
| Wests Tigers | 35 | 0 | 43 | 16 | 1535 | 1718 | 102 | -183 |
| Gold Coast | 29 | 0 | 44 | 21 | 1398 | 1629 | 100 | -231 |
| Newcastle | 25 | 0 | 49 | 20 | 1408 | 1729 | 90 | -321 |
It’s worth noting in this data that the Origin period starts from the round prior to the first Origin game, until the end of the round directly after the last Origin game. (The 1987 exhibition Origin fixture is not considered as part of the traditional series.)
When compared with the total regular season record over the same period, Cronulla and the Warriors are the only big movers up the table, with the Broncos the only team to experience a significant drop. So it could well be argued that the Origin period isn’t having the negative impact on top sides as feared.
Regular-season records: 2007-2018
| Wins | Draws | Losses | Byes | For | Against | Points | +/- | |
|---|---|---|---|---|---|---|---|---|
| Melbourne | 201 | 2 | 85 | 22 | 6629 | 4121 | 448 | 2508 |
| Manly | 166 | 1 | 121 | 22 | 6426 | 5389 | 377 | 1037 |
| Brisbane | 165 | 2 | 121 | 22 | 6346 | 5527 | 376 | 819 |
| Sydney | 153 | 2 | 133 | 22 | 6107 | 5748 | 352 | 359 |
| South Sydney | 149 | 1 | 138 | 22 | 6258 | 5943 | 343 | 315 |
| St.George-Illawarra | 148 | 1 | 139 | 22 | 5550 | 5220 | 341 | 330 |
| Canterbury | 146 | 0 | 142 | 22 | 5885 | 5894 | 336 | -9 |
| North Queensland | 144 | 0 | 144 | 22 | 6323 | 5932 | 332 | 391 |
| Cronulla | 139 | 2 | 147 | 22 | 5346 | 5745 | 324 | -399 |
| Penrith | 138 | 2 | 148 | 22 | 6026 | 6206 | 322 | -180 |
| Warriors | 133 | 3 | 152 | 22 | 5952 | 6310 | 313 | -358 |
| Wests Tigers | 130 | 0 | 158 | 22 | 5771 | 6606 | 304 | -835 |
| Canberra | 129 | 1 | 158 | 22 | 6404 | 6660 | 303 | -256 |
| Gold Coast | 122 | 1 | 165 | 22 | 5470 | 6625 | 289 | -1155 |
| Parramatta | 119 | 2 | 167 | 22 | 5362 | 6547 | 284 | -1185 |
| Newcastle | 111 | 2 | 175 | 22 | 5463 | 6845 | 268 | -1382 |
The Warriors are the only side to have scored over 30 per cent of their victories from 2007-18 during the Origin period, and even then, it’s only just with 30.66. The next best is Cronulla with 29.45 per cent.
The three clubs with the lowest percentage of their wins during the Origin period are North Queensland (21.29%), Brisbane (21.26%) and Melbourne (20.36%).
The other impact State of Origin has on the NRL competition is interest. In recent years there has been a growing concern that Origin detracts from the competition too much, which is an issue that certainly needs to be addressed.
The NRL, to their credit, has moved the second Origin game to Sunday and suspended the competition for one week so as to lessen its impact. But just how much is the state-versus-state rivalry impacting the competition?
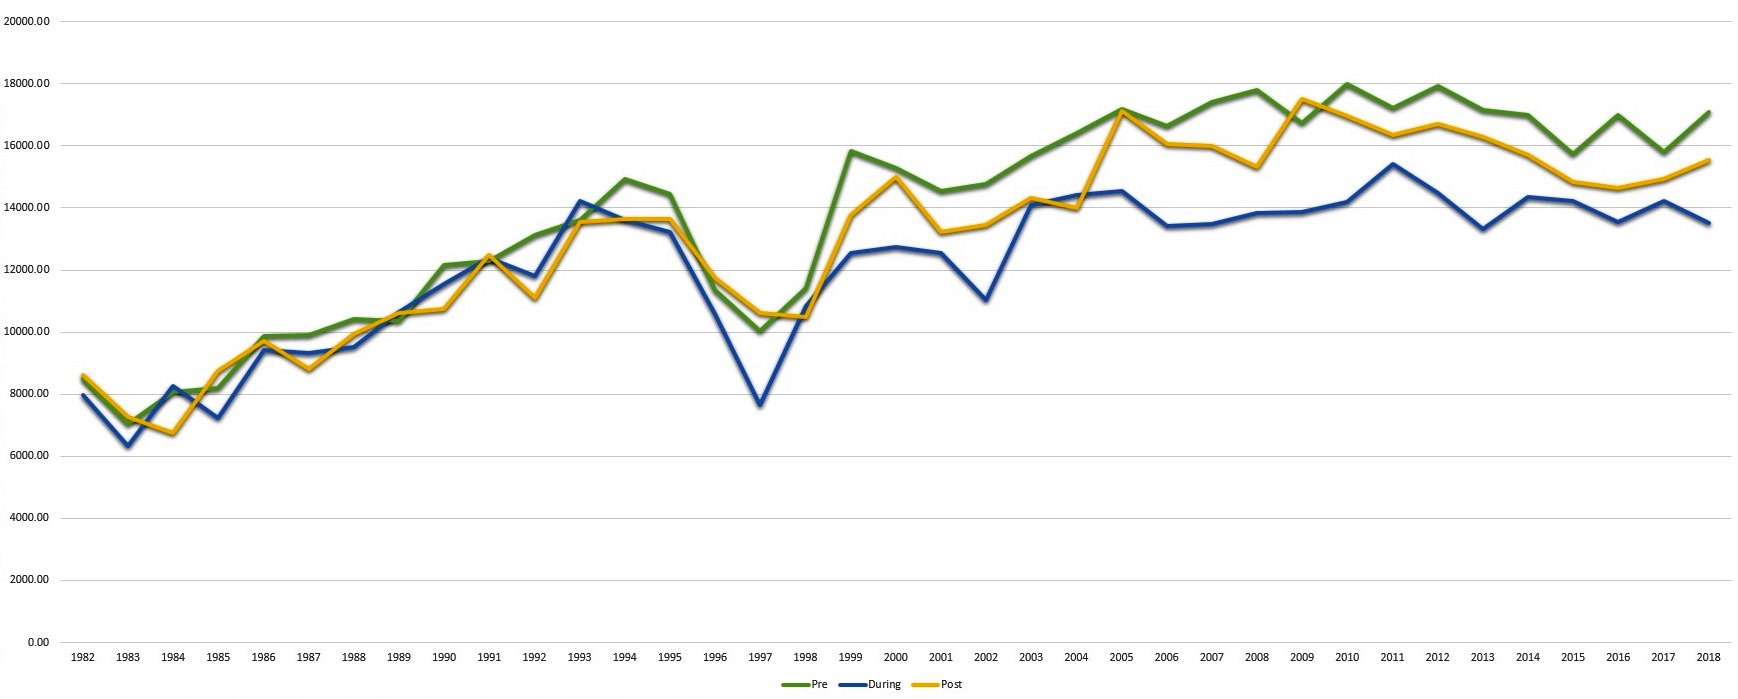
Up until 1995, crowds were barely impacted, however for all but two seasons since then, the average crowd figure during the Origin period was lower than pre- and post-Origin periods, and from 2005, that gap has widened.
In 2011 there was a spike in crowds during the Origin period which closed that gap significantly, while 2015-17 saw the post-series figures only marginally better. But 2018 bucked the trend as pre- and post-Origin attendances improved, while the period in between dropped off again.
So there is an attendance decline, however, is it enough to warrant any great concern, or to demand any dramatic changes to the schedule? Given the gap has been narrowing and almost levelling out, it’s hard to see any reason to be all that concerned about the drop-off.
The only thing the NRL could possibly consider would be to reduce the number of weeks Origin runs for. The shortest such period was in 1997, when only 18 premiership games were played. In 2018, 40 NRL matches were played, the smallest number since 2000, which saw five fewer fixtures.
Between 1988 and 1996, between 24 and 32 premiership games played during Origin each year. Perhaps this is the sweet number worth revisiting, particularly given how close the crowds were then.
All up though, the data suggests the competition isn’t really struggling and that the results in this period aren’t as erratic as we’ve been led to believe.