Footy Fix: Tigers try to drag Dees down to their level and beat them with experience - and it nearly works
There's an old saying that you should never argue with an idiot, because they'll drag you down to their level and then beat you…


Seven weeks left and there are two ladder-related topics to cover.
Every year someone whines about the inherent unfairness of the unbalanced schedule necessitated by trying to fit 22 games into a league in which each team has 17 opponents. Most ‘solutions’ to this ‘problem’ involve having some kind of ‘once-around’ schedule of 17 games, playing each opponent exactly once, and then either going straight to the finals or adding an 18th game for both rivalry and home-away balance purposes.
Neither solution is realistic if you’re expecting owners to give up four revenue opportunities or repurposing those other five games into some kind of six-team pre-finals pod system.
Basically the effort is designed to fix a problem that doesn’t really exist. So for the last five years I’ve tracked what this mythical once-around schedule would result in using the actual games being played. It’s imperfect as we’re excluding the five games with repeated opponents in the back half of the schedule, and without the express written permission of the AFL scheduling committee some teams might end up with fewer than eight or more than nine home games, for example. But it’s close enough for our purpose, which is to demonstrate that we’re going to get the same approximate result for the most part.
So after 16 rounds we’ve had nine duplicated games excluded already – and, again, because the AFL isn’t in on our project, those games aren’t evenly spread among the teams. The Bulldogs have already played three of their doubled opponents twice – and will complete all five games by Round 20 – while five other teams have yet to have any duplicate games through their first 16 games.
So here are the current records, along with their ‘real’ records.
| Team | AFL record | Once-around record | Rematch games still to come | |
|---|---|---|---|---|
| Geelong | 12-3 | 11-2 | 3 to go | |
| West Coast | 11-4 | 10-4 | 4 to go | |
| Collingwood | 10-5 | 9-5 | 4 to go | |
| Brisbane | 10-5 | 10-5 | 5 to go | |
| GWS | 9-6 | 9-5 | 4 to go | |
| Richmond | 9-6 | 9-6 | 5 to go | |
| Port Adelaide | 8-7 | 7-7 | 4 to go | |
| Adelaide | 8-7 | 8-6 | 4 to go | |
| Essendon | 8-7 | 6-7 | 3 to go | |
| North Melbourne | 7-8 | 7-8 | 5 to go | |
| Fremantle | 7-8 | 7-7 | 4 to go | |
| Western Bulldogs | 7-8 | 5-7 | 2 to go | |
| Hawthorn | 6-9 | 6-9 | 5 to go | |
| Sydney | 6-9 | 6-8 | 4 to go | |
| St Kilda | 6-9 | 5-9 | 4 to go | |
| Melbourne | 5-10 | 5-10 | 5 to go | |
| Carlton | 3-12 | 3-11 | 4 to go | |
| Gold Coast | 3-12 | 3-11 | 4 to go |
It’s too early to draw conclusions, but it’s finally starting to diverge from the ‘actual’ 22-game table. More as the season progresses.
A few weeks ago we looked at what the probabilities were historically for teams to make finals from the record they hit the halfway mark with. Here are some quick hitters for what the history looks like over the last 24 years for teams with seven games to go in the AFL season:
For the team in first place (Geelong in 2019):
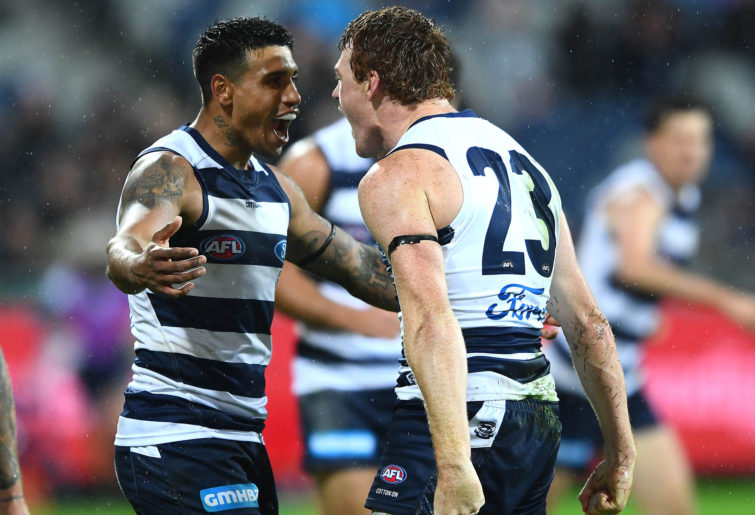
(Quinn Rooney/Getty Images)
For the second-placed team (West Coast in 2019):
For the teams in positions three and four (Collingwood and Brisbane in 2019):
The teams in the next four positions – the potential elimination finalists (currently GWS, Richmond, Port Adelaide and Adelaide):
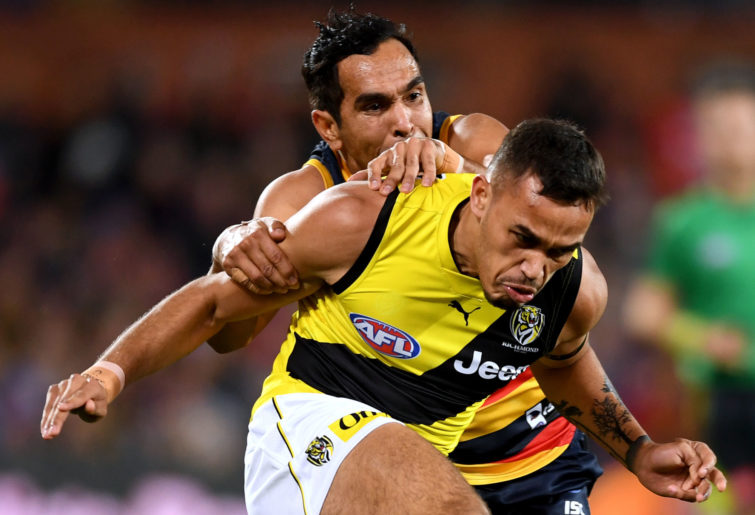
(Mark Brake/Getty Images)
Consider the four teams at the door – those currently in positions nine to 12 (Essendon, North Melbourne, Fremantle, and Hawthorn):
No team has made the leap into finals from below 12th at this late stage of the season since 1995, when the late lamented Brisbane Bears zoomed from 4-11 and 14th place to win six of their last seven (losing only a two-goal match at 20-2 Carlton) and sneak in as the eighth seed, where they were promptly beaten by that same margin to those same Blues back when there was a first-round first versus eighth match-up in the fledgling days of the eight-team finals system.
However, unless you’re within two positions of last place (looking at you, Melbourne and Carlton), you’re not in danger of catching Gold Coast for the wooden spoon this year.
Also, no team has descended to dead last place from any higher than two wins, or eight premiership points, above where the last team sits, which limits the possibilities to just three teams this season. And the last-place team after 15 games has wound up with the spoon in 18 of the last 24 seasons, a 75 per cent rate, so it really is the Suns’ to lose at this stage.
Speaking of premiership points, here are the calculations of the likelihood of finals activity depending on how far your team is from the cut line – that point line that delineates between eighth and ninth places. This season that line sits at 32 points since both Adelaide and Essendon are on 32. That’s near the average cut-line over the last 24 years, which is 31.75, to be exact.
If you’re more than 12 points above that line – Geelong is currently +16 – you’re guaranteed to make finals.
If you’re between five and 12 points above the line – West Coast is +12, Collingwood and Brisbane are +8 – there’s about a 95 per cent chance that you’ll still be there after Round 23.
If you’re between one and four points above the line – GWS and Richmond are both +4 – the odds are 41 of 53, or 77.4 per cent. It still looks likely.
At what I call ‘+0’, meaning right on the line but in the top eight on percentage, like the two South Australian clubs are at the moment, your chances are 15 in 21, or 71.4 per cent. If you’re on the minus-zero side – a la Essendon – those odds decrease to 8 in 15, or 53.3 per cent, because you’re fighting the percentage issue.
Below that the odds obviously decrease, but if you’re within four points of the cut line, you’ve still got a 27.7 per cent shot – 13 of 47 teams have done it. So the Kangaroos, Dockers, and Doggies still have a decent chance.
Not so for everyone between four and -14. Only once in the last 20 years has any team in that range made finals, and Tigers fans will remember that in 2014 Richmond won its last nine games to sneak into eighth spot. They’d already made it to 12th, but they were still 14 points out with seven games to go. Before that it was the Bears, who were equally behind in 1995. So Hawthorn, Sydney, St Kilda and Melbourne? You’d better plan on seven straight wins to have even a sniff.
And Carlton and Gold Coast? Thanks for playing. Here’s a copy of our home game.
Who’s in your ultimate team? Pick the best team and compete with other fans for daily prizes on Draftstars. For the best odds on the game try out Aussie bookmaker PlayUp. Think. Is this a bet you really want to place? Set a deposit limit.
There's an old saying that you should never argue with an idiot, because they'll drag you down to their level and then beat you…

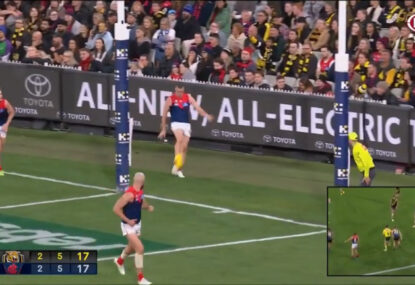
The ball hit the boundary umpire's leg and rebounded back into play, leading to debate over whether a throw-in should have been called for.
Poor Jacob Hopper just can't catch a break.
The Dees will be hoping it doesn't prove costly!
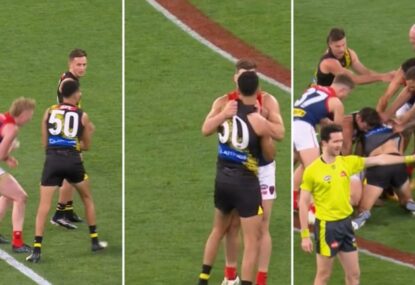
Spicy stuff at the MCG!