


- Video
-
Club Roar
Captured a great grassroots sporting moment? We want to see it!Content Collections
The Roar Community
- Join
- Login
Opinion
Based solely on last year’s placements and 124 years of history, focusing especially on the last quarter-century of eight-team finals – the ‘modern finals’ era – we can make some tenuous and some ironclad predictions on how your favourite team will fare in the 2020 AFL campaign.
Today I’ll finish the ladder and put the whole project together. Read my take on 2019’s top four teams, the teams that finished fifth to eighth, and the teams that finished ninth to 14th.
8-14, 97.7 per cent
The key to the hope within Sydney hearts – at least those belonging to the fans who didn’t watch them get demolished by GWS last weekend – is that abnormally high percentage for a 15th-placed team as well as a certain Queensland-based club that made history for jumping from 15th to second place just last year. Brisbane also had a very high percentage for their record – they were to 90 per cent despite only winning five games – and Sydney was near 100 per cent despite winning only a third of their games last year.
There aren’t many surefire tools in the prediction business, but this is the surest-firest one. If a sub-500 team has an abnormally high percentage, they’re virtually guaranteed to improve their record the following year.
Here’s the list moving backwards in time of the last ten teams with .500 or worse records and an abnormally high percentage, noting the improvement from that year to the next for eight of them:
| Team | 2018 | 2019 |
|---|---|---|
| Brisbane | 15th, 5-17, 89 per cent | second, 16-6, 118 per cent |
| 2017 | 2018 | |
| Collingwood | 13th, 9-13, 99 per cent | third, 15-7, 120 per cent |
| 2015 | 2016 | |
| Collingwood | 12th, 10-12, 106 per cent | 12th place, 9-13, 96 per cent |
| 2014 | 2015 | |
| Adelaide | 10th, 11-11, 114 per cent | seventh, 13-8-1, 116 per cent |
| 2013 | 2014 | |
| North Melbourne | 10th, 10-12, 120 per cent | sixth, 14-8, 117 per cent |
| 2013 | 2014 | |
| Richmond | 12th, 10-11-1, 112 per cent | fifth, 15-7, 123 per cent |
| 2011 | 2012 | |
| Brisbane | 15th, 4-18, 82 per cent | 13th, 10-12, 91 per cent |
| 2008 | 2009 | |
| Port Adelaide | 13th, 7-15, 96 per cent | tenth, 9-13, 89 per cent |
| 2008 | 2009 | |
| Fremantle | 14th, 6-16, 94 per cent | 14th, 6-16, 77 per cent |
| 2004 | 2005 | |
| Adelaide | 12th place, 8-14, 96 per cent | first, 17-5, 137 per cent |
Watching Sydney play this autumn, it’s hard to reconcile this data with what’s on the field right now, but that’s not the point of this exercise. Eight of those ten examples showed significant improvement – the other two remained fairly steady – and six of those jumped into finals the next year!
All other things being equal in 2020
We can’t ignore the fact that the last 15th-placed team before the Lions to make finals the next year was Footscray back in 1997. But the evidence suggests that the Swans will move up the ladder in 2020, and maybe quite a distance up.

(Quinn Rooney/Getty Images)
7-15, 84 per cent
Or, you can just take their record from the last half of the season if you want to be optimistic about it.
Only one team has moved from 16th into finals this century: the 2011 Eagles. Three others – the 1997 Bulldogs, the 1998 Demons and the 1999 Lions – have also leapt into finals, but all four of the teams made it into the top four, the earlier two placed third, the others fourth.
But for the other 20 teams that placed 16th – there were just 15 teams until 1995 – the average ladder position the following year was 14.55. That’s about halfway between 14th and 15th – or, in other words, not much better. Six of them won the spoon the next season. Only Richmond escaped the bottom third, and they did so by exerting their superpower of coming in ninth at will.
All other things being equal in 2020
Carlton has a one in six shot of being a double-chance finalist and a five-in-six-shot of staying in the bottom four.

(Quinn Rooney/Getty Images)
5-17, 79 per cent
Over the course of the last eight seasons – the life span of the Gold Coast Suns plus one initial season – the average finishing place for the previous season’s 17th-placed team is 16.375. Once Gold Coast jumped to 14th the next year. The best any team’s ever done, interestingly, is the last year these Demons were here – they began their ascent by moving to 13th in 2015 followed by 11th, ninth, and fifth. And suddenly they fell back to 17th.
Do they do that again? Do they simply wipe last year clean and return to finals this season? Are they back to being a perennial also-ran? We don’t have any information that will tell us. The data set’s too small.
In recent history teams with several consecutive finals appearances often bounce right back the next year into finals. Hawthorn’s 12th place in 2017 was a blip and Richmond’s 13th the previous season bounced all the way back into a premiership. On the other hand, Fremantle followed five straight finals – and a minor premiership in 2015 – with a fall down to 16th and has yet to recover. Adelaide dropped to 12th in 2018 and stayed about there last year.
Looking back a little farther, Collingwood followed a string of eight finals appearances with a sudden drop to 11th in 2014. It wasn’t until two years ago that they made their return.
In searching for the most comparable statistical situation in modern finals history, the following two examples stood out.
The first is that Hawthorn placed 15th out of 16 in 1997 and gradually climbed up the ladder until they reached sixth and a preliminary final in 2001, whereupon they dropped down to tenth the next year. It took them five more years to return to finals, although they stayed for a long time. They dipped as low as 15th in between.
The second is that Carlton crawled up from consecutive wooden spoons in 2005 and 2006 into the finals in 2009, 2010 and 2011, finishing fifth that last year. Then they plunged to tenth the next season, in 2012, and have never placed in the top eight of their own volition since. They were moved into finals one year to replace Essendon, which was serving a one-year ban for its drug scandal, but I’m not counting that because on the field the Blues placed ninth.
All other things being equal in 2020
So, given all that information, I don’t expect Melbourne to move upwards in 2020.
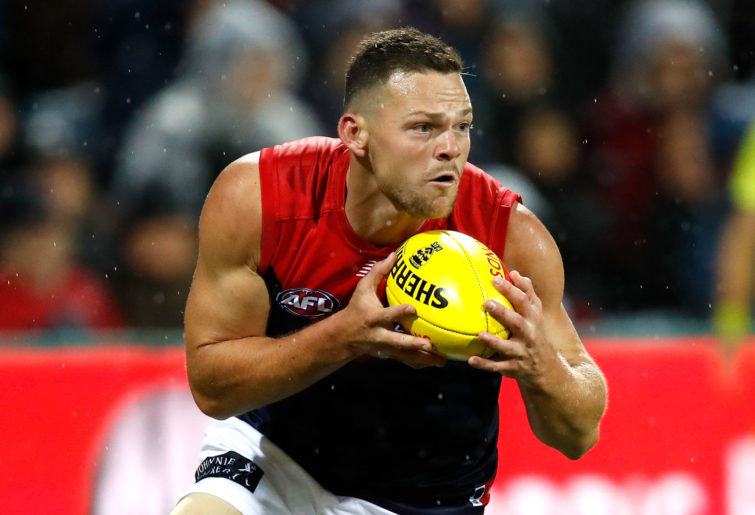
(Dylan Burns/AFL Photos)
3-19, 61per cent
With the exception of that Essendon team that played the 2016 season with half its roster suspended by WADA and then vaulted to eighth place the next year with the entire team back together, no 18th-placed team has ever made it out of the bottom five the following year. To their credit, however, only the original GWS Giants team has ever repeated the wooden spoon from the 18th, or in fact come any lower than 16th. The average finishing spot the following year, ignoring the Essendon debacle, is just below 15th place, and if you insist on including the Dons’ return year, it’s exactly 14th.
All other things being equal in 2020
Gold Coast should move up a few spots in 2020. Let’s give them credit for the 15th, though, and not include that Bombers team in our calculations. I’ve worked hard to try and block out that whole dank episode. (Dank it!)
Before we leave this spot, let’s reverse engineer it: what position is this year’s last-placed team likely to come from? Over the last quarter-century and one, here’s the tally sheet:
Last place repeats: just five times.
One spot up: three times.
Two spots up: six times, the most likely.
Three spots up: just twice.
Four spots up: twice.
Five spots up: three times.
And four times it was a team further away: a tenth, a ninth (Richmond of course), an eighth (Lions) and a fifth (the only team old Carlton knows, back in 1998 following three seasons of finals appearances). So if we have to pick a favourite, it’d be the team in 16th place last year, which was Carlton, which seems unlikely on form but, well, there it is.
The last piece of information to process is that every year when finals forecasts are made the vast majority of people essentially duplicate last year’s ladder with a few trivial changes. This is always a mistake, because no fewer than two teams drop out of finals every single year, and that’s been true every year since the AFL went to six finalists, let alone eight.
So when you draw up your ladder prediction make sure that at least two of your teams are new to finals this season – and it’s actually been three teams for the last three years and eight of the last 11.
All right, it’s time to combine all of this into one final prediction based solely on prior-year placements. Mind you, this isn’t my personal prediction, nor is it part of our ‘meta-forecast’ that I’ll put together the week before the season starts. But that doesn’t mean it’s necessarily wrong.
So this ladder accommodates everything you’ve read over these four articles: the results fit the history at each position, of each team, and includes the amount of movement typically shown every season by the results of the changing performance levels of each team.
It is therefore certain to be completely wrong. Thanks for coming along the journey with me anyway!
Who’s in your ultimate team? Pick the best team and compete with other fans for daily prizes on Draftstars. For the best odds on the game try out Aussie bookmaker PlayUp. Think. Is this a bet you really want to place? Set a deposit limit.