


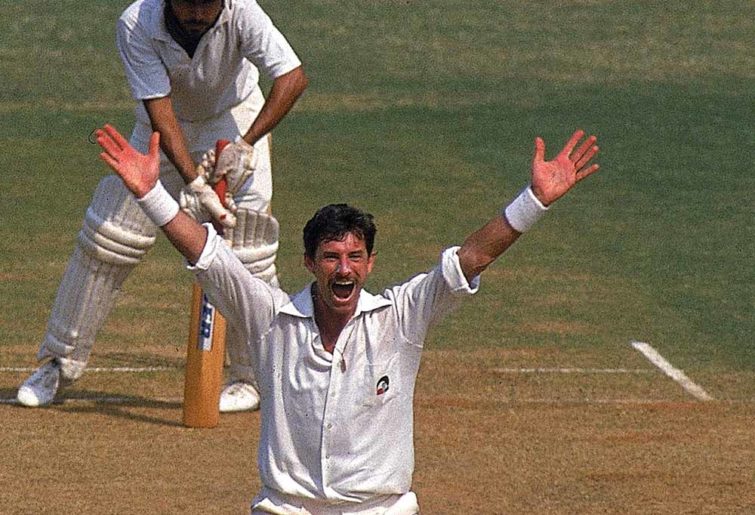
- Video
-
Club Roar
Captured a great grassroots sporting moment? We want to see it!Content Collections
The Roar Community
- Join
- Login
Some recent Roar articles have added new dimensions to fantasy team selections.
I refer in particular of Matth’s series on the best all-time Australian alphabet teams and All Day Roseville’s best calendar Ashes teams, sorted by month of birth.
These efforts have inspired me to to put together a list of place-of-birth fantasy teams to match All Day’s date-of-birth line-ups. It draws on material compiled for an article several months ago on best-ever teams from first-class provinces around the world.
That article sought to rank the best provincial nurseries by calculating a rating for each of their best teams based on career Test averages: the higher the difference between the aggregate batting average and the combined average runs scored against the best bowlers, the higher the ranking. Details of the method are set out at the end of this article.
Using a state of origin basis for selection, this method found that the top five provinces for producing Test cricketers have been New South Wales, KwaZulu Natal, Barbados, Yorkshire and Victoria. Averages aren’t always the best or only way to decide the best all-time XI from each city or province, but they seem a good basis for comparing fantasy teams, so I’ll use it again here.
NSW is a production line of Test cricketers. (AAP Image/Paul Miller)
A ranking of birthplaces might not tell us a lot new, as there is a good deal of overlap between players from the best provinces and those born in their major cities. But it might shed light on some points, such as whether it is the big cities themselves or smaller towns and rural areas that produce the best players.
We might also find that some cities are so big or where youth cricket is so strong that a lot of their talent has to move to other provinces to get an opportunity. We might expect a city like London, which has three or four first-class teams in its territory, to rank higher than those county teams did in the provincial rankings.
While there is a fair degree of correspondence between where players were born and where they grew up, there can be an element of circumstance about some people’s birthplaces that doesn’t have much bearing on a player’s cricketing development. For example, Colin Cowdrey was born in Bangalore, and George Headley was born in Panama.
Today’s article will look at tenth and ninth places on the birthplaces list. Two follow-up articles will count down the fifth to eighth best cities, and finally the top four, along with the province whose rural regions have sired the best cricketers (in the spirit of the old City versus Country football contests in some states).
I’m defining birthplaces in terms of today’s greater metropolitan areas, even if they once have been regarded as separate towns. Examples are Penrith in Sydney, Pudsey in Leeds, or Gawler in Adelaide.
Each best ever team is compiled on the basis of six batsmen (or five plus an all-rounder), one keeper and four bowlers, including at least two quicks and one spinner. The best performed players with 15 or more Tests are listed, but if a city doesn’t have enough players in a particular category meeting this criterion then the next best with fewer Tests are included.
Before listing the top ten it’s worth noting some honourable mentions. In 11th place and well ahead of the trailing pack of cities is Kingston, Jamaica (population 1.2 million), which boasts two Windies all-time greats in Michael Holding and Jeff Dujon, and near greats in Lawrence Rowe, Chris Gayle and left-arm spinner Alf Valentine. Its batting-bowling differential is +46.
(Photo by Mark Kolbe/Getty Images)
While Yorkshire was England’s leading county of origin, its best city – Leeds – only ranked 12th worldwide. Yorkshire’s strength was shared across a number of medium-sized cities like Sheffield (Joe Root), Bradford (Jim Laker), Middlesbrough (Fred Trueman) and Barnsley (Darren Gough). That seems to be true of England’s strength as a whole, with only Manchester outside London managing to put together (just) a full team.
Colombo ranked second highest among Asian teams, just ahead of Mumbai and Karachi, perhaps surprisingly, and on par with Adelaide and Brisbane (the number one Asian city is in the top ten). These five teams had batting-bowling differentials close to zero – i.e. on average the opposition scores the same against your attack as your batsmen accumulate per innings. Colombo has produced some very fine batsmen – notably Mahela Jayawardene, Aravinda de Silva and Angelo Mathews.
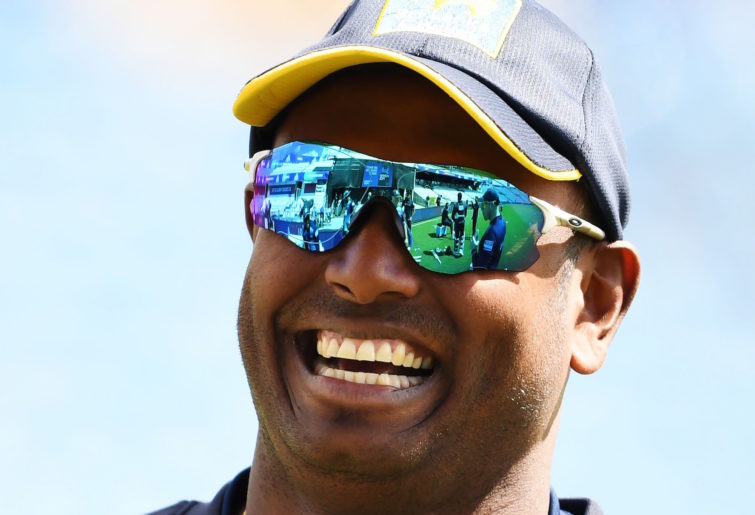
Angelo Mathews. (Dibyangshu Sarkar / AFP / Getty Images)
Mumbai was let down by its bowling, despite having some great batsmen: Sachin Tendulkar, Sunil Gavaskar, Vijay Merchant and England’s Douglas Jardine, born in then Bombay in 1900. Jardine was a real scion of the British Raj: his father was also born in India and held a number of senior legal positions in Bombay.
Chennai, birthplace of former England captain Nasser Hussain and current spin king Ravi Ashwin, pipped Delhi and Karnataka for second city in India, but they were all well behind Mumbai.
Batting-bowling differential: +53
Tom Latham – 52 Tests, 2014-, average 42.2
Henry Nicholls – 33 Tests, 2016-, average 39.7
Stephen Fleming (c) – 111 Tests, 1994-2008, average 40.1
Nathan Astle – 81 Tests, 1996-2006, average 37
Craig McMillan – 55 Tests, 1997-2005, average 38.5
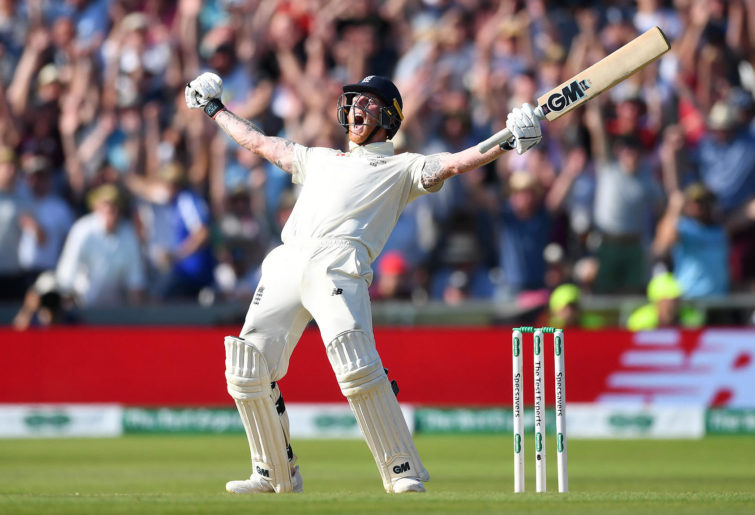
Ben Stokes (England) – 63 Tests, 2013-, batting average 36.5, 147 wickets at 32.7
Richard Hadlee – 86 Tests, 1973-90, batting average 27.2, 431 wickets at 22.3
Lee Germon (wicketkeeper) – 12 Tests, 1995-97, average 21.2
Shane Bond – 18 Tests, 2001-09, 87 wickets at 22.1
Andy Caddick (England) – 62 Tests, 1993-2003, 234 wickets at 29.9
Tom Burtt (left-arm spin) – ten Tests, 1947-53, 33 wickets at 35.5
(Gareth Copley/Getty Images)
Christchurch truly punches above its weight population-wise as a birthplace of top Test cricketers, but wasn’t the top city in this regard, which will be named higher in the list. It’s a pretty impressive output when you consider that Christchurch has about the same number of residents as Canberra, which as far as I can make out only boasts one Test cricketer born there – Michael Bevan.
Two English Test representatives, Stokes and Caddick, help boost Christchurch’s ratings, but it wouldn’t suffer much if they were replaced with New Zealand caps Graham Dowling, Walter Hadlee, Dick Motz or Chris Martin, although none of these have Stokes’ all-round value, which isn’t captured by these ratings.
Stokes’ parents are Kiwis who moved to England when Stokes was 12, while Caddick’s parents were English. He moved to play county cricket in England after representing New Zealand at under-19 level.
The key driver in Christchurch’s ranking is the bowling pair of Hadlee and Bond, who many would rate as the two finest Kiwi pacemen. Bond’s average has a bit of a question mark over it given the smallish sample size of 18 Tests in a career plagued by injury, and because it was boosted by big hauls against some weaker sides. But Bond does boast the best strike among bowlers since 1900 (38.7). He also achieved an outstanding average of 20.9 in 88 ODIs.
There is little question about Hadlee’s place as the greatest Black Cap, and one of the all-time greatest pace bowlers. Apart from his amazing career record, Hadlee was instrumental in several landmark victories for New Zealand, starting with 6-26 in an historic first win over England in 1978 and 11 wickets in the win that led to a shock (and controversial) series victory over the Windies in 1980.
(Simon Bruty /Allsport)
Hadlee later took 33 wickets in three Tests in New Zealand’s only series victory on Australian soil in 1985-86, followed by a maiden series victory in England a few months later, taking ten wickets and scoring 68 in the one result match.
Current Black Caps Tom Latham and Henry Nicholls lead a solid batting order, along with Fleming, New Zealand’s longest-serving and most successful captain. Christchurch rated well ahead of Auckland (differential of minus 22) as the leading New Zealand birthplace. All the New Zealand players listed were also Canterbury stalwarts at provincial level. Very few top Canterbury players were born or grew up outside Christchurch.
Batting-bowling differential: +55
Graeme Smith (c) – 117 Tests, 2002-14, average 48.3
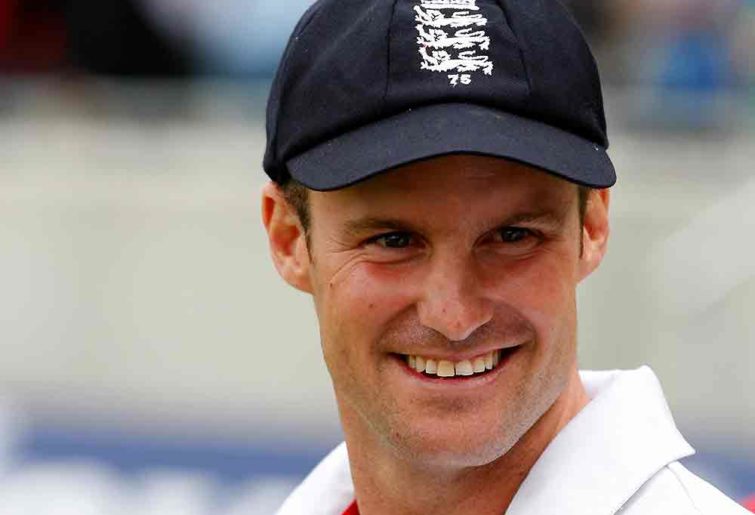
Andrew Strauss (England) – 100 Tests, 2004-12, average 40.9
Eric Rowan – 26 Tests, 1935-51, average 43.7
Bruce Mitchell – 42 Tests, 1929-49, average 48.9
Neil McKenzie – 58 Tests, 2000-09, average 37.4
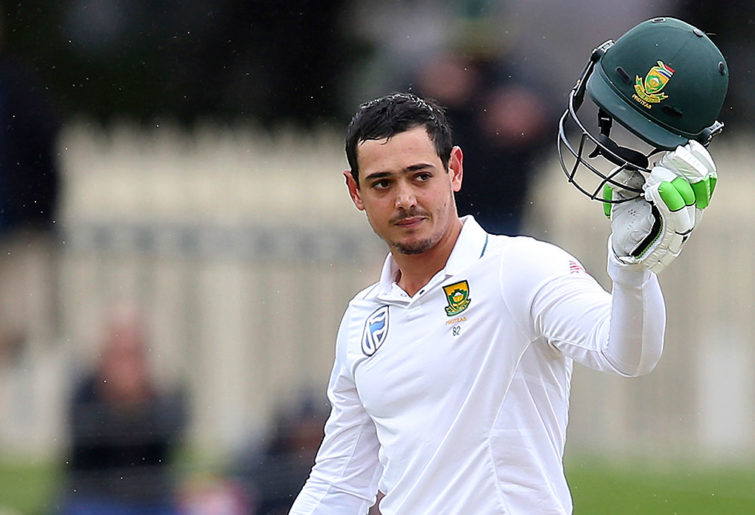
Quinton de Kock – 47 Tests, 2014-, average 39.1
Matt Prior (wicketkeeper) (England) – 79 Tests, 2007-14, average 40.8
Andrew Hall – 21 Tests, 2002-07, batting average 26.2, 45 wickets at 35.9
Cyril Vincent (left-arm orthodox) – 25 Tests, 1927-35, 84 wickets at 31.3
Kagiso Rabada – 43 Tests, 2015-, 197 wickets at 23
Athol Rowan (off spin) – 15 Tests, 1947-51, 54 wickets at 38.6
Jo’burg has a strong batting order, but the bowling is a bit iffy apart from Rabada, who is on track to be one of the greats. They are led by Graeme Smith, the only cricketer in history to captain a Test team 100 times, and to notch up more than 50 victories (53). Prior and de Kock can fight over the gloves, but both make the team on batting alone.
(AP Photo/Rick Rycroft)
Johannesburg didn’t have a lot of depth outside this XI, although locals would undoubtedly want to include their greatest all-rounder Clive Rice, whose career coincided with South Africa’s years of Test isolation. Rice averaged 41 with the bat and took more than 900 wickets at 22.5 for Transvaal and Nottinghamshire between 1970 and 1992.
All the South African players on this team represented Transvaal/Gauteng, although Graeme Smith moved to Cape Town and Western Province before he was selected for South Africa.
Like Christchurch and couple of other South African cities, Jo’burg includes a pair of players who went on to play for other countries – in this case Prior and Strauss, who featured in England’s Ashes triumph in 2010-11.
Strauss – currently England’s director of cricket – has also had strong Australian connections. His family first moved to Melbourne for 18 months when Andrew was six, before settling in England. He later played grade cricket for a few seasons in Adelaide and Sydney, and married an Australian. Prior had an English father and South African mother and moved to England aged 11.
(AP Photo/Tim Hales)
Bruce Mitchell and Eric Rowan were South Africa’s batting stalwarts during the 1930s and ’40s. Mitchell, who played in every one of SA’s Tests between 1929 and 1949, ended up with a fine record, but neither he nor Rowan fared well on Australia’s tour to SA in 1935-36, particularly against Clarrie Grimmett. Rowan was dropped after getting out to Grimmett five times in six innings. Mitchell only passed 50 once in five Tests and two provincial games against Australia. Australia, without Don Bradman, won the series 4-0.
Rowan, a feisty character known for playing without gloves, and reputedly without a box, is the oldest player to score a Test double-century – against England in 1951, aged 42. Off-spinner Athol was his younger brother, whose main claim to fame – apart from escaping from a German POW camp in North Africa – was taking Len Hutton’s wicket 11 times in 15 Tests, all versus England.
The next article in the series will cover the cities in eighth through fifth places.
Calculating the batting-bowling differential
First, take the average runs scored for, tallying the sum of the career Test batting averages of all 11 players.
Then subtract the average runs against, which is the average of the bowling averages of the four (or five) front-line bowlers, multiplied by ten. For example, if each bowler’s average is 25, the average runs conceded per innings is 250.
Build your own fantasy cricket team and put it to the test with Draftstars daily fantasy competitions. Pick your match, pick your team and watch the points roll in to take out cash prizes on each match. What are you really gambling with? Set a deposit limit.