


- Video
-
Club Roar
Captured a great grassroots sporting moment? We want to see it!Content Collections
The Roar Community
- Join
- Login
Opinion
In this final article on cricketing birthplaces, I’m going to baulk at ranking the top two cities using my average-based ratings scheme and tentatively award equal first place to Durban and Sydney.
Applying the strict qualifying rules applied in this series (a minimum of 15 Tests post 1920), Sydney would take first place. However, if they were bent to include two of South Africa’s greatest players, whose careers were cut short by isolation in the apartheid years, there is a strong case for Durban.
As my ratings system is no more than a good starting point for discussion, I’ll let Roarers come to their own conclusion on the top city – putting aside all pro- and anti-Sydney biases, naturally! Batting averages below are rounded.
Equal first: Durban (population 3.8 million)
Barry Richards – four Tests (1970), average 73 or Lance Klusener – 49 Tests (1996-2004), average 33; 80 wickets at 37.9
Herbie Taylor (c) – 42 Tests (1912-32), average 42
Hashim Amla – 124 Tests (2004-19), average 47
Graeme Pollock – 23 Tests (1963-70), average 61
Dudley Nourse – 34 Tests (1935-51), average 54
Robin Smith (England) – 62 Tests (1988-96), average 44
BJ Watling (New Zealand) (wicketkeeper) – 70 Tests (2009-), average 39
Trevor Goddard – 41 Tests (1955-70), average 35; 123 wickets at 26.2
Mike Procter – seven Tests (1967-70), average 25; 41 wickets at 15 or Keshav Maharaj – 30 Tests (2016-), 100 wickets at 28.4
Shaun Pollock – 108 Tests (1995-2008), average 32; 421 wickets at 23.1
Hugh Tayfield – 37 Tests (1959-60), 170 wickets at 25.9
Reserves: Eric Dalton, Dave Nourse, Andile Phehlukwayo, Richard Snell.
Batting-bowling differential
With Richards’ and Procter’s actual averages: +241
With human averages for Richards (50) and Procter (25): +194
With Klusener and Maharaj: +156
The key question is whether I include Barry Richards and Mike Procter for purposes of comparison, and if so, how do I rate them?
It seems unfair to begrudge Durban these two homegrown products, who are among the five or six greatest cricketers to represent South Africa, despite playing only a handful of Tests prior to its post-1970 isolation.
The pair had few peers in English county cricket in the 1970s, when there were a lot of great internationals around. Richards ended with a first-class average of 55, while Procter took over 1400 wickets at 19.5 over 20-plus years. Procter also averaged 36 with the bat and scored 48 first-class centuries, including six in consecutive innings (one of only three batsmen in history to do so). He bowled very fast, often with prodigious in-swing, occasionally changing to off spin with some success.
In the World Series Cricket Super Tests in the late ‘70s, Richards (79) and Procter (16) headed the batting and bowling averages respectively, playing against most of the West Indies’ and Australia’s best players. Procter’s 42 wickets at 15 in seven Tests ten years earlier were taken in two big series wins against Australia when he was aged 20 to 23.
He and Richards led the bowling and batting averages respectively in the 1969-70 4-0 demolition (with the great Graeme Pollock close behind in the batting). The following year, playing for South Australia in the Sheffield Shield, Richards scored 325 runs in a single day against a WA attack featuring Dennis Lillee, Graham McKenzie and Tony Lock.
Mark Nicholas’ recent portrait of Procter captures something of his greatness. One highlight: four wickets in five balls, including Barry Richards and Gordon Greenidge, in a spell of 6-13 in a one-day English cup semi-final.
If I discard Richards’ and Procter’s hefty but probably unrealistic Test averages, and assign them relatively conservative proxy figures (say 50 for Richards and 25 for Procter), Durban still leads Sydney by a fair margin.
A large reason is the strength of Durban’s lower order: Trevor Goddard, Procter, Shaun Pollock and New Zealander BJ Watling can all claim Test/first-class records better than or equal to Sydney’s number seven, Richie Benaud.
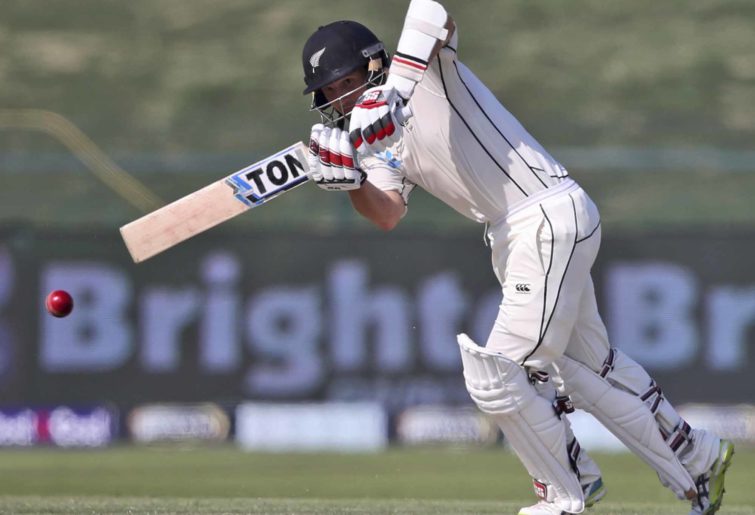
BJ Watling. (AP Photo/Kamran Jebreili)
Left-handed Trevor Goddard is perhaps the most genuine all-rounder of all time: he opened the batting while bowling first change at the most miserly economy rate in Test history (1.64 runs per over). He topped South Africa’s bowling in their 3-1 victory over Bob Simpson’s men in 1966-67, having captained South Africa in a drawn five-Test series in Australia three years earlier, averaging 65 with the bat.
Were I to abide strictly by the original criteria and exclude Richards and Procter, Goddard opens the batting, Lance Klusener and Keshav Maharaj come into the side, and the differential rating drops below both Melbourne and Sydney to +156.
In addition to Richards and Pollock, Durban produced three other batting giants in Herbie Taylor, Dudley Nourse and Hashim Amla, as well as Hugh Tayfield, arguably the second greatest ever off spinner after Jim Laker.
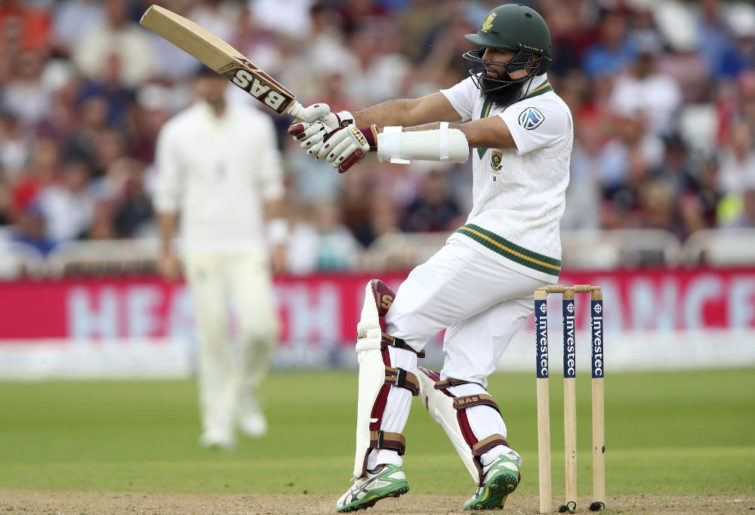
Hashim Amla. (Nick Potts/PA via AP)
Tayfield was another bowling miser with an economy rate under two per over. He claimed 30 wickets to help South Africa draw the 1952-53 series, 13 of them in the Melbourne Test, which saw South Africa’s first win over Australia in 42 years. At home in 1956-57, he took 37 wickets at 17 against a strong England side (Laker only took 11 wickets in that series). For comparison, Nathan Lyon’s best series haul is 23.
Opener and captain Herbie Taylor’s numbers don’t jump out from the page, but he started before the First World War and carried his team’s batting in the 1920s, including 582 runs in a 1922-23 series against England, then a record for a Test captain. An even greater feat was to average over 50 in the 1913-14 series in which Sydney Barnes took a record 49 wickets at 10.9. English players said they had never seen finer batting against Barnes.
Dudley Nourse was Taylor’s successor as South Africa’s batting linchpin in the ‘30s and ‘40s and also captained in 15 Tests. He sits just behind Jacques Kallis and Greg Chappell and ahead of Sachin Tendulkar and Virat Kohli on the all-time list of Test averages. His father Dave, who also played Test cricket, named him after the Governor-General of Australia, the Earl of Dudley, because Dudley was born just after Dave scored a double century in a tour match in Adelaide in 1910.
Durban has a significantly smaller population than either Johannesburg or Cape Town. The role of the city and the KwaZulu Natal province in producing the country’s finest cricketers is likely due to it being colonised mainly by British settlers rather than Afrikaners. Cricket for a long time was dominated by South Africans of British descent, with relatively few Afrikaners and of course no non-whites in the national side before 1992.
Natal’s second city and provincial capital, Pietermaritzburg, has also punched above its weight as a cricketing birthplace, claiming at least 11 Test players, including Kevin Pietersen, Jonty Rhodes, Peter Pollock, Peter Kirsten and 1950s stalwarts Jackie McGlew and Roy McLean.
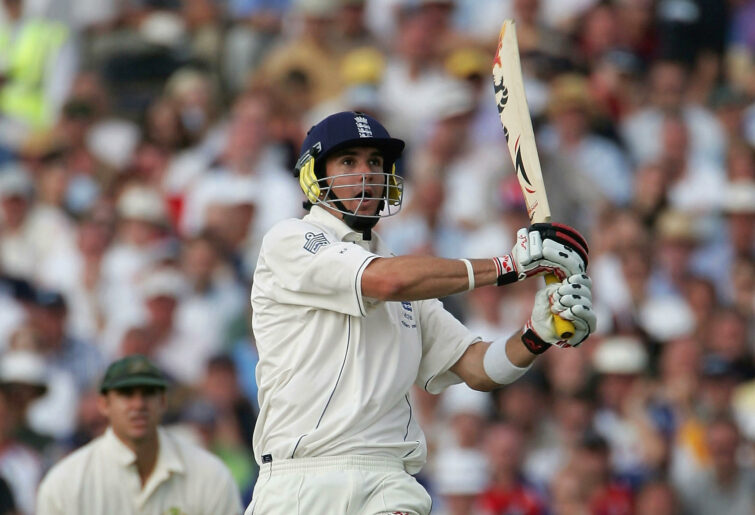
Kevin Pietersen. (Photo by Tom Shaw/Getty Images)
Nine of the Durban team, including England representative Robin Smith, debuted at first-class level for Natal. The exceptions are Graeme Pollock, who grew up in Port Elizabeth and represented Eastern Province along with his fast bowling brother Peter (Shaun’s dad), and BJ Watling, who left Durban aged ten.
Durban’s reserves are generally pretty thin, particularly in pace bowling. This is a big contrast with Sydney.
Equal first: Sydney (population 5.3 million)
Bob Simpson – 62 Tests (1957-78), average 47; 71 wickets
David Warner – 84 Tests (2011-), average 49
Michael Clarke – 115 Tests (2004-15), average 49
Steve Smith – 73 Tests (2010-), average 63
Allan Border – 156 Tests (1978-94), average 51
Steve Waugh – 168 Tests (1985-2004), average 51; 92 wickets
Richie Benaud (captain) – 63 Tests (1952-64), average 24; 248 wickets at 27
Bert Oldfield (wicketkeeper) – 54 Tests (1920-37), average 23
Ray Lindwall – 61 Tests (1946-60), 228 wickets at 23
Pat Cummins – 30 Tests (2011-), 143 wickets at 21.8
Mitchell Starc – 57 Tests (2011-), 244 wickets at 27 or Jeff Thomson (1972-85), 200 wickets at 28
Second XI
Arthur Morris, Herbie Collins, Norm O’Neill, Mark Waugh, Jack Fingleton, Jack Gregory, Greg Dyer, Thomson/Starc, Stuart Clark, Jason Gillespie, Ashley Mallett.
Reserves (including some pre-1914 greats): Victor Trumper, Sid Barnes, Chris Rogers, Charlie Kelleway, Alan Kippax, Monty Noble, Ron Saggers, Arthur Mailey, Tibby Cotter, Fred Spofforth, Gubby Allen (England).
Batting-bowling differential: + 171
The Sydney-born team needs little introduction. It includes five of Australia’s top 11 run-scorers (and a sixth in the second XI, Mark Waugh) and two ICC Hall of Fame bowlers (Benaud and Lindwall). All grew up in Sydney and launched their careers from Sydney grade cricket.
Simpson, Waugh and Border are also in the Hall of Fame, along with Arthur Morris (in the second XI on averages, but many would select in the first team) and Victor Trumper, from pre-1914 (not included in the comparison).
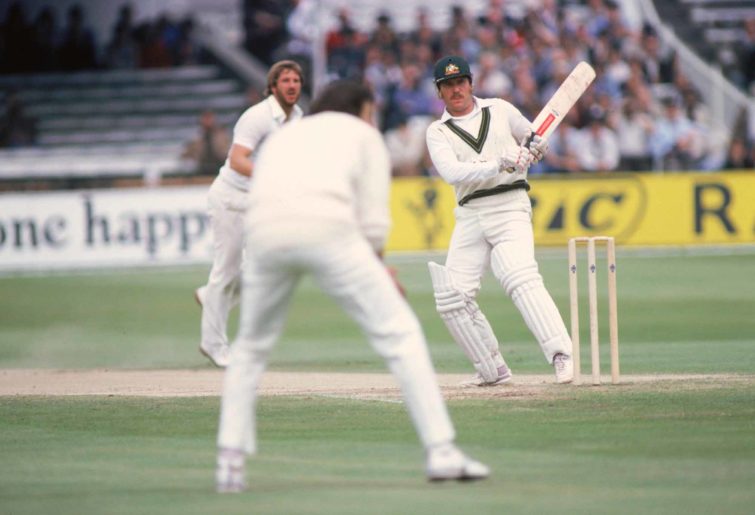
Allan Border. (Photo by Adrian Murrell/Getty Images)
Sydney is well ahead of all other city selections in total number of Tests caps. While Bert Oldfield played a modest number of games by today’s standards, he might have broken all appearance records for keepers if his 17-year career had been more recent. He still holds the Test record for career stumpings (52), including four in one innings against England in 1925.
Many would opt for Jeff Thomson over Mitchell Starc in the best Sydney-born team, bearing in mind Thomson’s dynamic peak before damaging his shoulder. Starc’s inclusion maximises Sydney’s bowling and batting differential, but Thomson’s bowling average at Starc’s age today was lower (25.6).
Sydney’s top order looks the equal of Durban’s, even with Richards in the team. The spinners more or less balance each other, but an attack of Lindwall, Cummins and Thomson might just shade Procter, Pollock and Goddard. That might depend on how good you think Procter was, or might have become.
(Gareth Copley/Getty Images)
Perhaps Durban’s outstanding lower order batting gives it the upper hand? But it lacks the fifth bowler back-up Sydney possesses in Waugh, Simpson or Border. On the other hand, Durban would still match up well if I batted Watling or Goddard at six and included Klusener or Maharaj as a fifth bowler.
Sydney’s case for number one breeding ground is boosted by the depth of its reserves. The Sydney second XI listed above scores a differential of +127, which would put it in fifth place on these rankings, just ahead of Lahore! Even if I took out Gillespie and Mallett, who moved interstate when children, Sydney’s seconds would still claim sixth spot.
Conclusion
This review of cricketers’ birthplaces revealed that a high proportion of the best Test players – 80 to 90 per cent – grew up and learnt the game of cricket in their city of birth, so this comparison seems to give a fairly good picture of the best breeding grounds. Here is the final top ten on my rankings, showing the batting-bowling differential per innings, leaving top place open for debate.
1. Durban +194 (with Richards and Pollock) or +156
1. Sydney +171
3. Melbourne +165
4. Bridgetown +155
5. Lahore +125
6. Cape Town +105
7. Perth +77
8. London +76
9. Johannesburg +55
10. Christchurch +53
I plan to do a follow-up article looking at some states and provinces with strong country and regional representation that rival or even surpass some of their city-born counterparts, as in the case of NSW Country.
Build your own fantasy cricket team and put it to the test with Draftstars daily fantasy competitions. Pick your match, pick your team and watch the points roll in to take out cash prizes on each match. What are you really gambling with? Set a deposit limit.