Controversy as Villa keeper handed second yellow for shootout crowd taunting... but isn't sent off
Emi Martinez was saved by a new rule that resets yellow cards at the end of extra time, meaning his second yellow for taunting…
Opinion

In my previous article I took a look at crossing in the A-League.
This article is Part 2 of my crossing analysis, and it breaks down crossing more to answer a few of the questions that popped up, including game state, home versus away, crossing effectiveness stats and player positions.
How does game state affect crossing?
Game state refers to the situation of the game – whether a team is winning, drawing or losing. Teams change how they play based on the state of the game.
This visualisation shows how crossing is affected by game state across each team in the A-League.
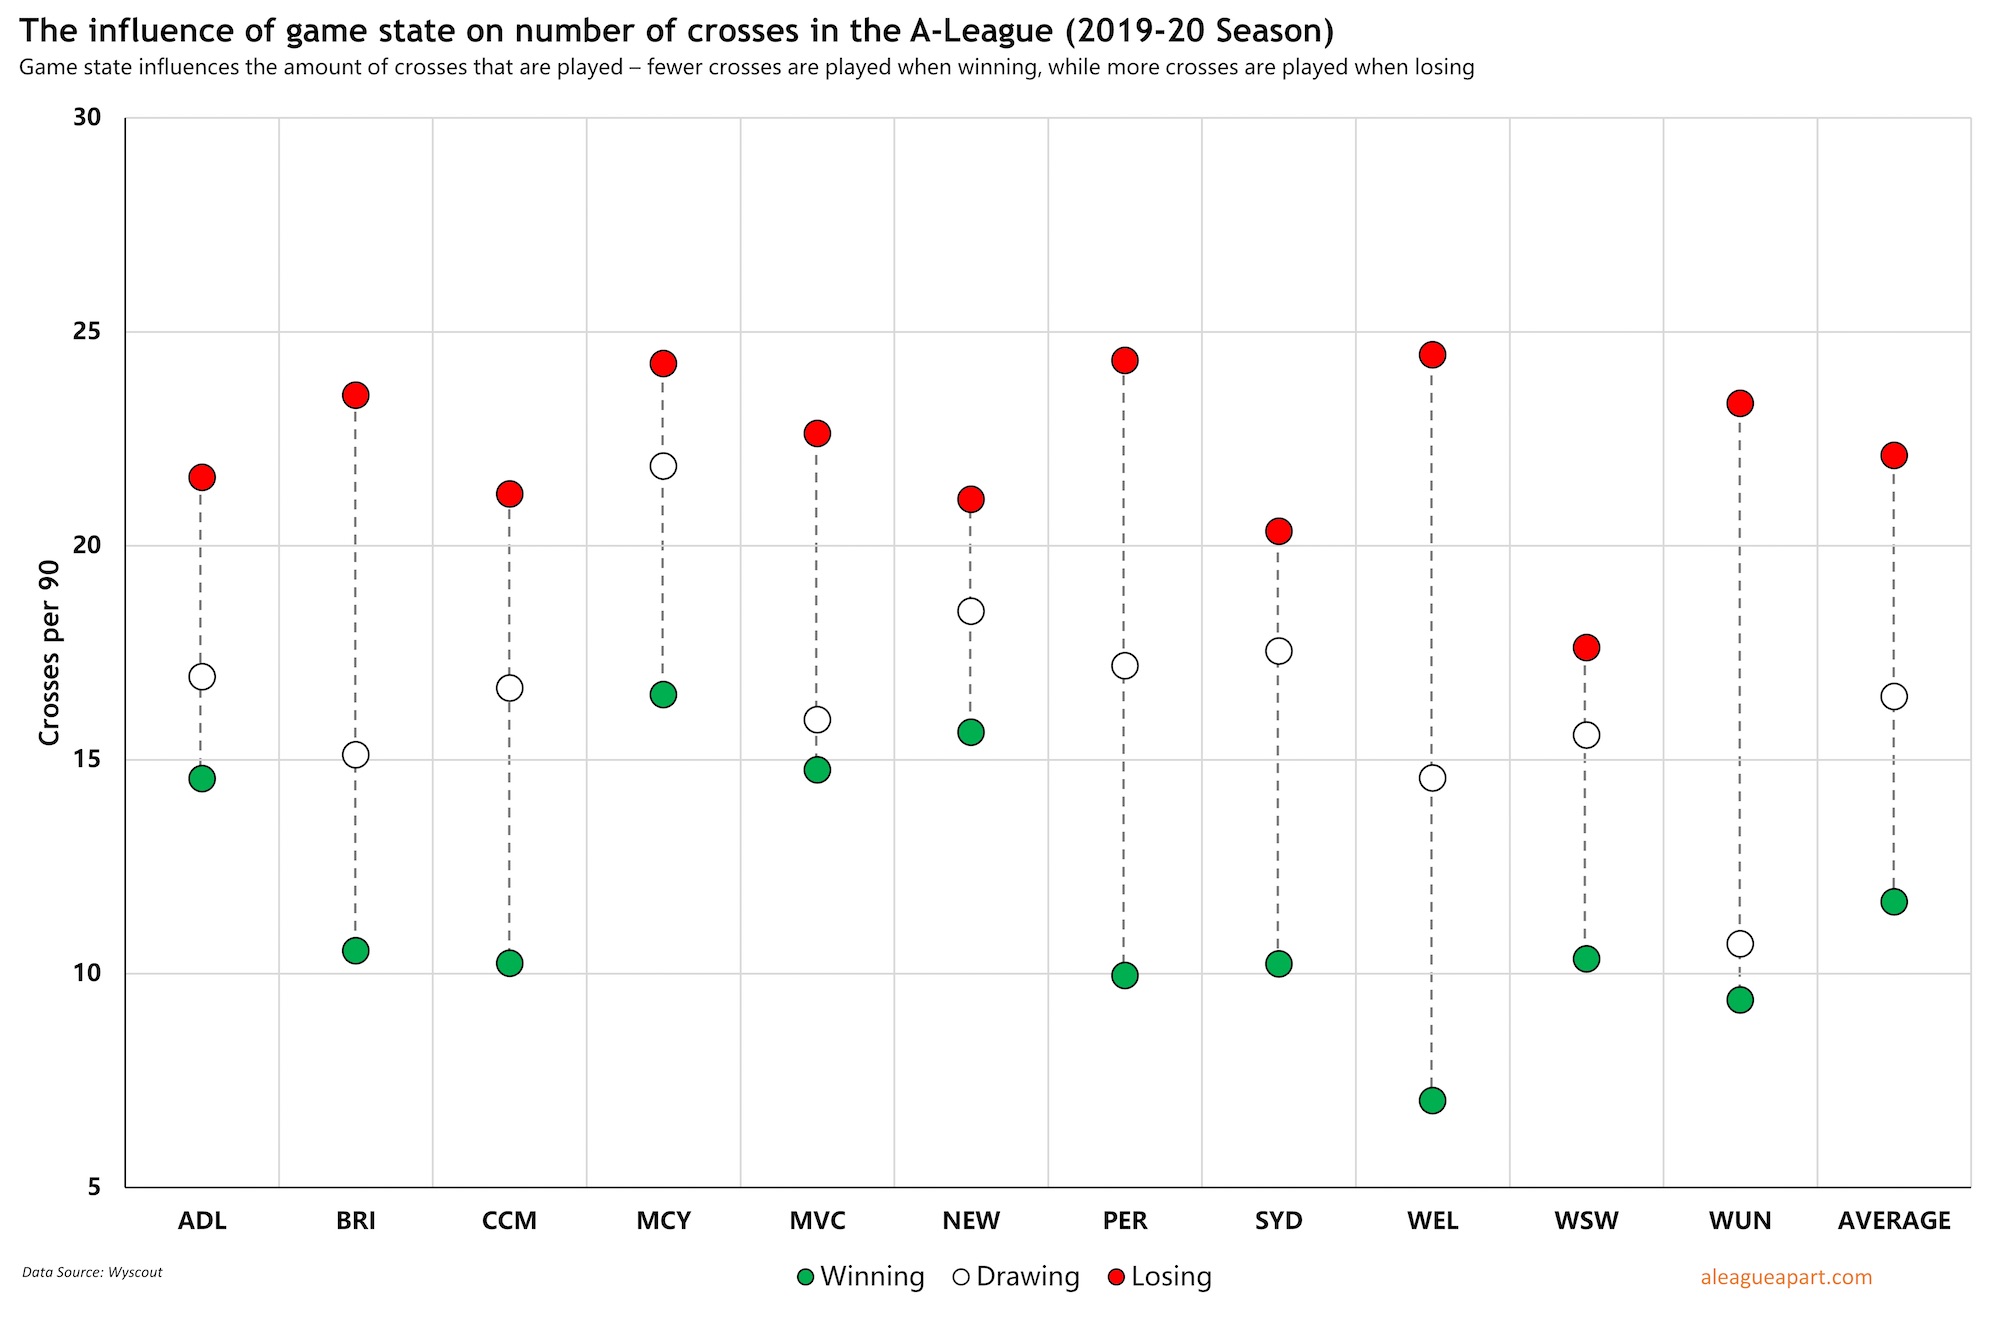
As shown in the visualisation above, teams attempt more crosses when chasing a game, and cross less when they are ahead. This is due to the effectiveness of crossing as a tool to both keep possession, as well as score goals – more on this later.
Additionally, when a team is ahead, they are likely to sit further back and defend more passively, inviting their opposition forward to play crosses.
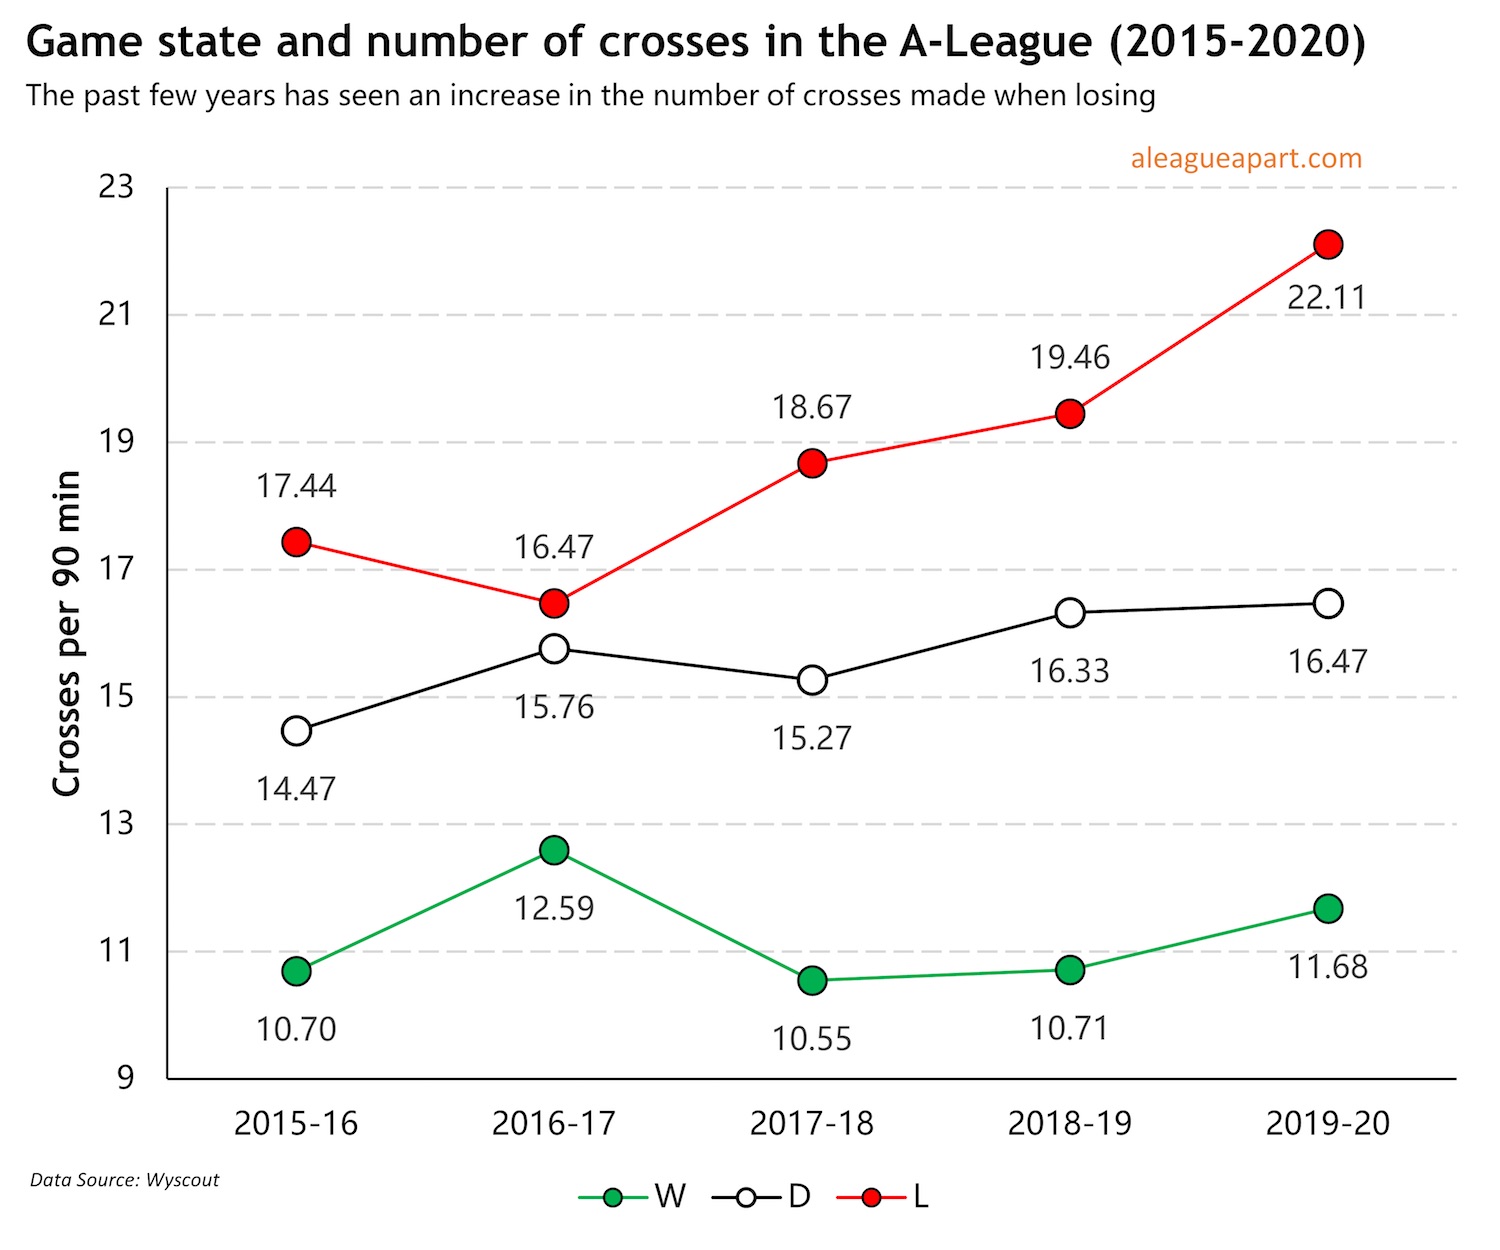
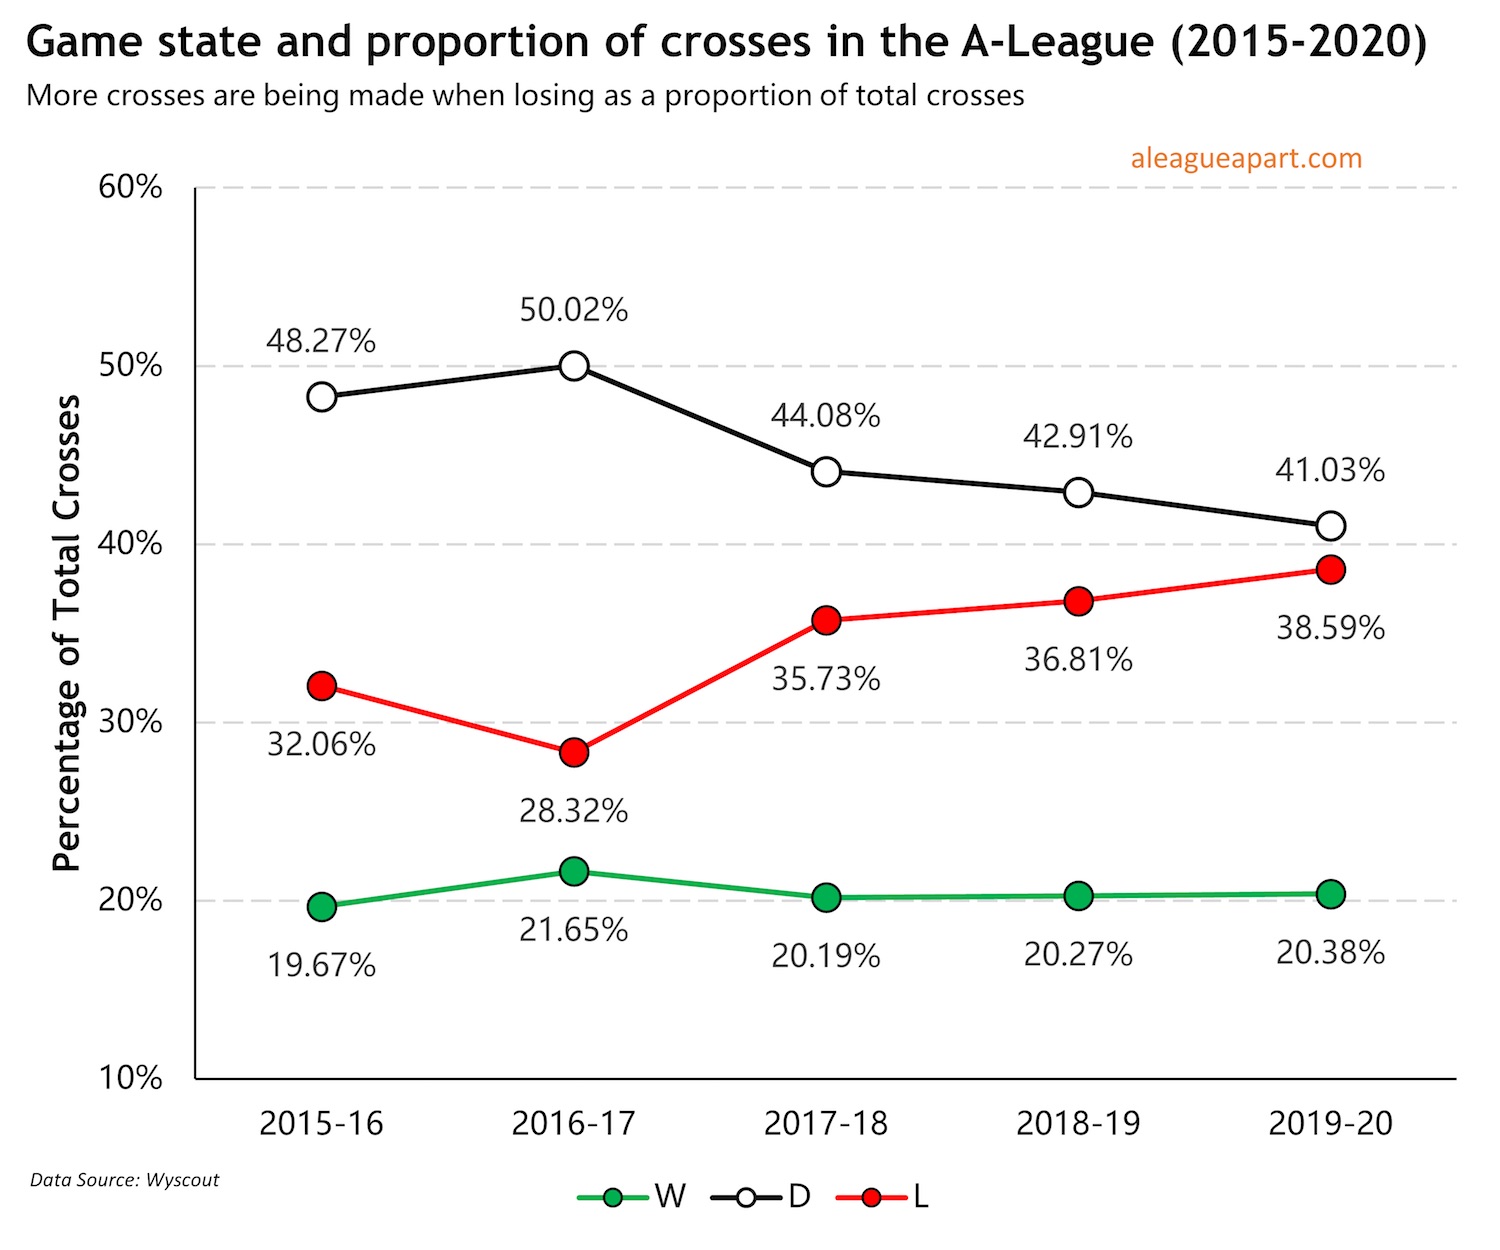
A trend analysis over the past five seasons shows that teams have increased their use of crossing as a way to attack when losing – both in terms of number of crosses…
… and also in terms of proportions of total crosses.
How does crossing behaviour change when a team is home versus away?
Teams generally cross more when they are home than when they are away.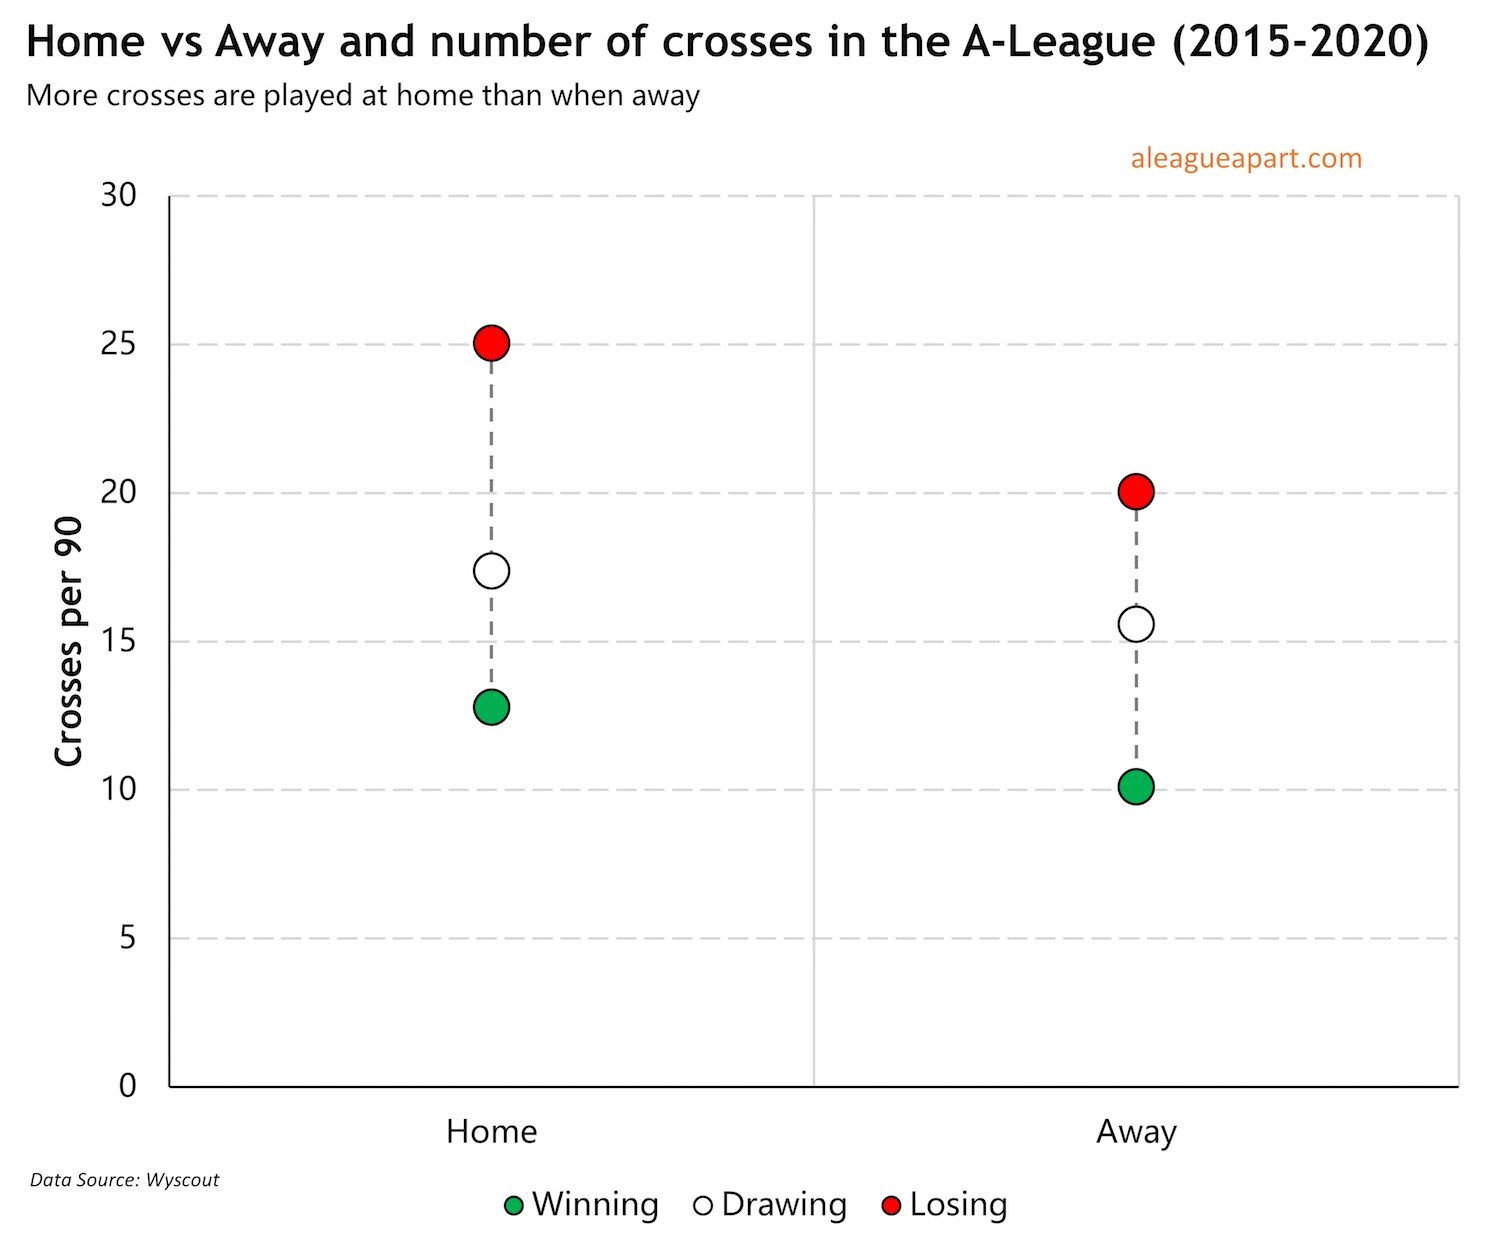
Overlaying both game state and home versus away data gives the following visualisation.
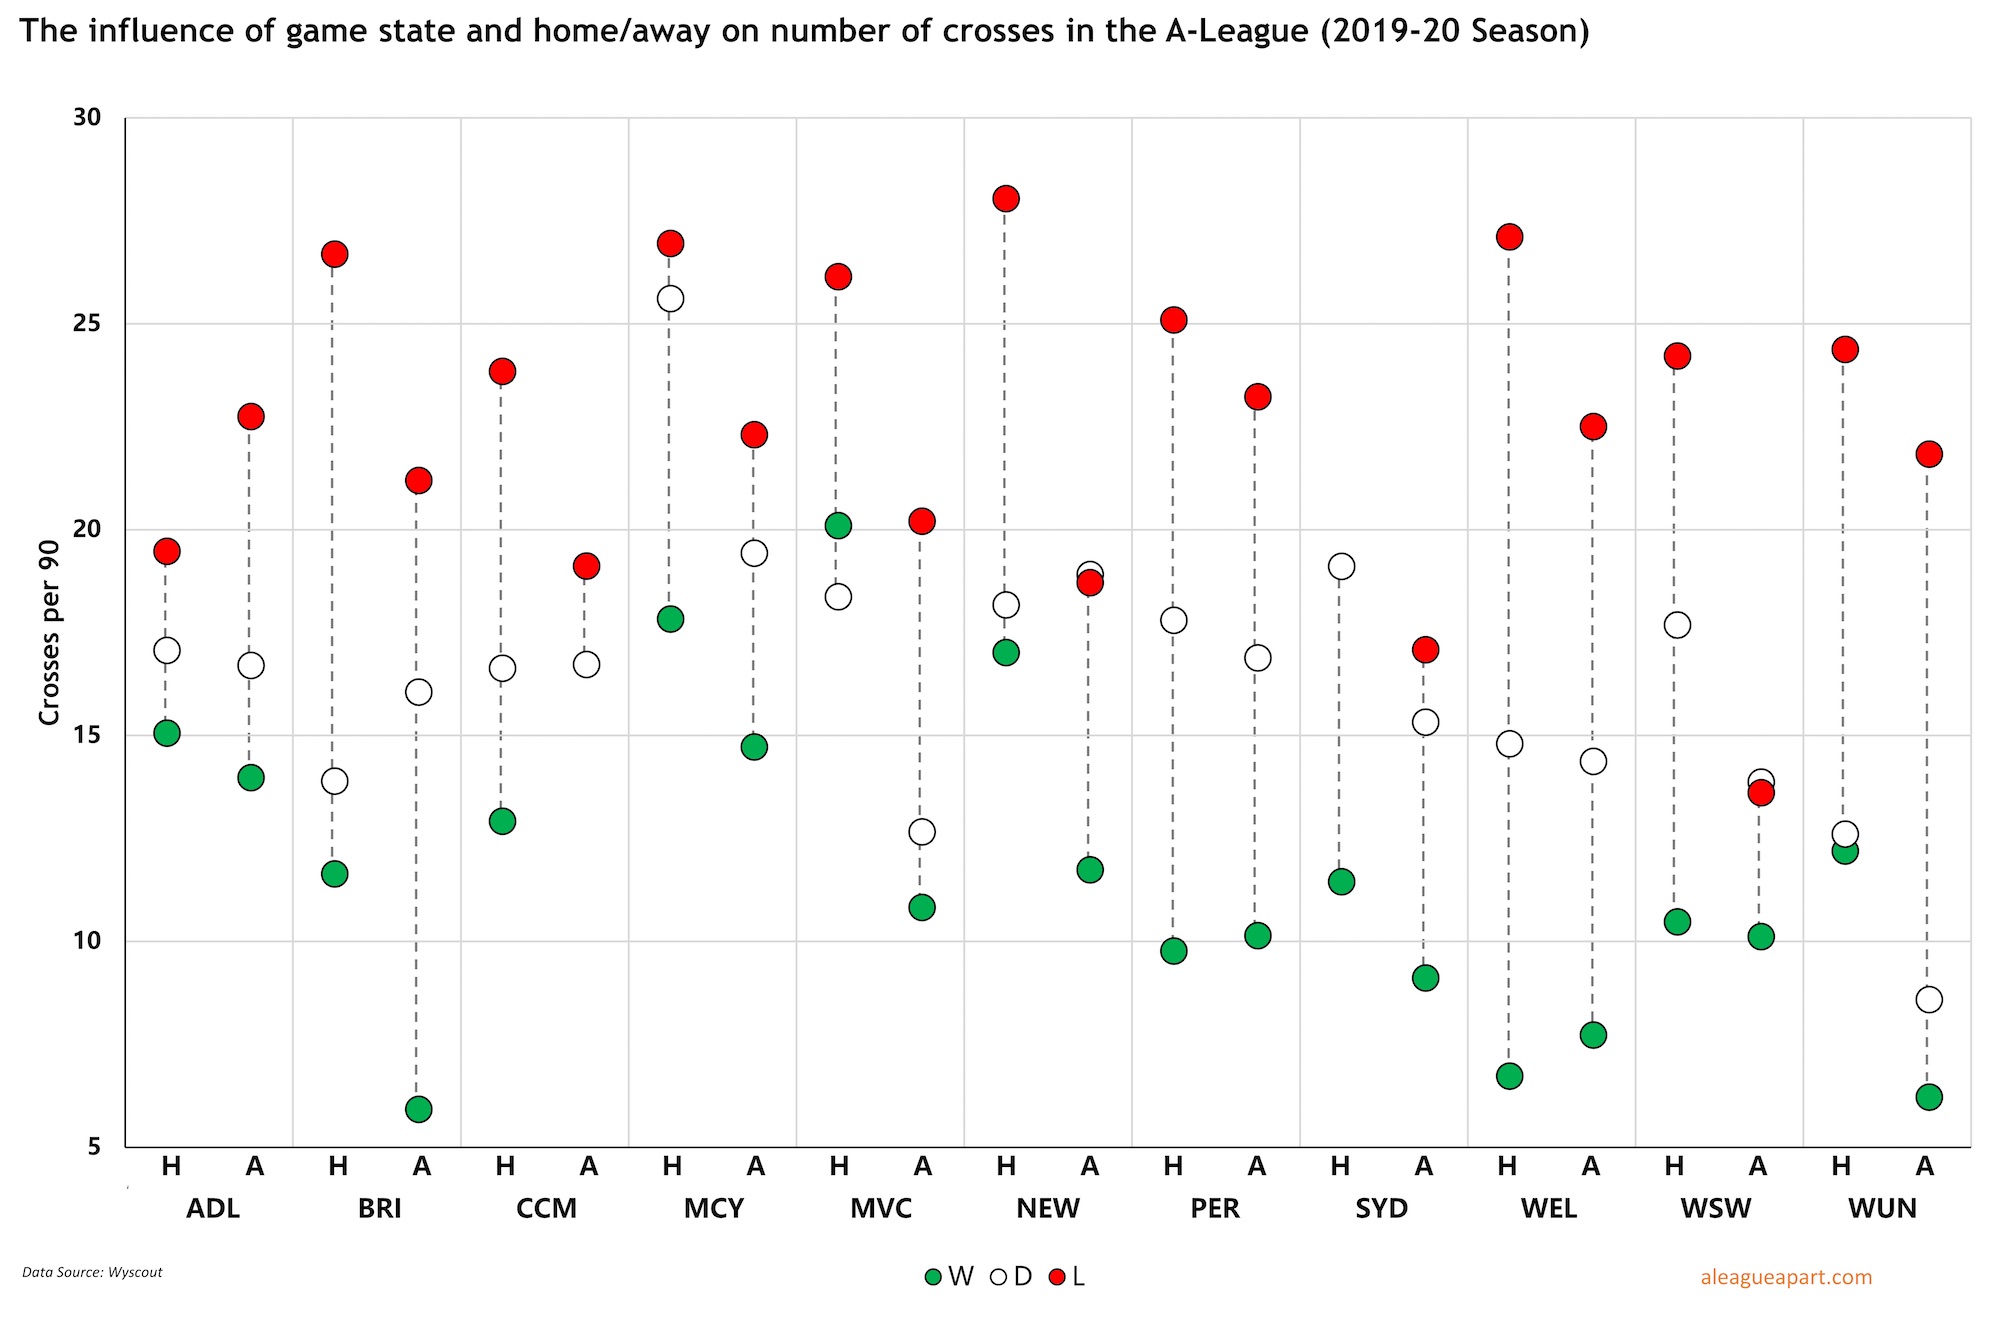
In general, crossing is higher when home than away, and also when losing than when winning.
What is crossing’s effectiveness in the A-League?
Crossing has been well documented to be quite ineffective – previous analysis has suggested that 1.2 per cent of crosses directly result in goals. So how are we tracking in the A-League?
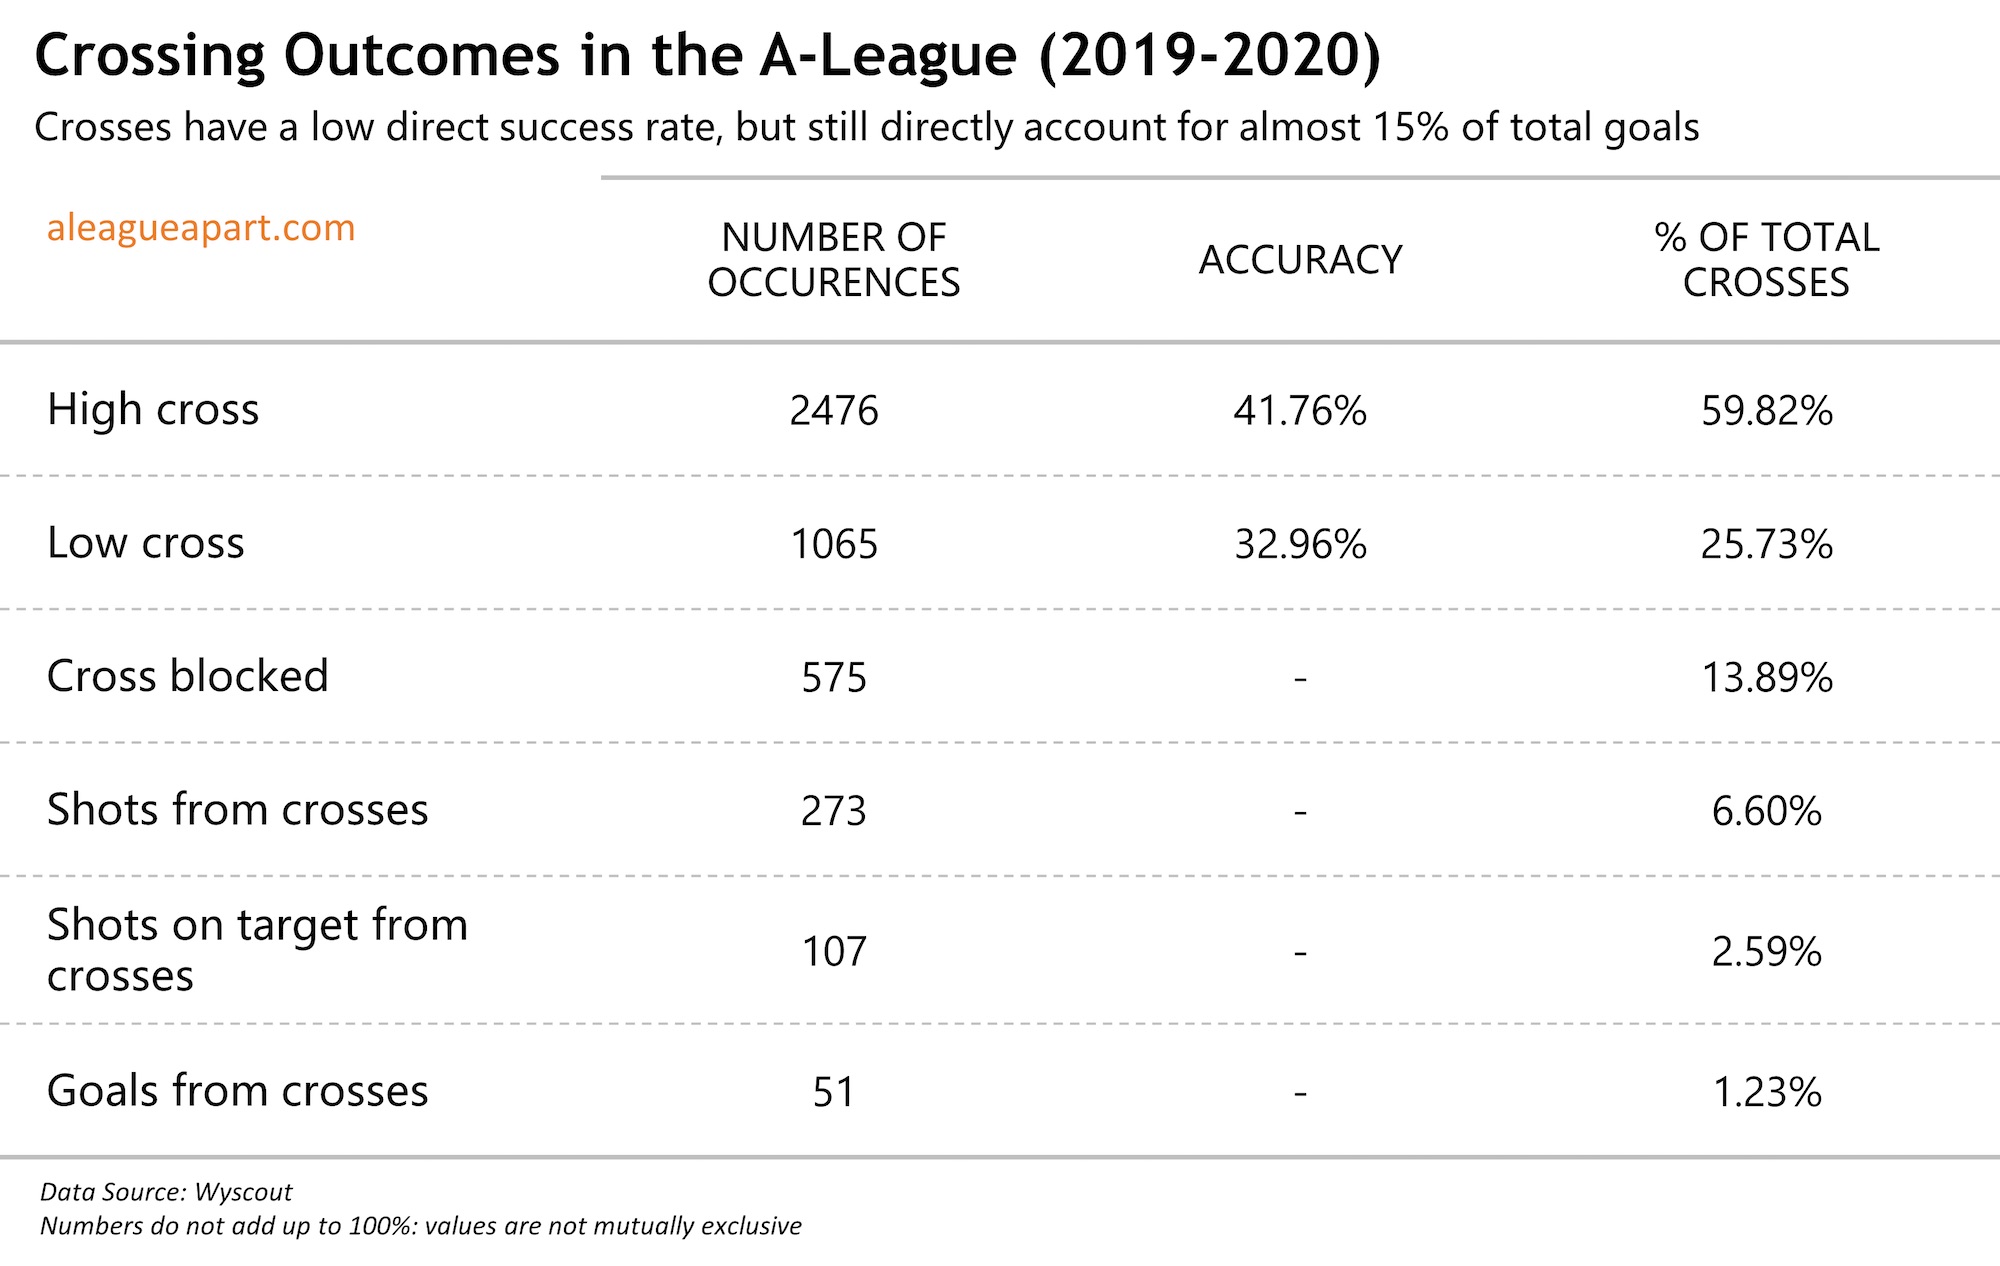
We’re right on the money – 1.23 per cent of crosses result in goals. This suggests that approximately one in every 81 crosses directly results in a goal. Two things to note on this.
One is that while crosses may not necessarily directly result in a goal, the crossing being played in can often cause confusion in the box, which in turn can result in a goal. Unfortunately I wasn’t able to source data in relation to this.
The other is that 51 goals represent 14.8 per cent (more than one sixth) of all goals scored in the A-League this season (344), which is definitely a significant source of goals.
Who is crossing the ball?
Surprisingly (or not surprisingly), fullbacks and wing backs attempt the most crosses.
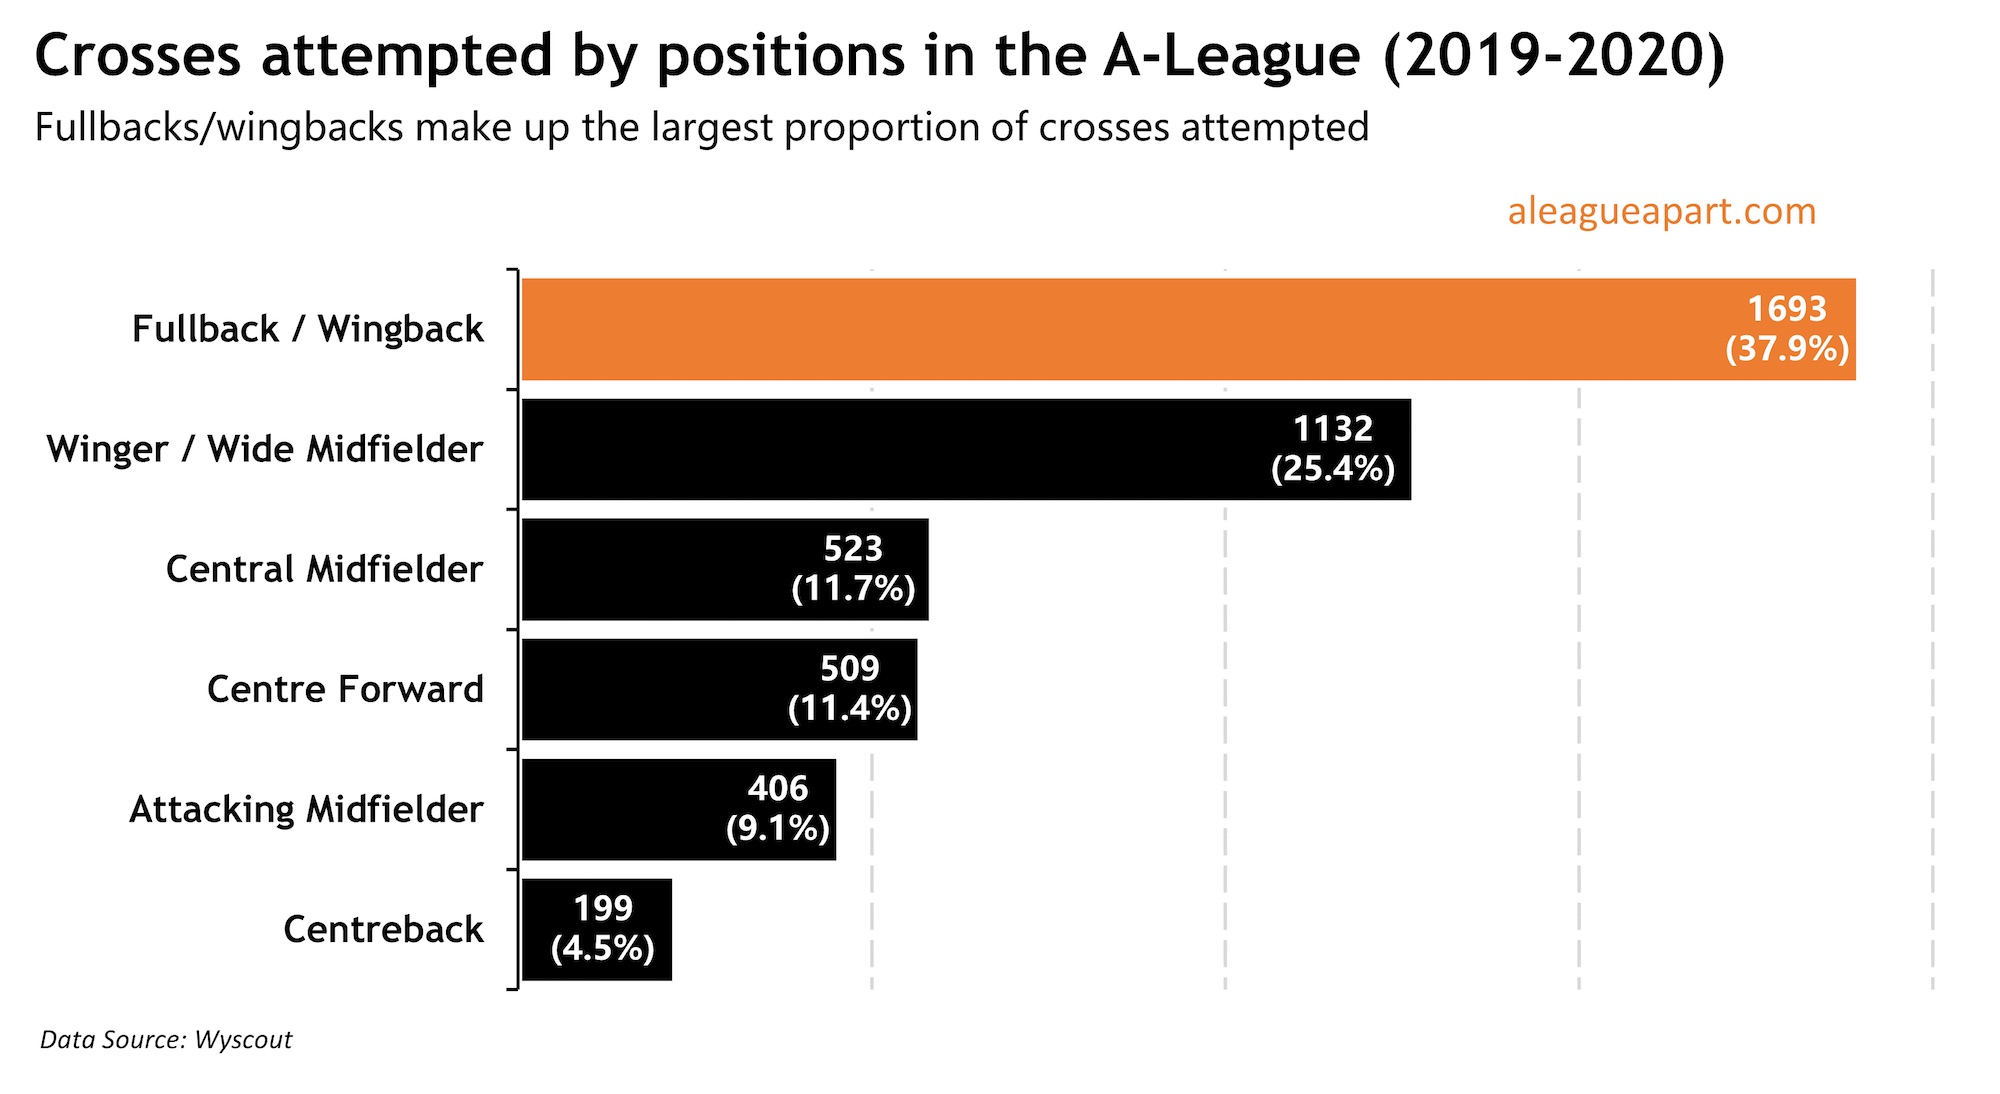
With the right data, it might be interesting to track trends to see how this has changed over previous years.
Are you the ultimate team manager? Pick your own superstar team and go head to head with other football fans for glory and cash prizes on Draftstars. Imagine what you could be buying instead. Set a deposit limit.
Emi Martinez was saved by a new rule that resets yellow cards at the end of extra time, meaning his second yellow for taunting…

This season the top five leagues rankings of European football have been flipped on its head, as new competition heavyweights emerge. Just look at…


In all likelihood, just sixth spot remains up for grabs as we approach the final three rounds of A-League action in season 2023/24 and…

Not only did Erling Haaland's header hit the bar, but Bernardo Silva missed the rebound tap-in that came off his knee. Manchester City went…
After Manchester City saved Luka Modric's shot, the person in the stands didn't return the ball, holding up the penalty shootout for almost a…
Bayern Munich scored the only goal to defeat Arsenal 1-nil and progress to the semifinals. Former player Martin Keown says it's disappointing his former…