
Young excellence, promotion battles, and a happy farewell: The Australian team of the week from players around the globe
Even though St.Pauli ultimately lost a high-scoring affair, Jackson Irvine was a standout, as well as scoring a late goal.

Opinion

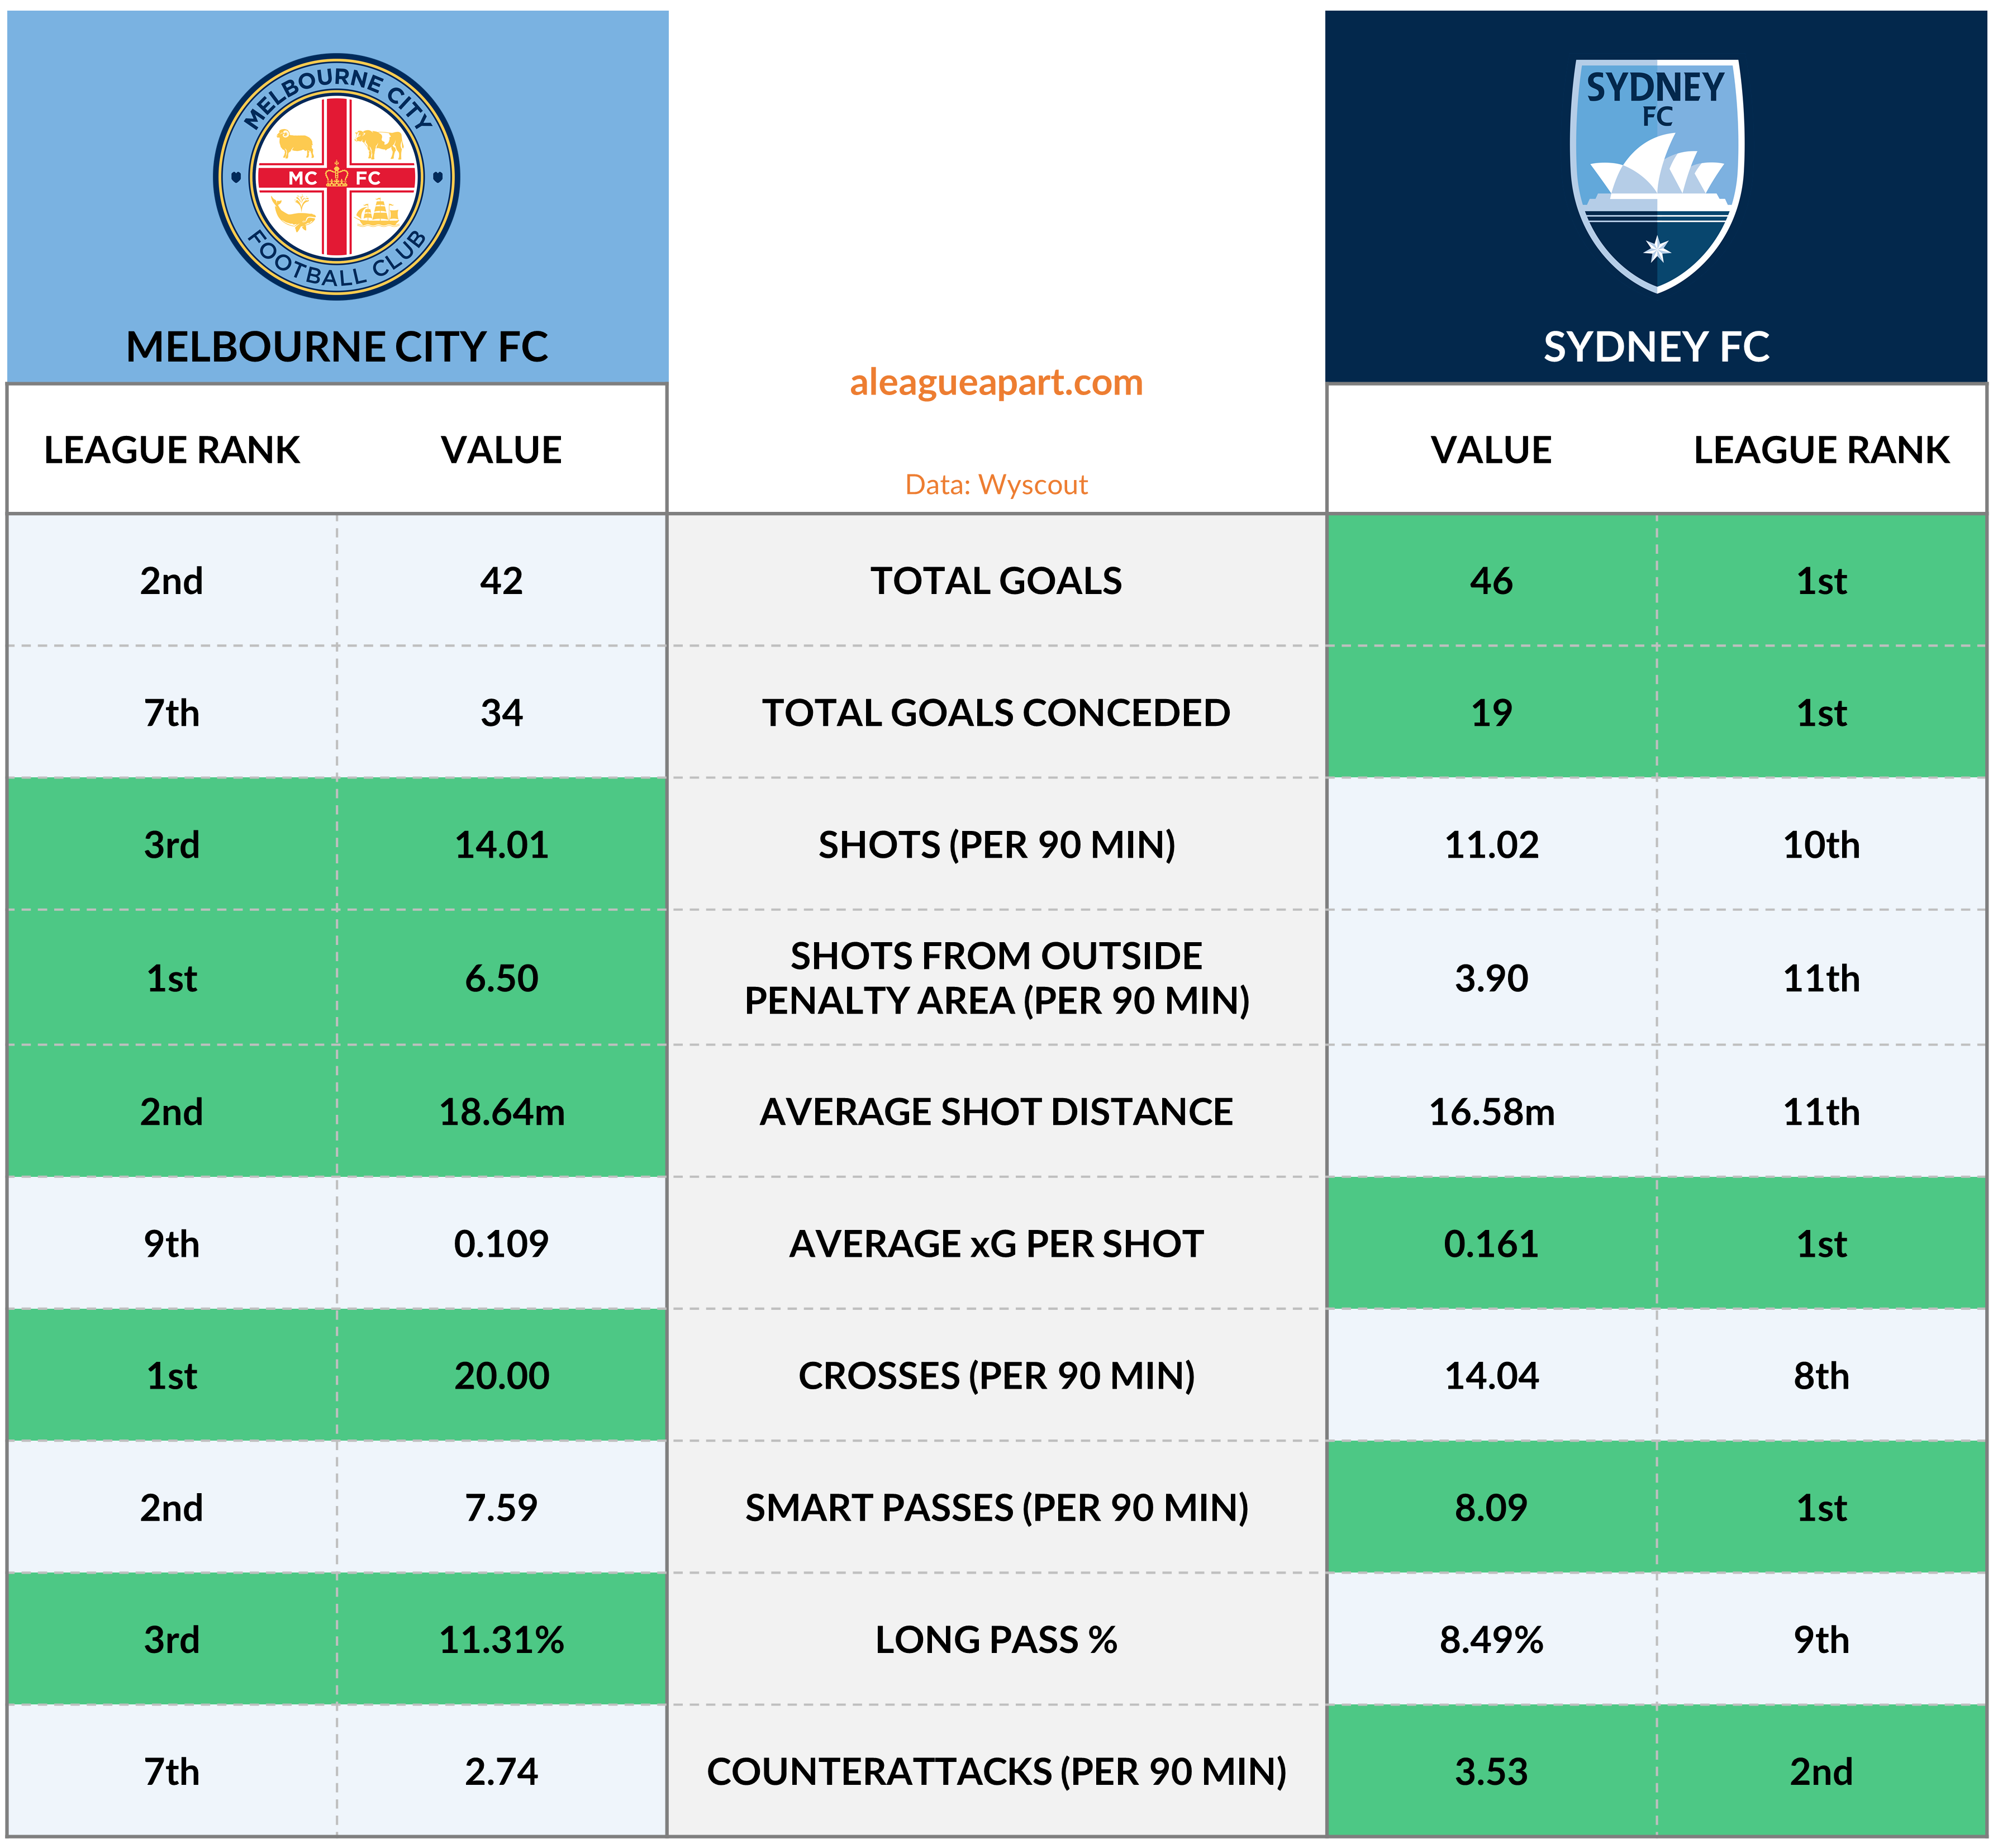
I’ve been playing around with data this week, so rather than a standard preview for Melbourne City versus Sydney FC, I’ve looked at some of the data behind each of the teams and created some data visualisations.
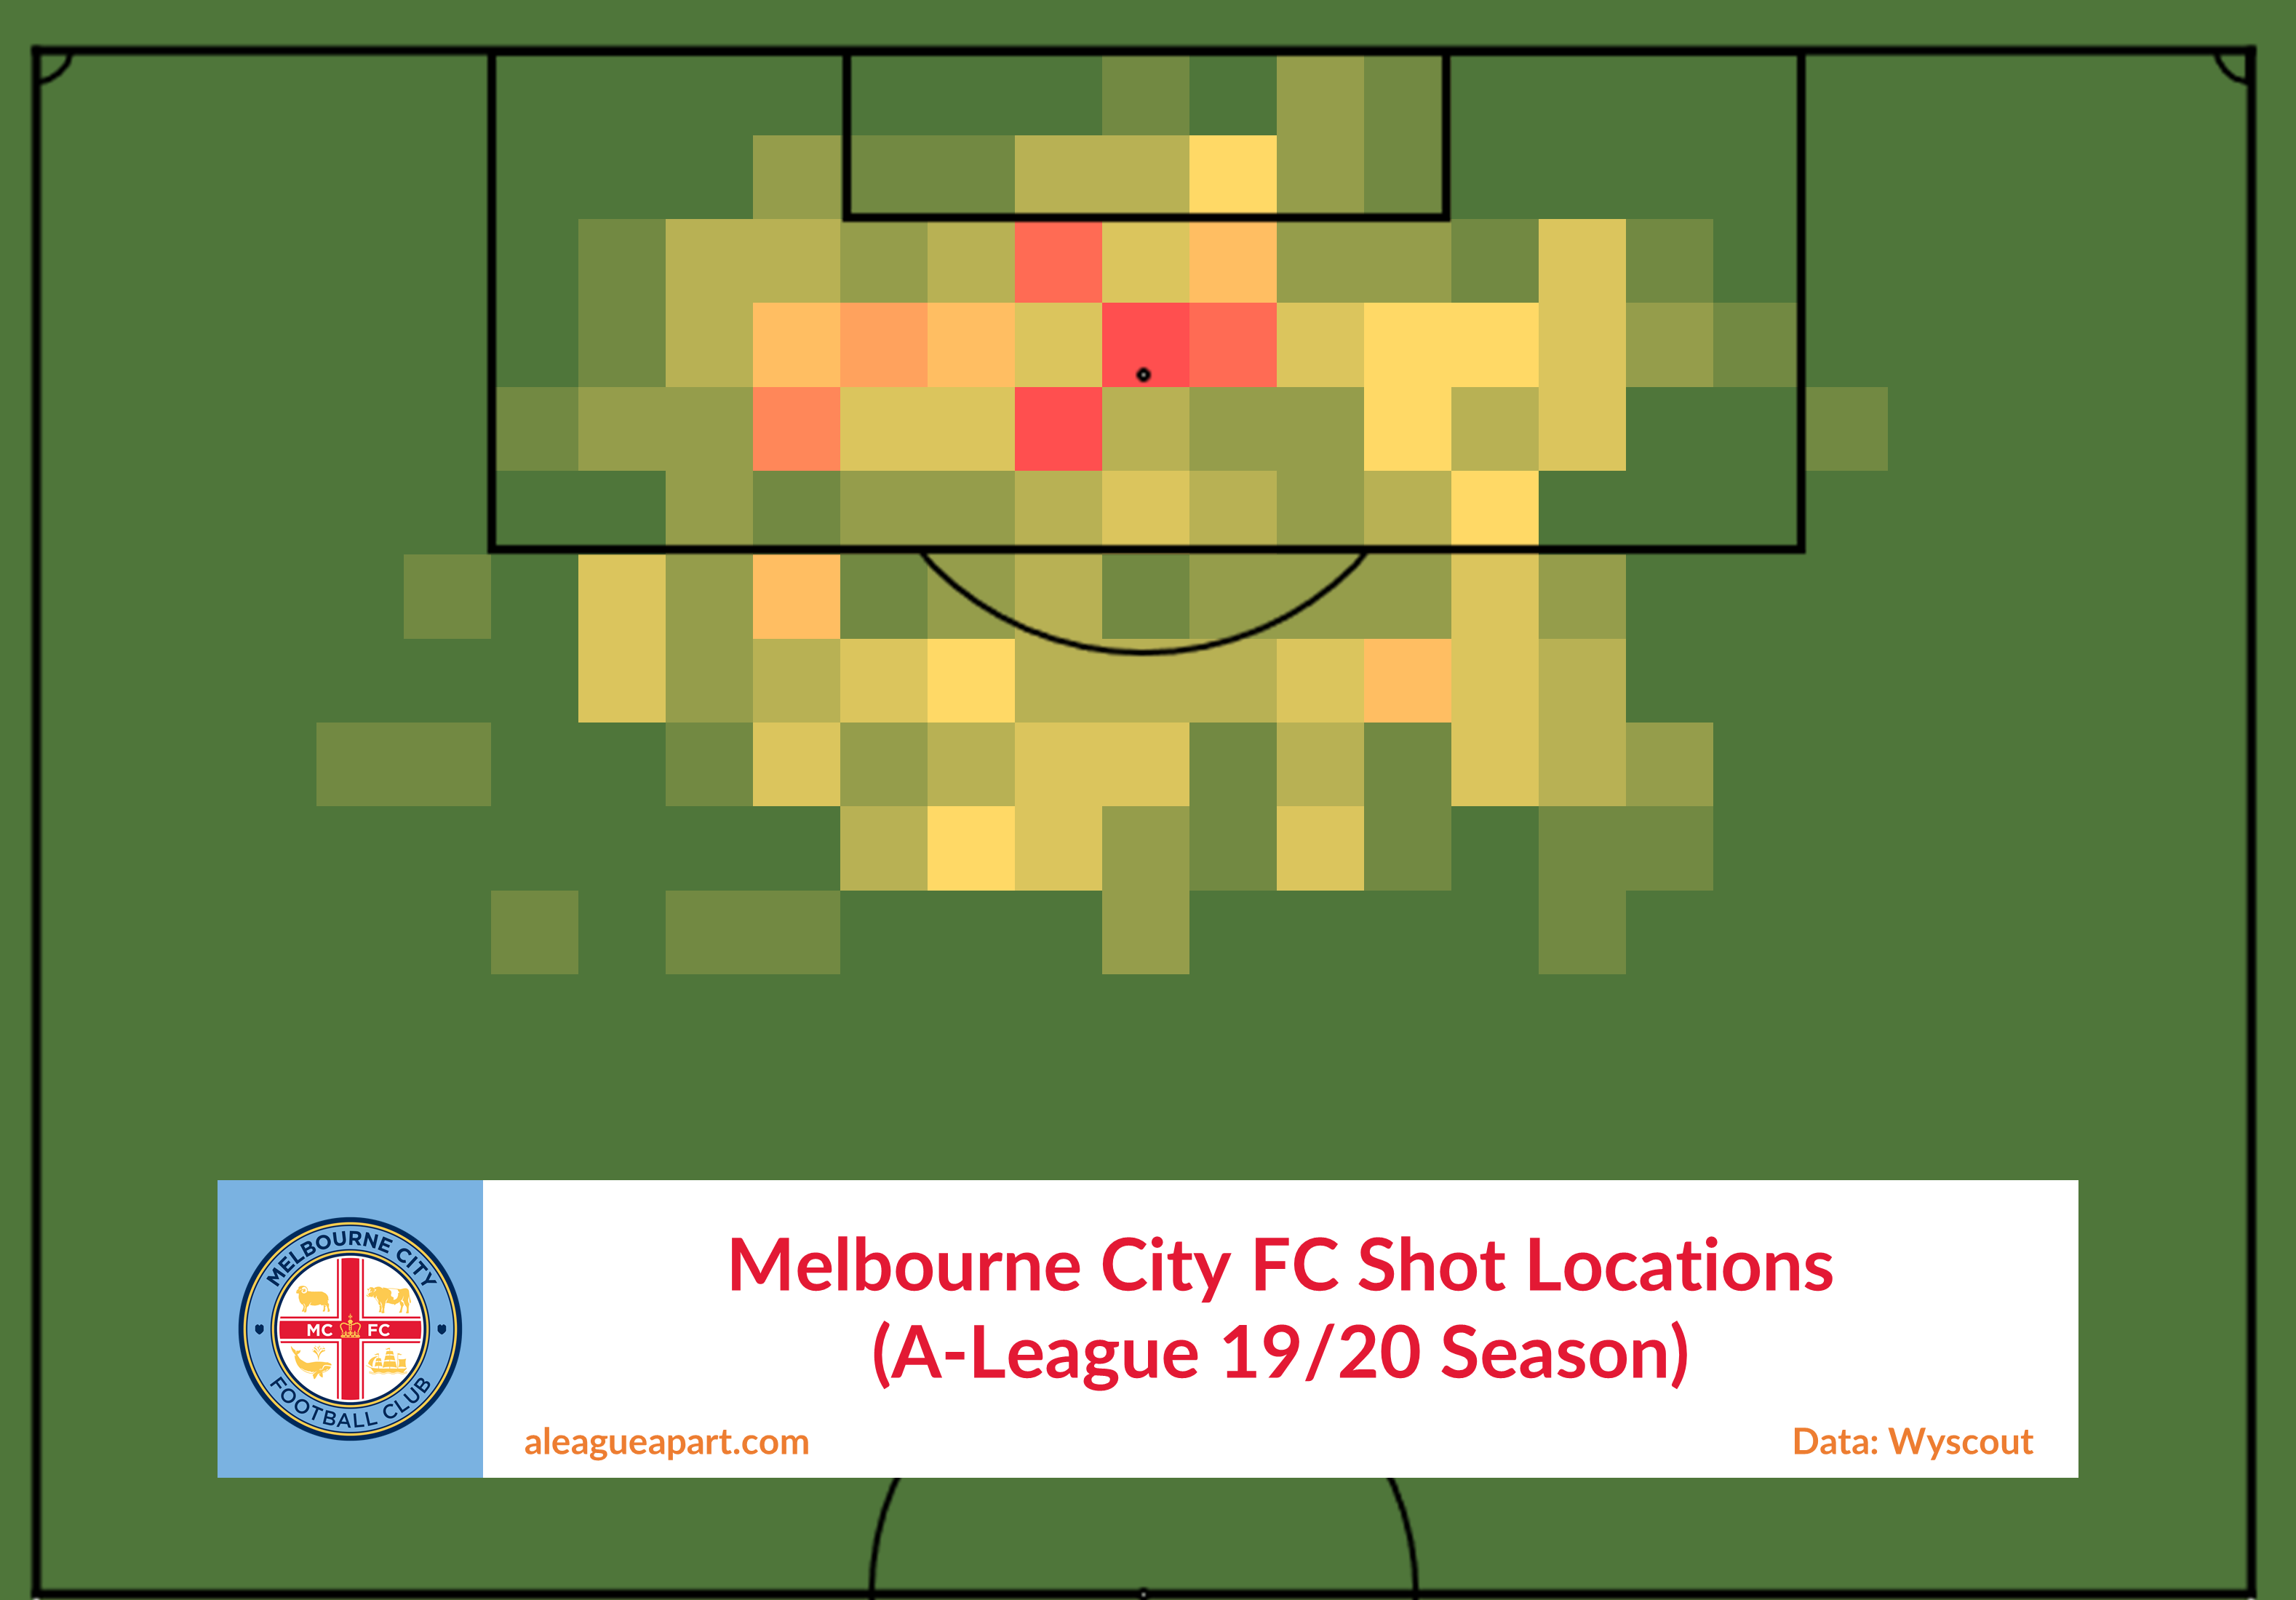
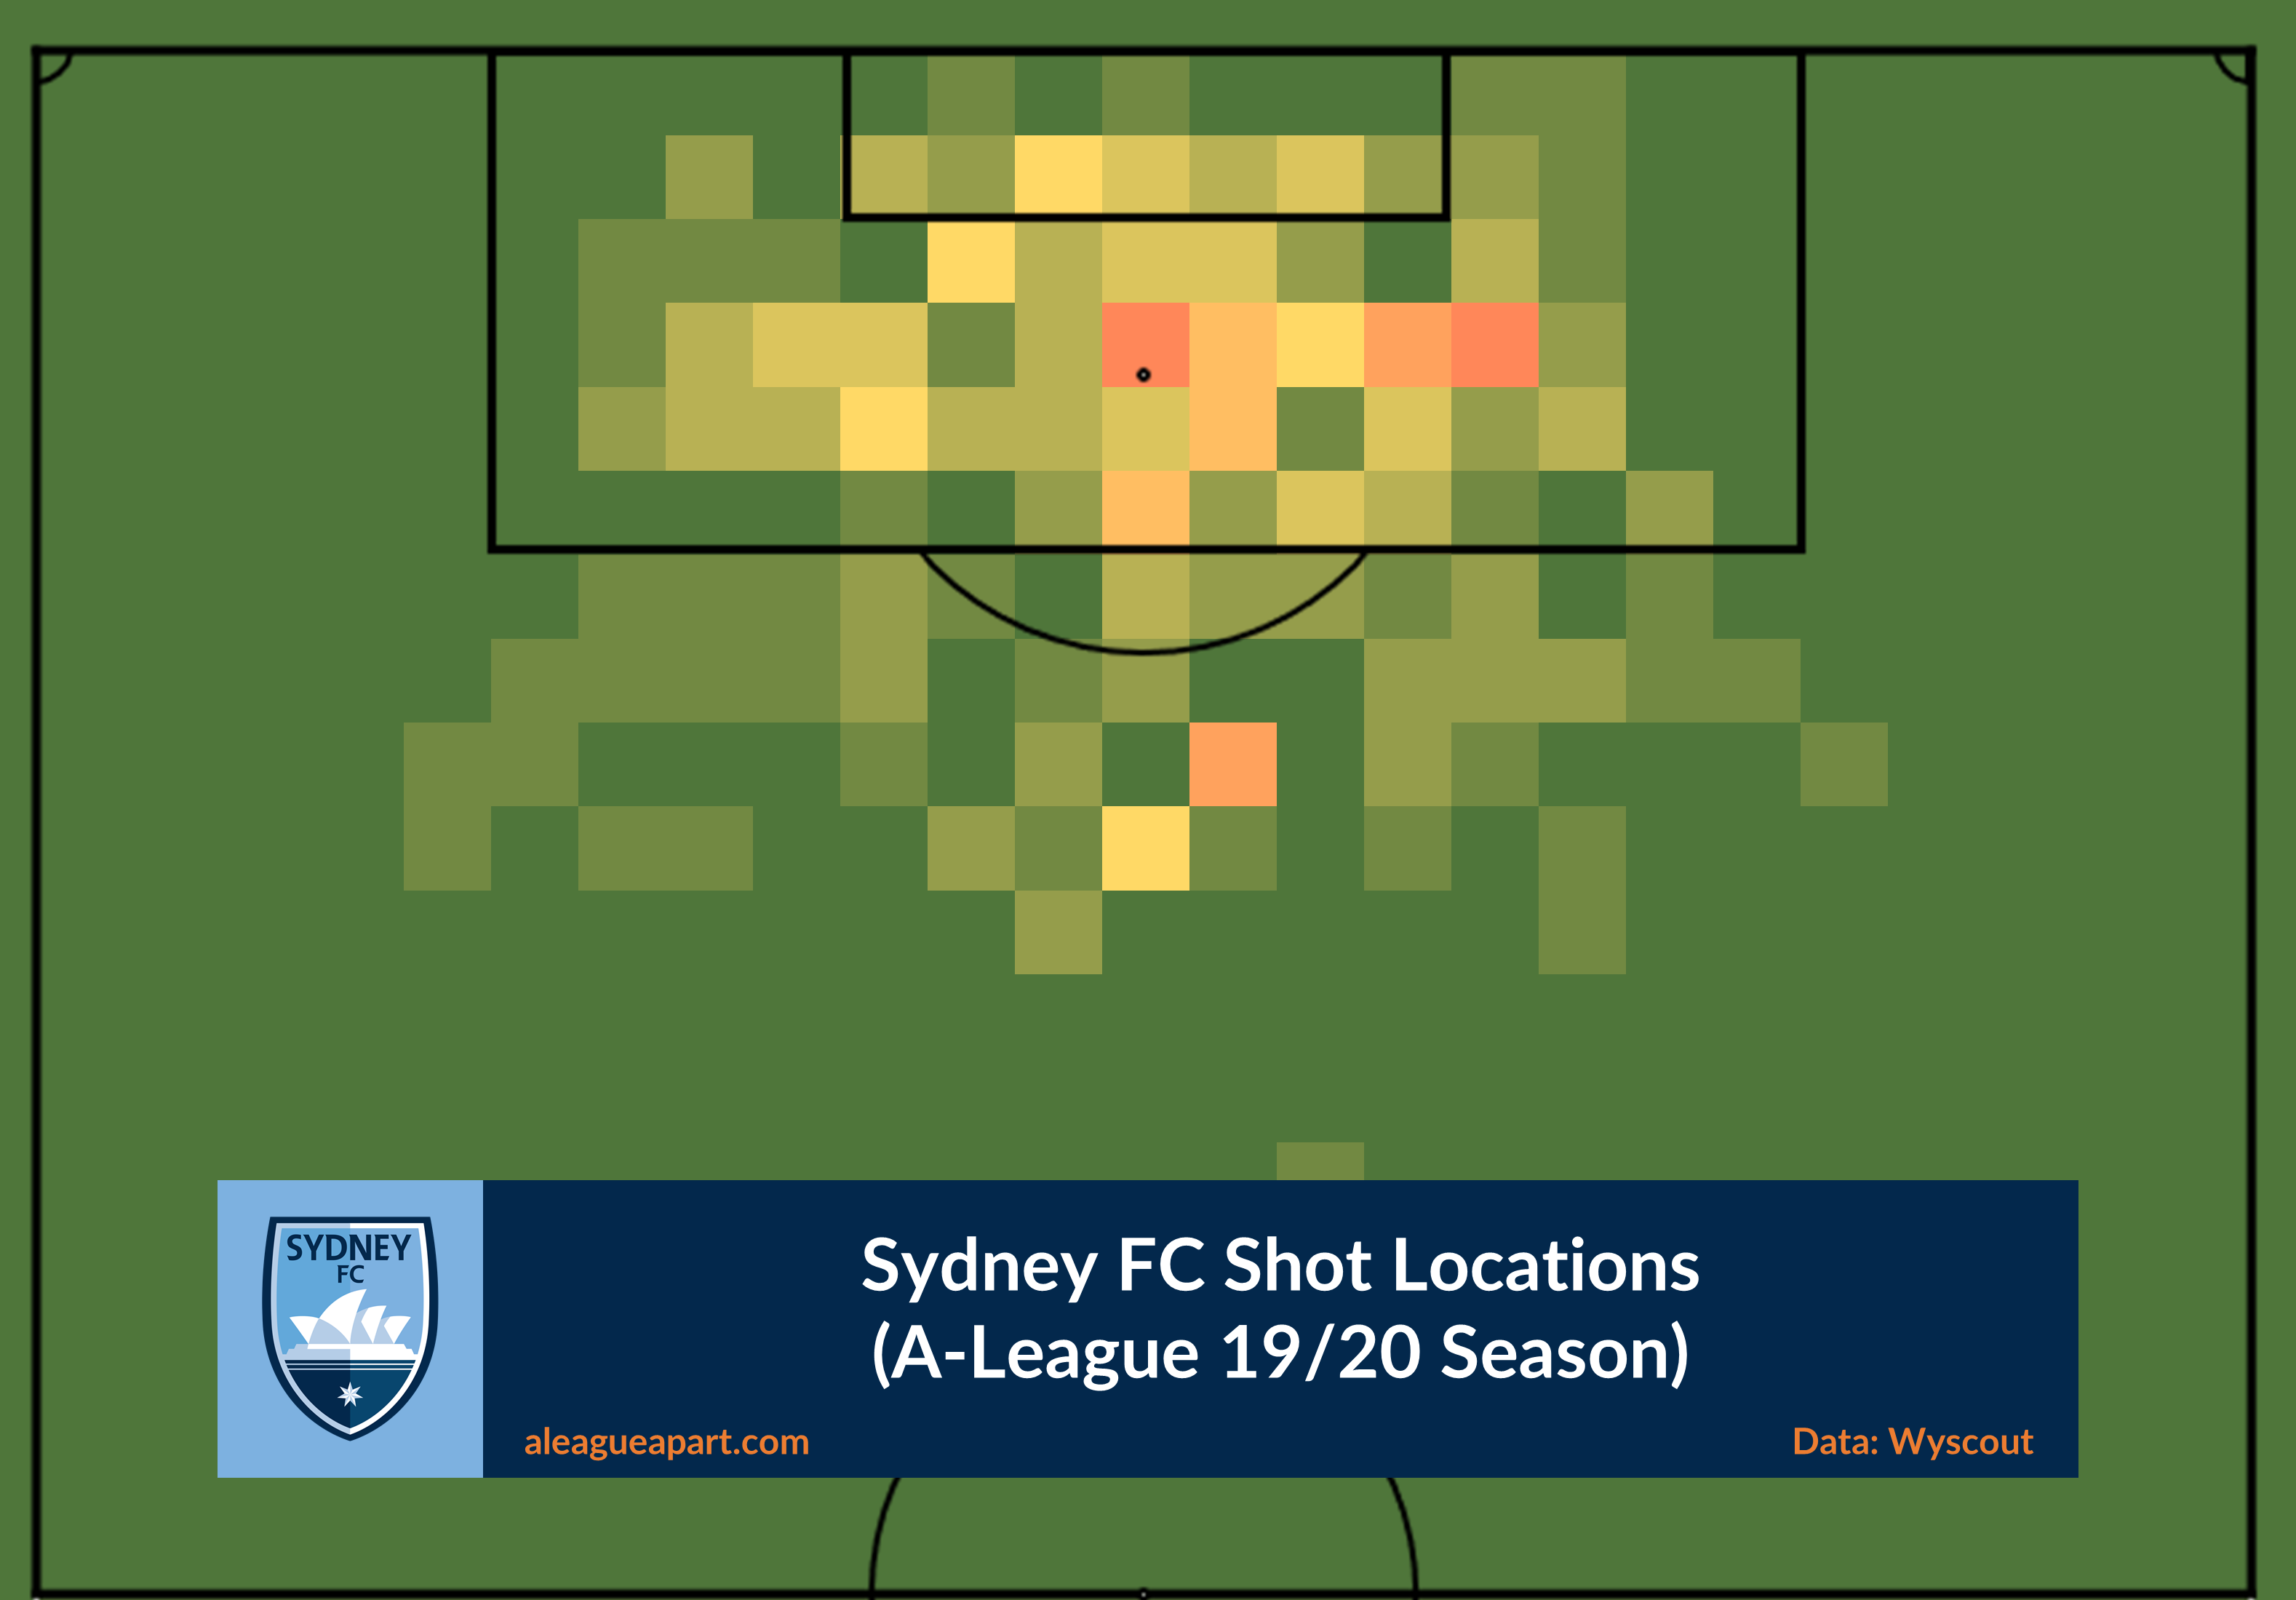
Shots
On average, Melbourne City take three more shots than Sydney per game. They shoot more from outside the penalty area, and in general, from further out. This has an impact on the expected goal per shot – with higher volumes of lower quality shots, the average xG of Melbourne City (0.109) is less than Sydney FC (0.161).
This suggests that Melbourne City’s style of play is more about volumes of shots, whereas Sydney’s style of play is focused on taking fewer shots, but the shots that they do take are of higher quality.
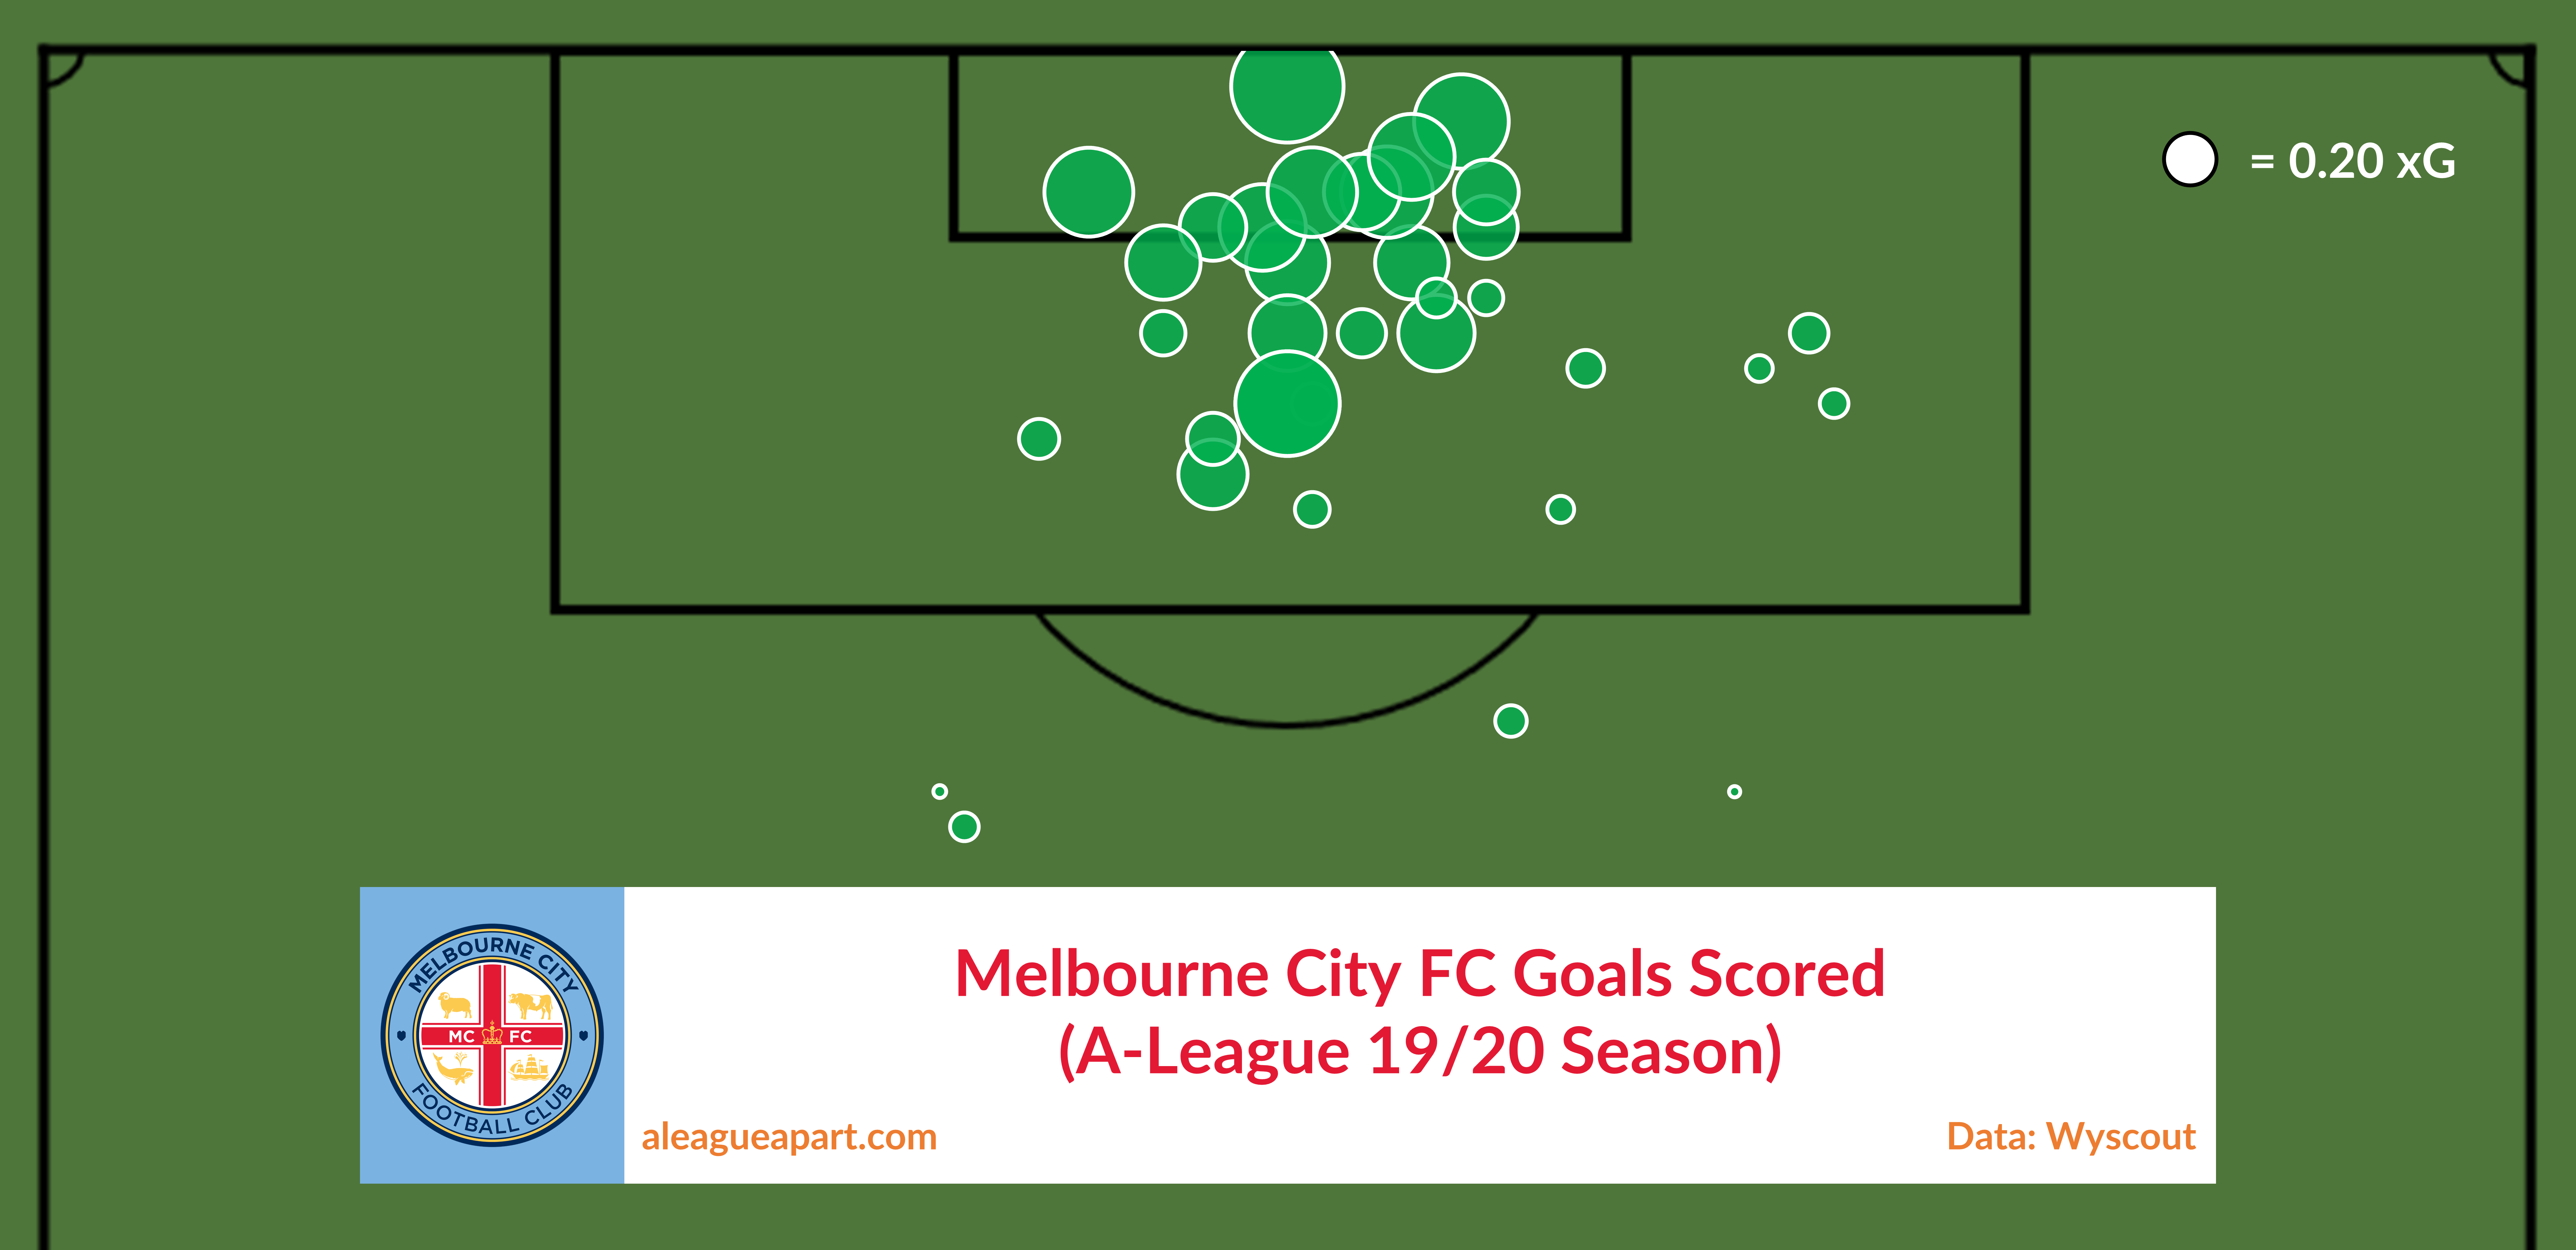
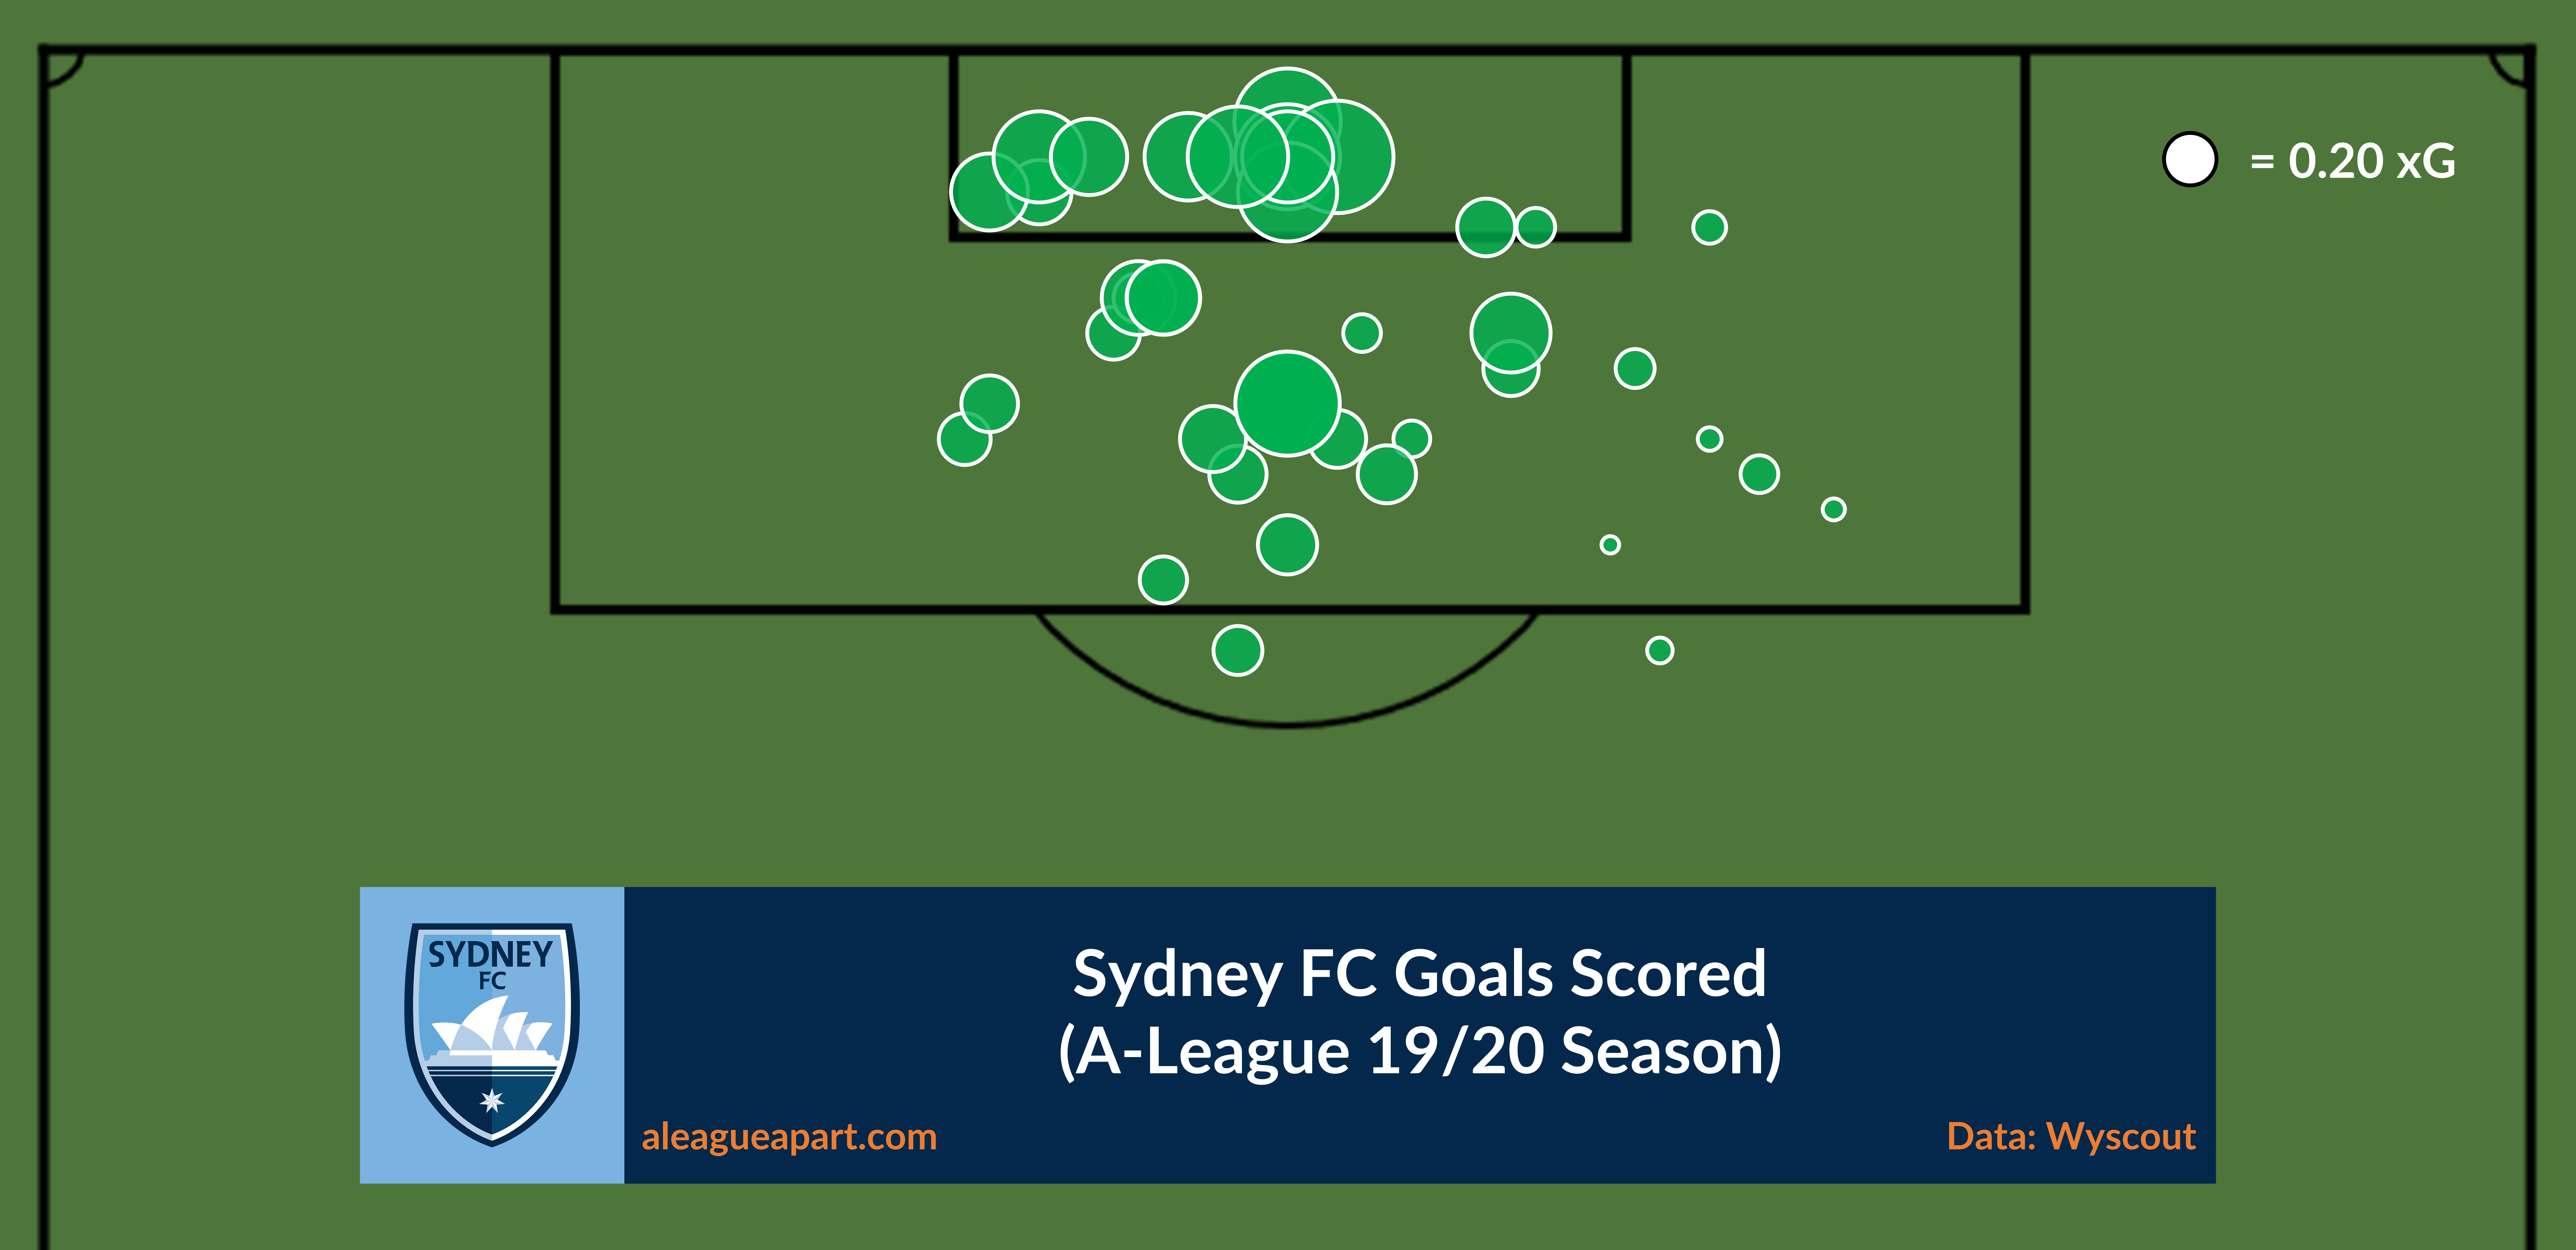
Goals
Sydney and Melbourne are the highest scoring teams in the A-League this season. Both teams have a healthy amount of goals, mostly scored in central positions in the penalty area. There’s nothing wrong with a tap in!
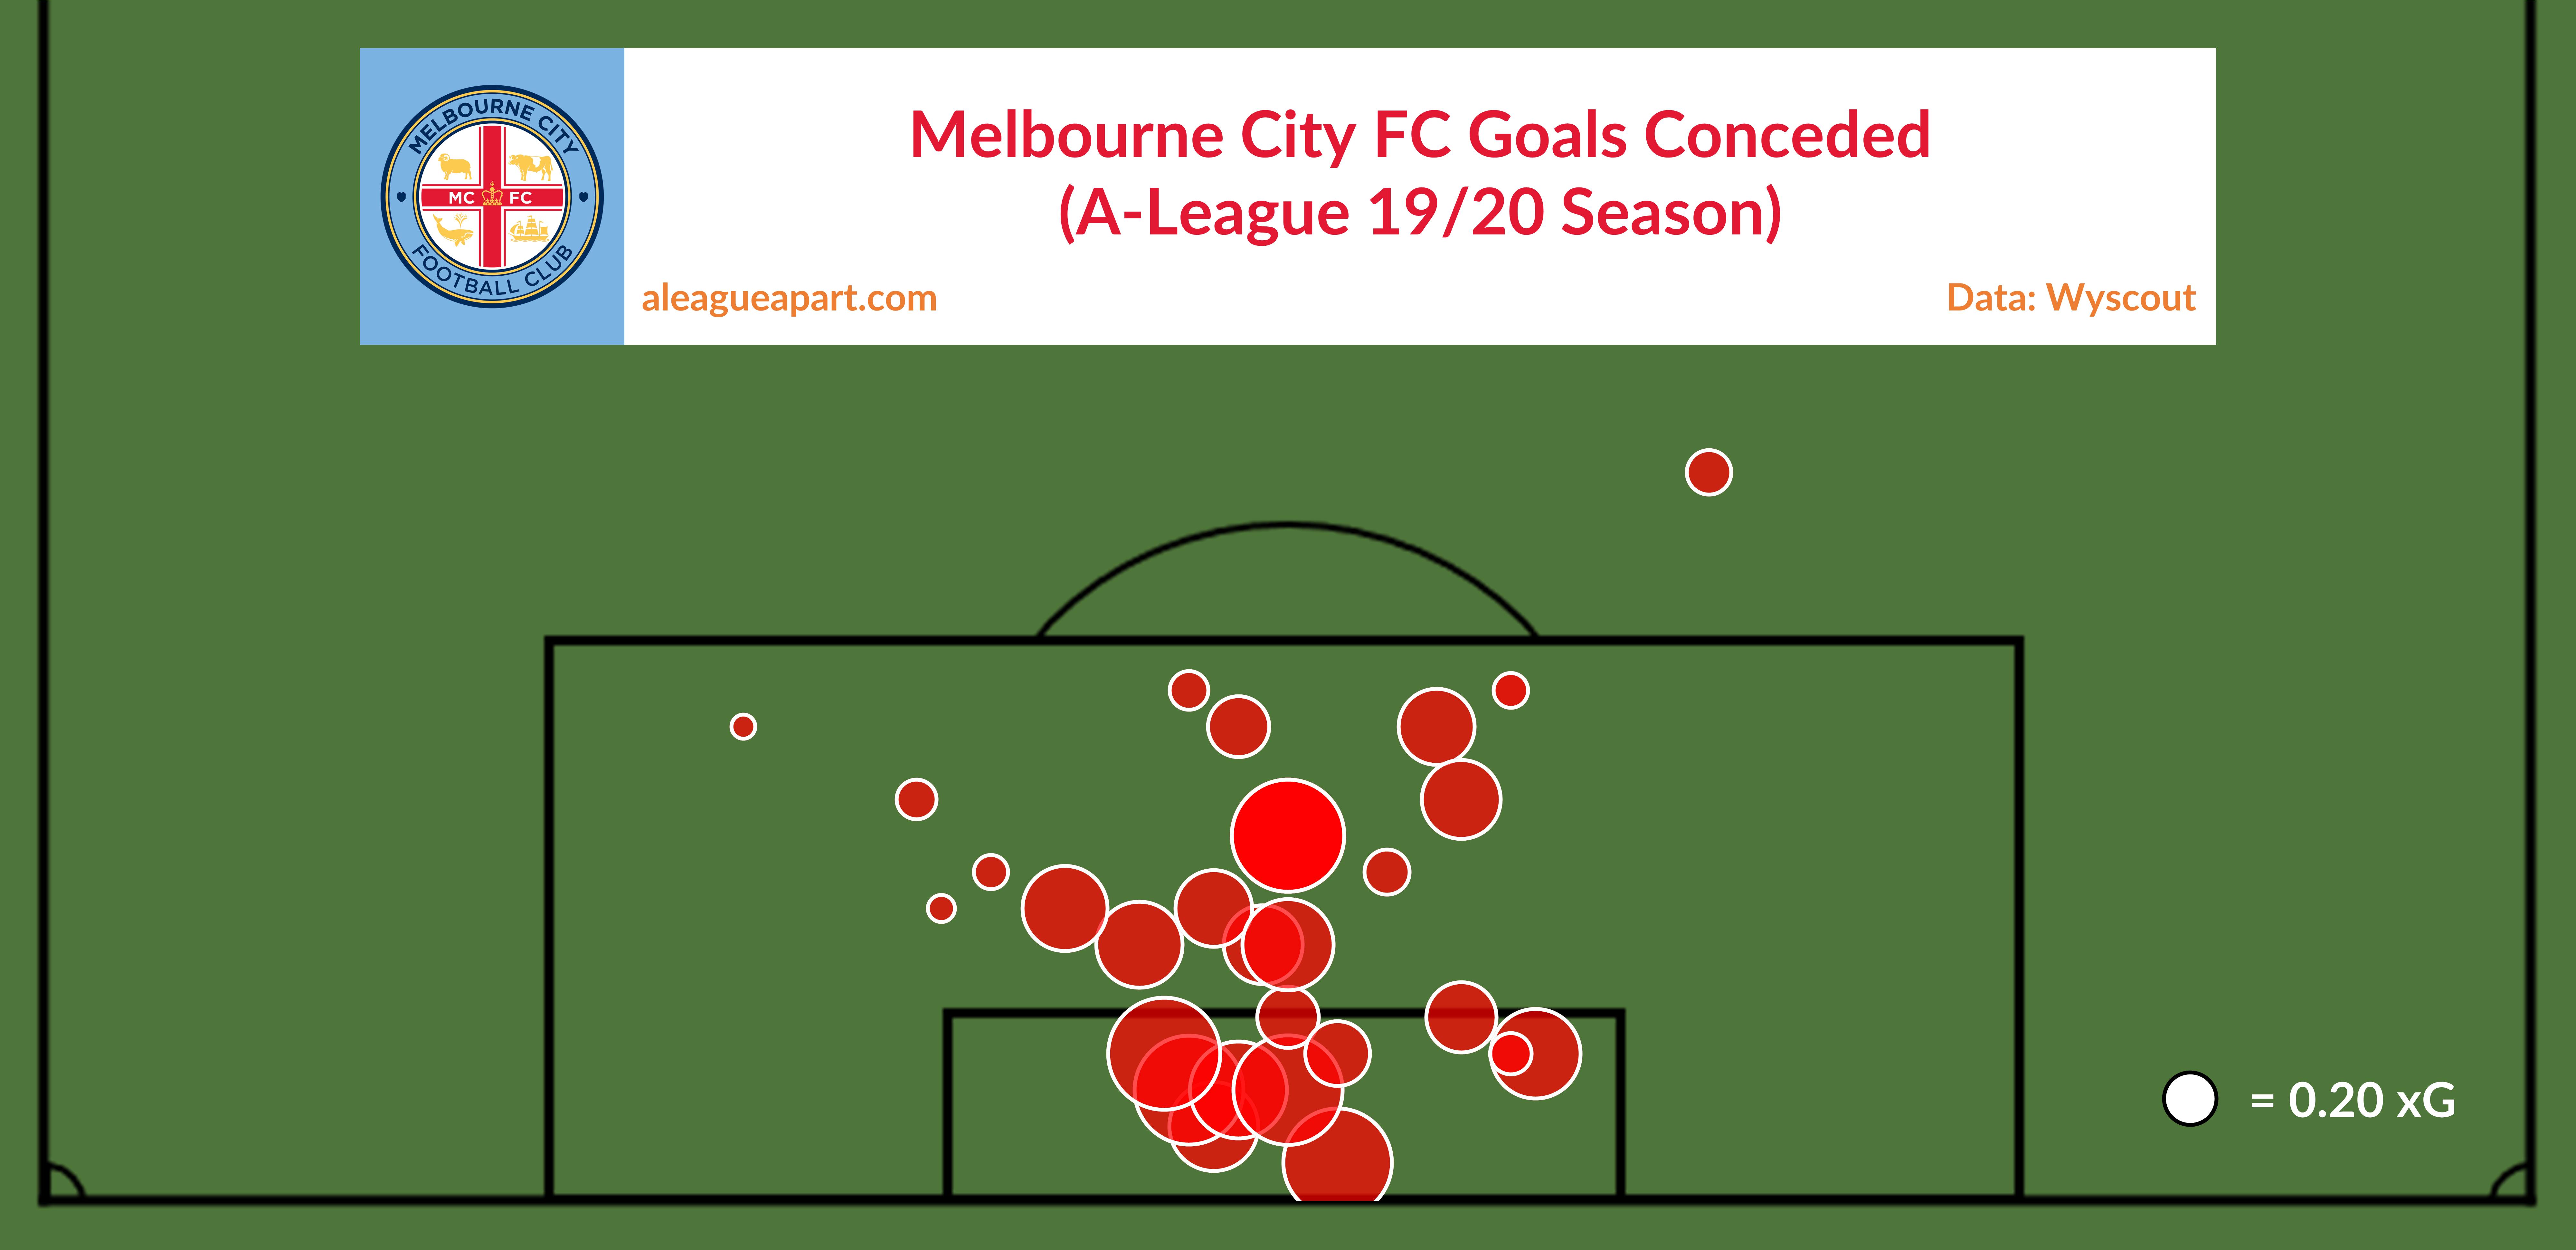
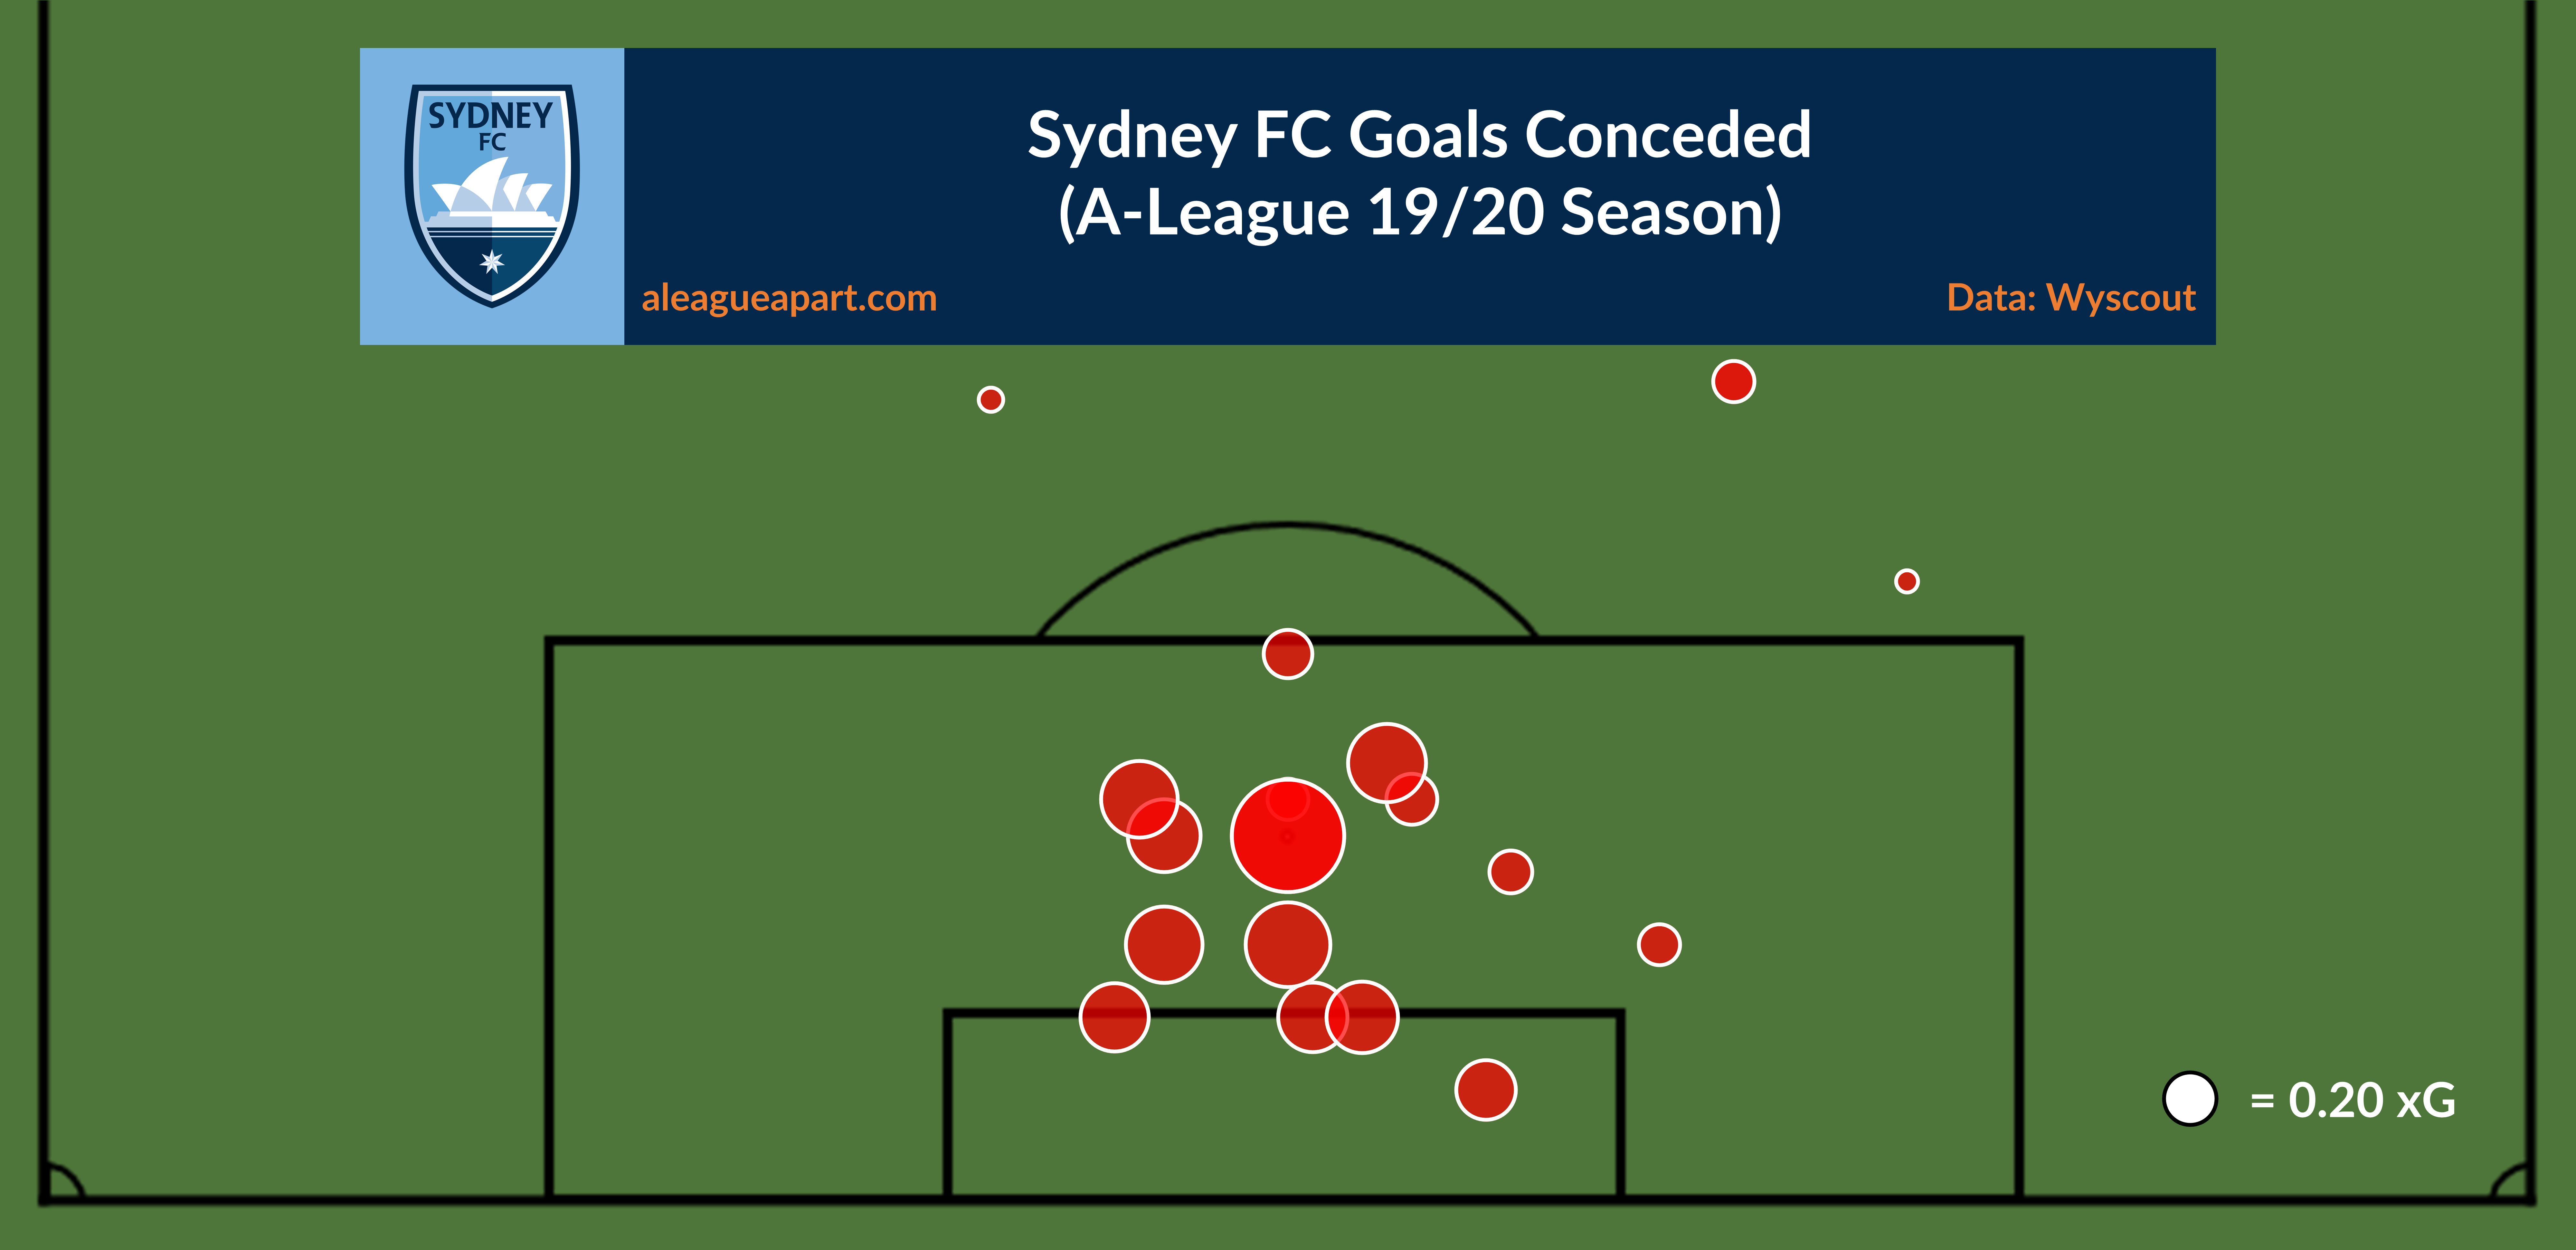
Goals conceded
Sydney FC have done a better job of defending their goal than Melbourne City. The conceded shot map for Sydney shows only few goals from the six-yard box, suggesting that they’ve been able to defend the space in front of their goal quite well, and shots from tighter angles are not finding their way into the back of the net.
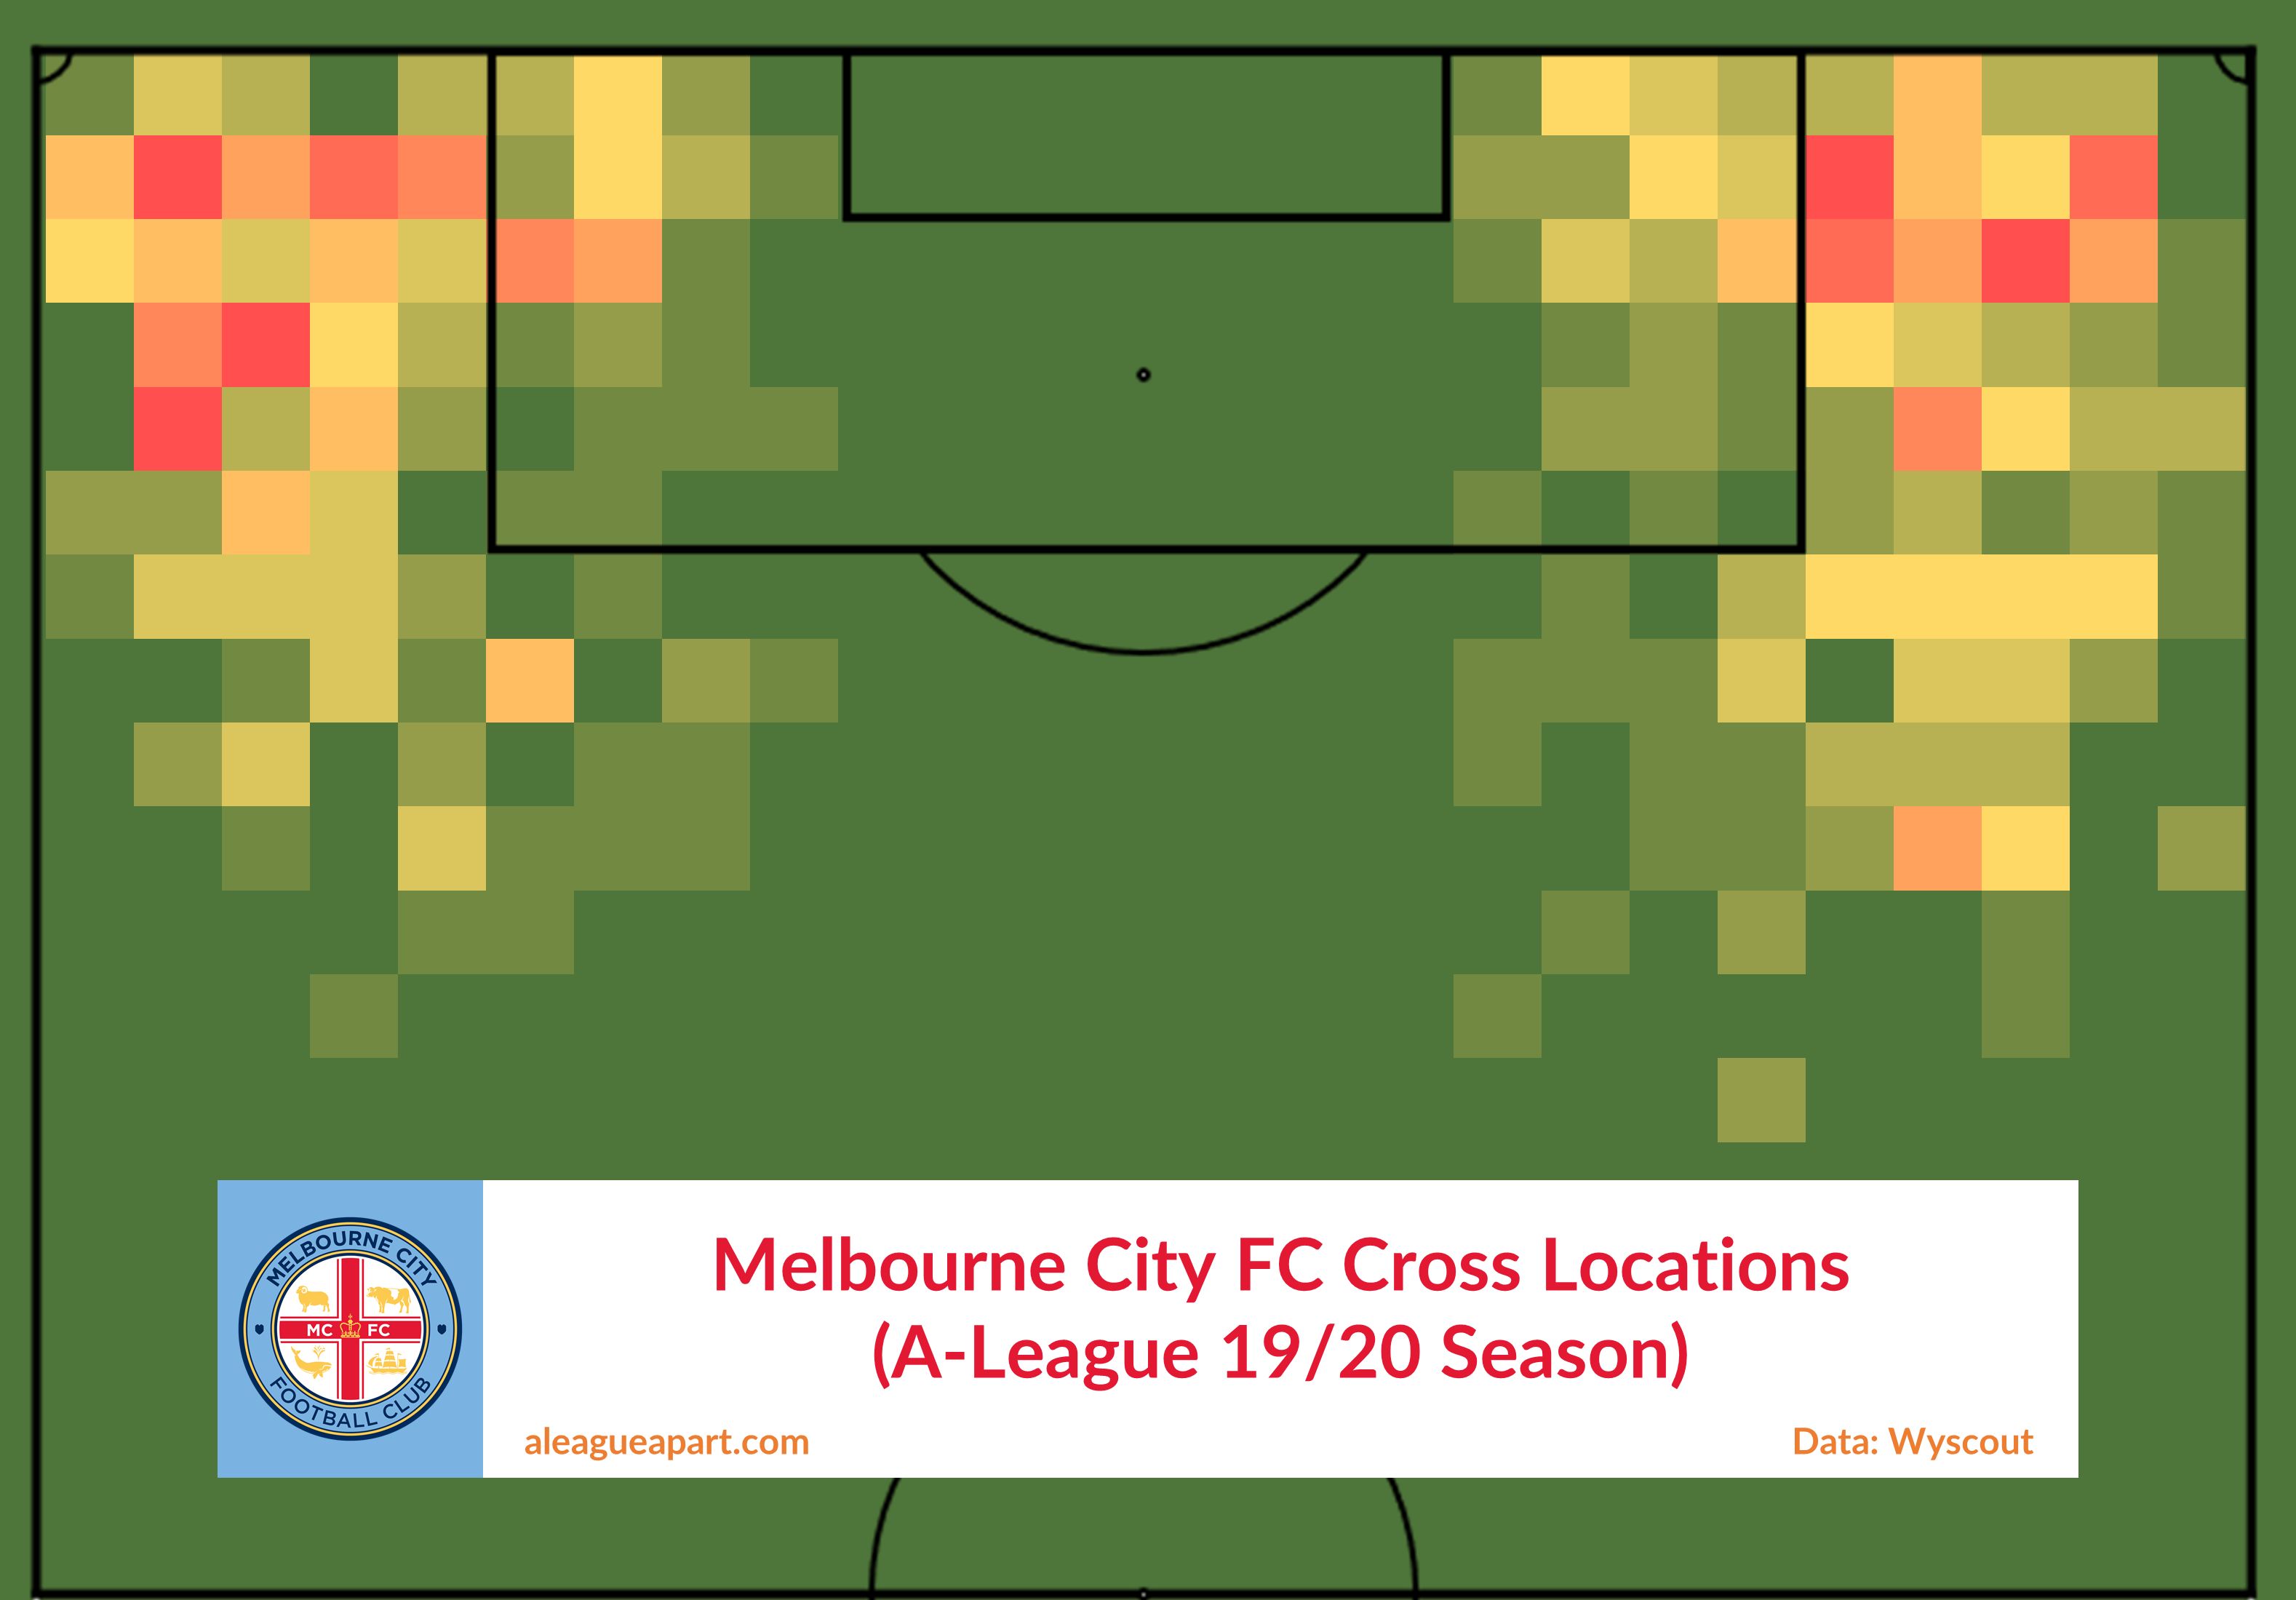
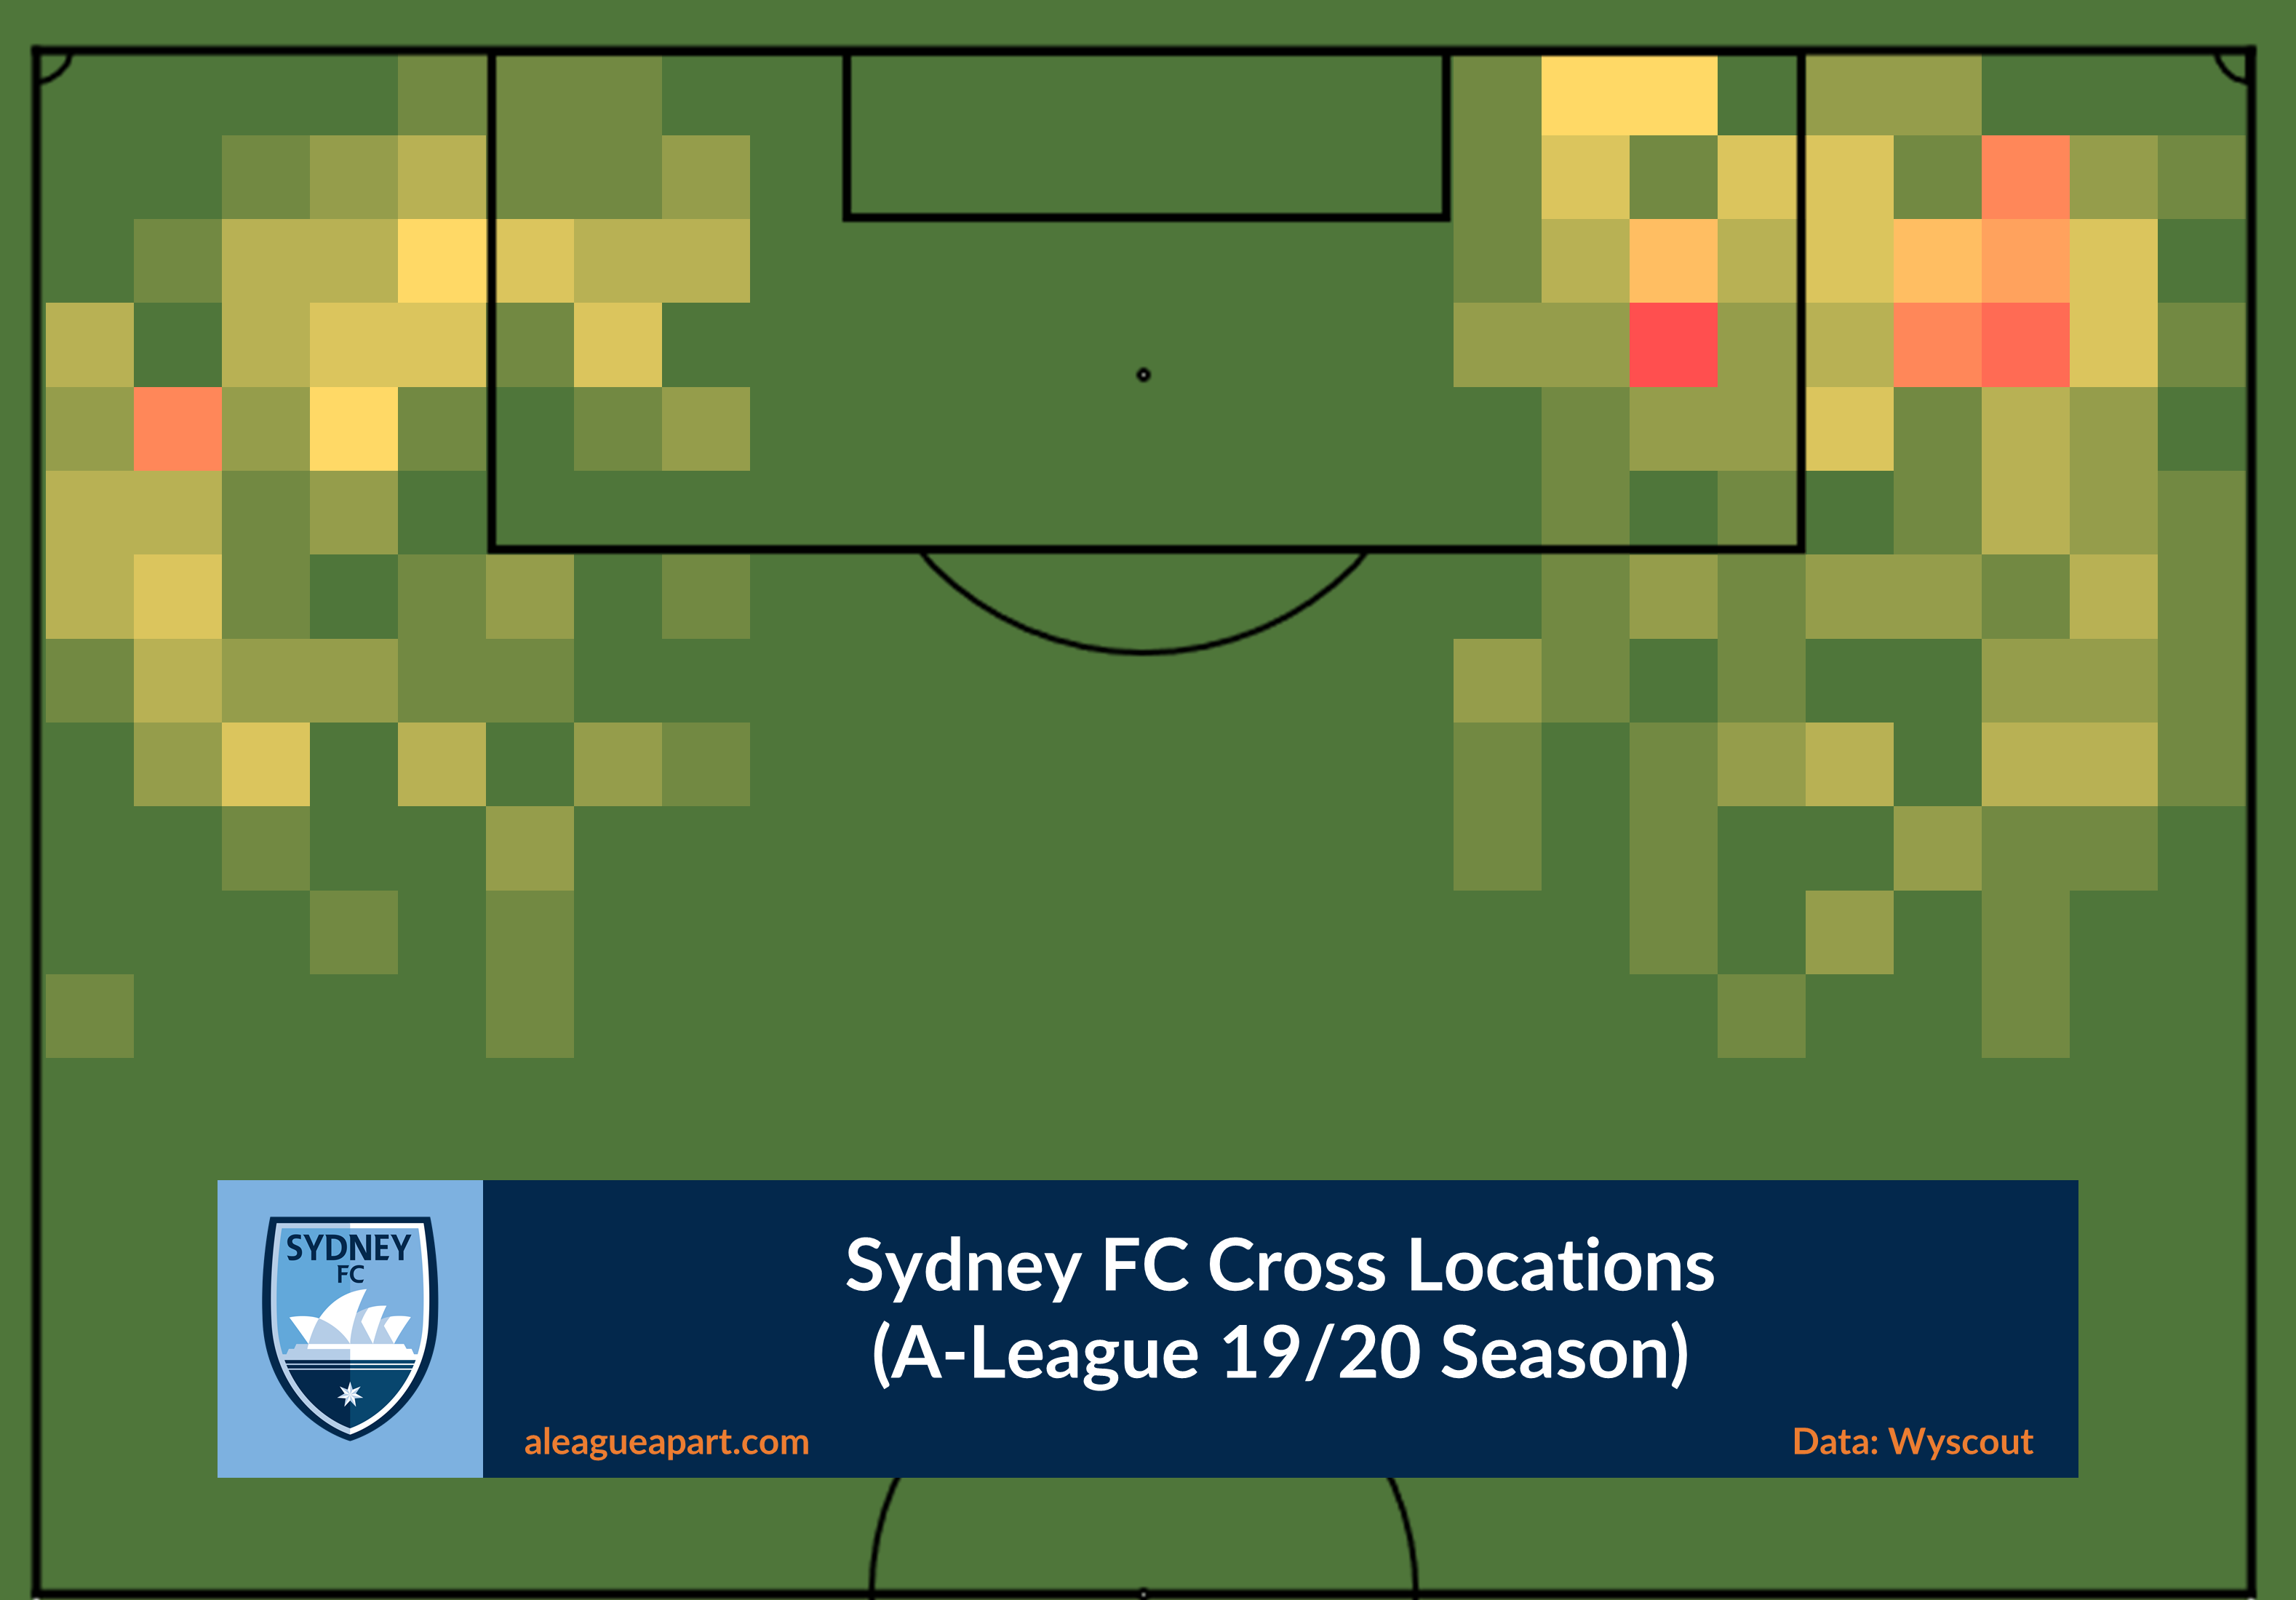
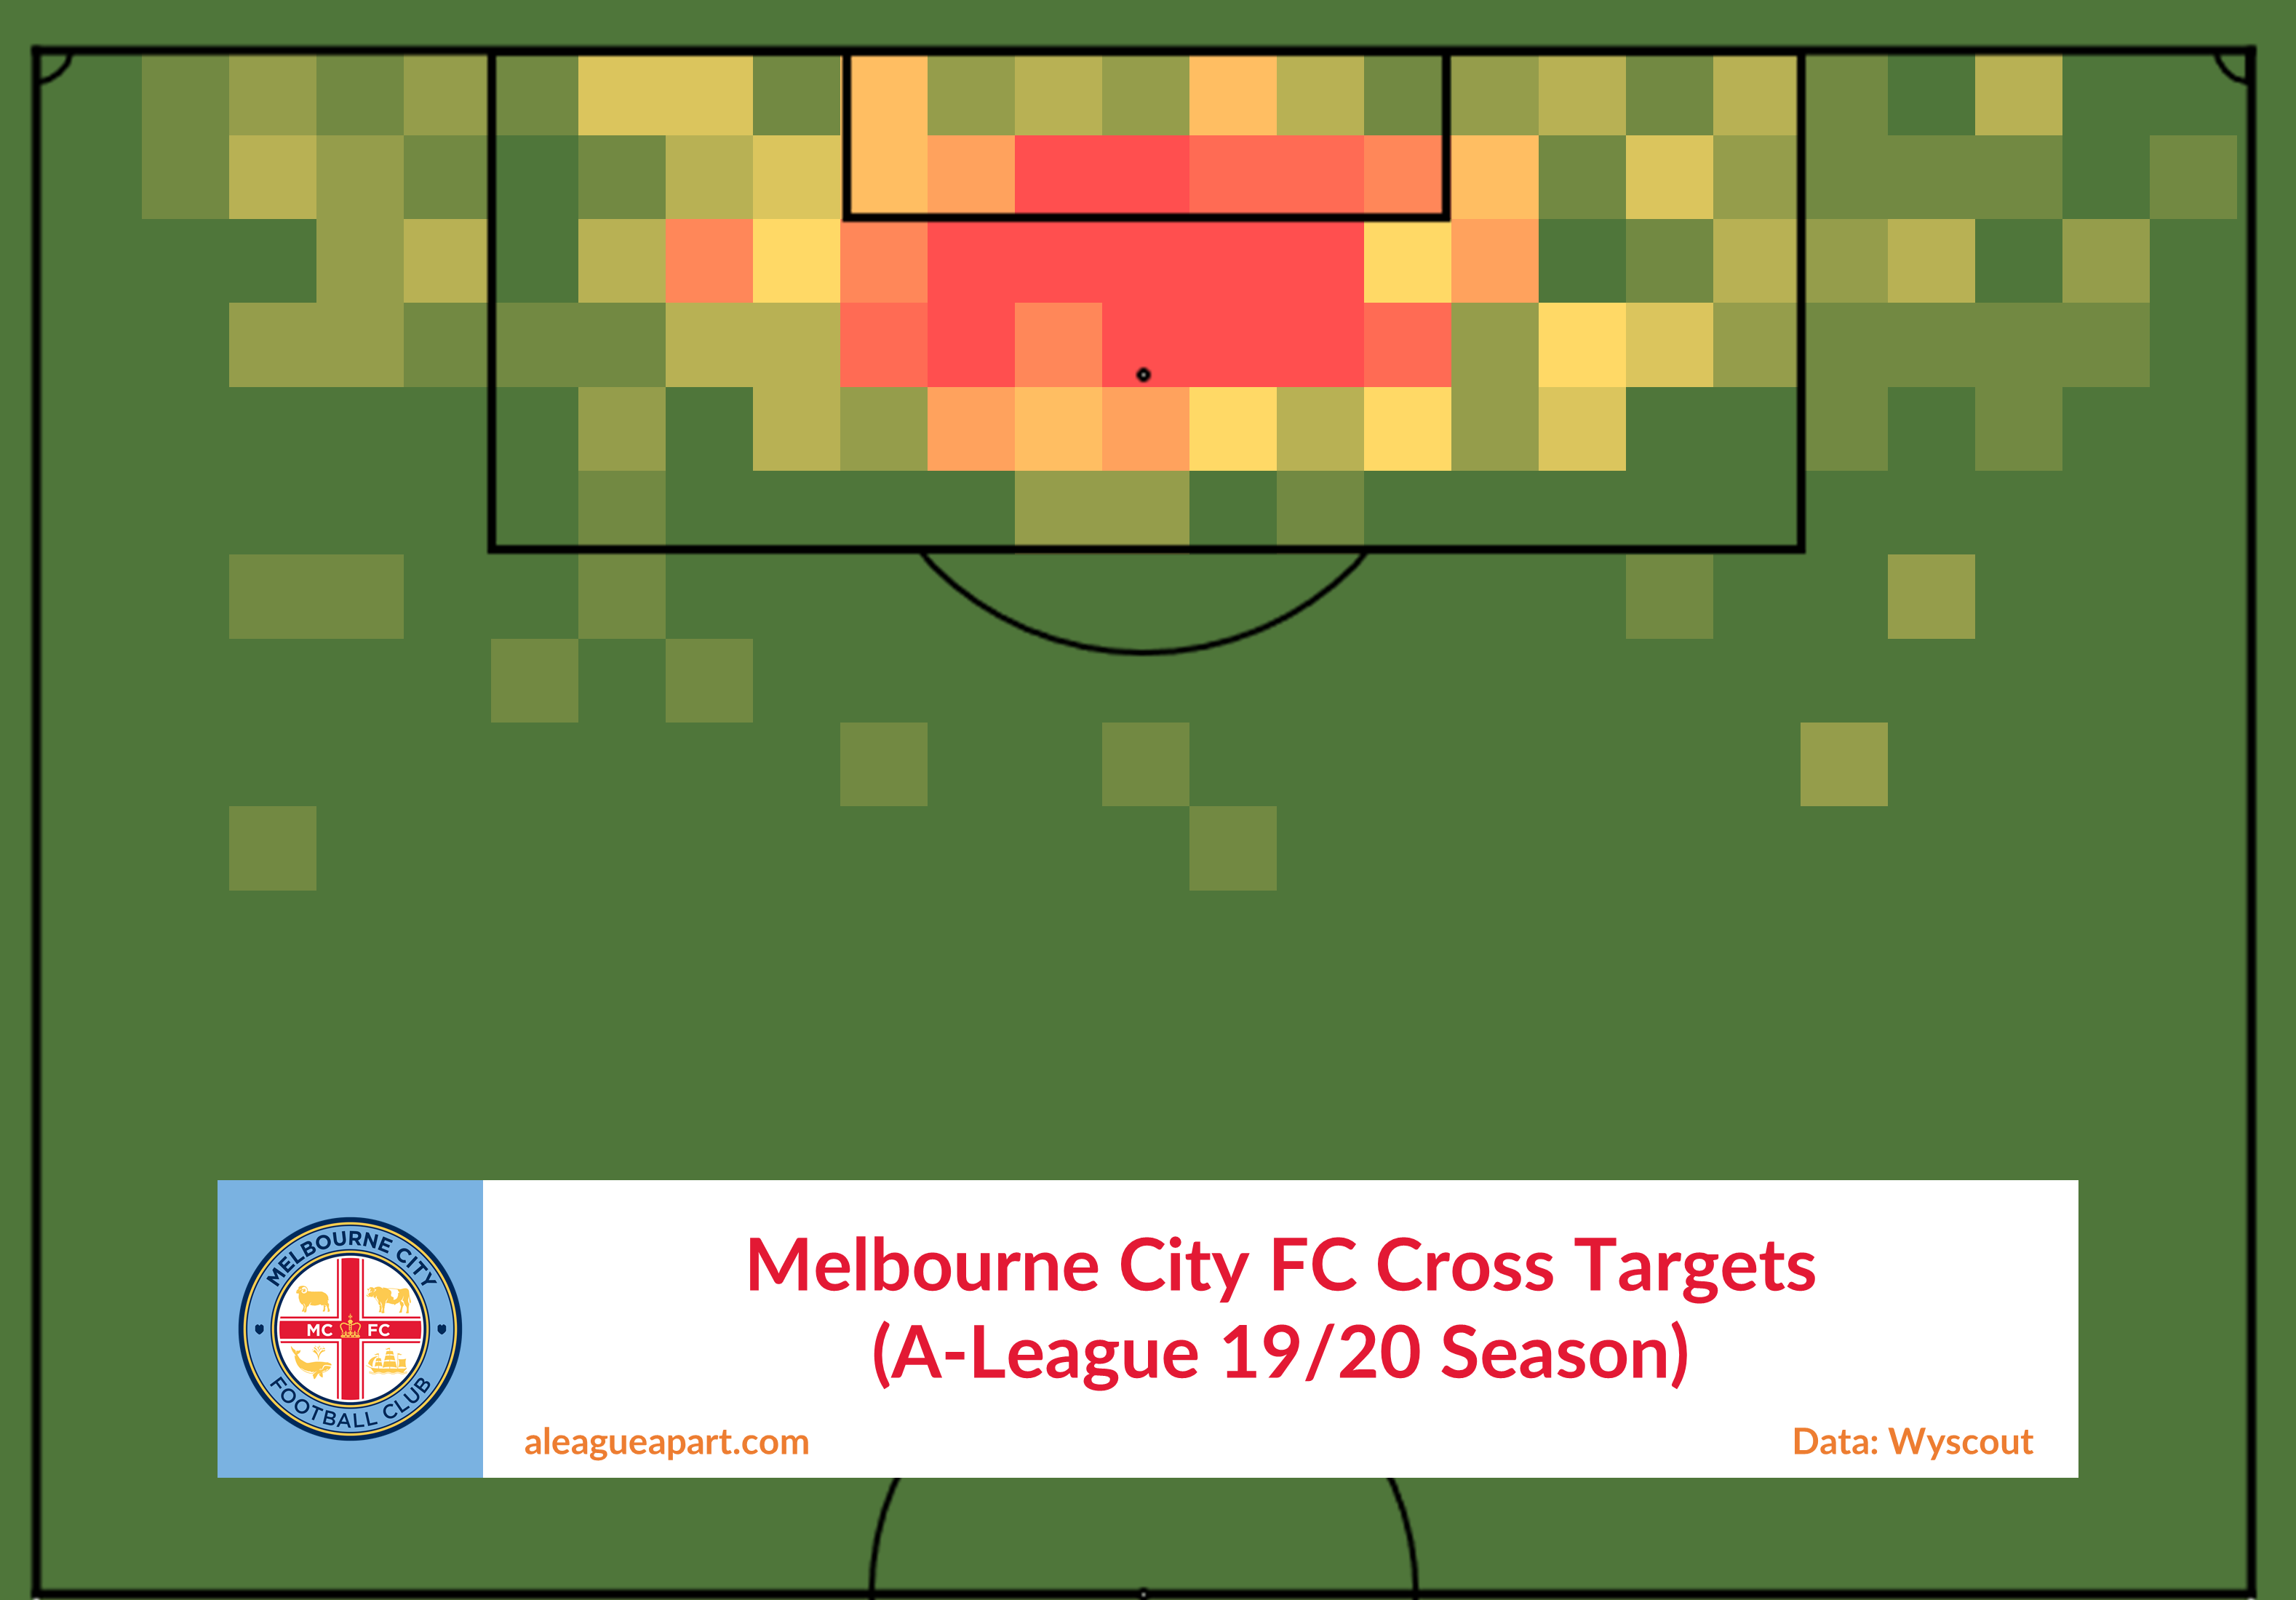
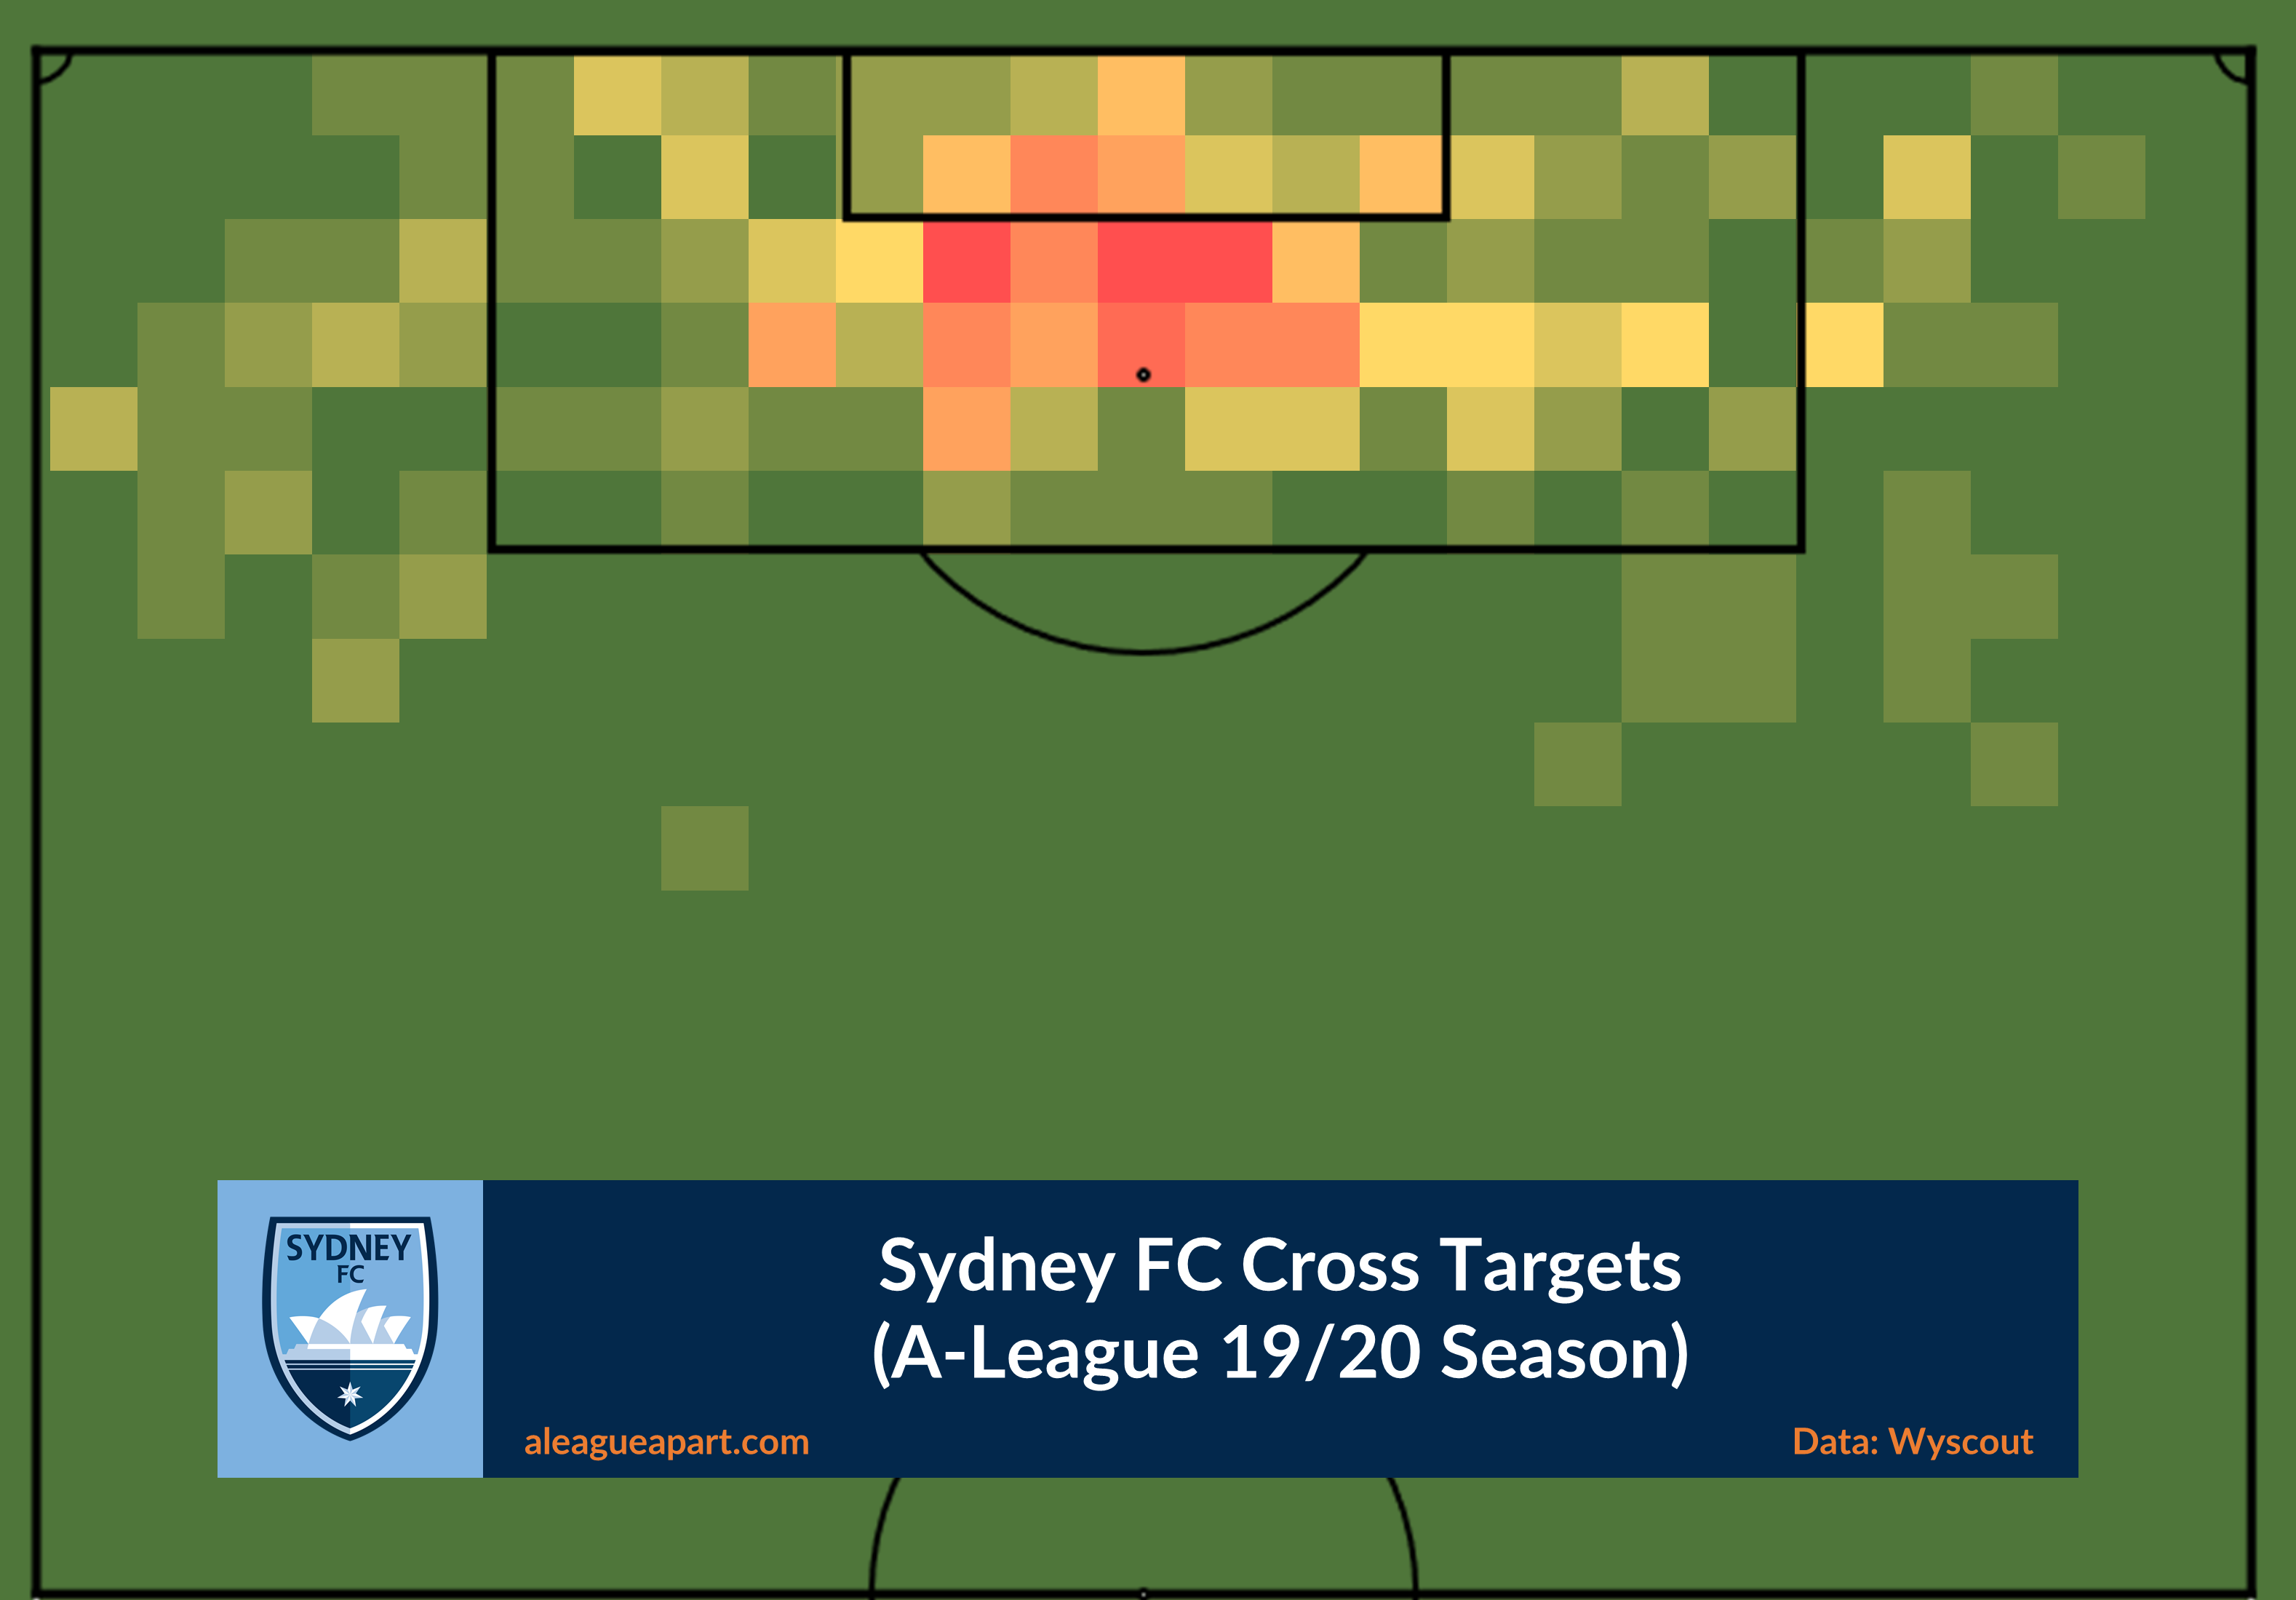
Crossing
Melbourne City’s quantity over quality also applies to crossing, with an average of 20 crosses per 90 minutes, as compared with Sydney’s 14.04. Craig Noone has the most crosses in the A-League this season with 136 across their 23 games (average of 5.91 per game).
Melbourne City cross frequently from both sides, whereas Sydney FC are heavily focused down the right flank (Alexander Baumjohann, Rhyan Grant, Luke Brattan). Both sides aim their crosses towards the area in front of the penalty spot.
Are you the ultimate team manager? Pick your own superstar team and go head to head with other football fans for glory and cash prizes on Draftstars. Imagine what you could be buying instead. Set a deposit limit.
Even though St.Pauli ultimately lost a high-scoring affair, Jackson Irvine was a standout, as well as scoring a late goal.

Mathew Leckie played a pivotal part in Melbourne City claiming an 8-nil win; playing a role in several of his team's goals.


The loser of the Sydney Derby will be under immense pressure entering the final three matches of the season.
Anthony Caceres is a player with immense talent and has a fantastic work rate, broke the deadlock against the Mariners in the 74th minute.


Under-pressure Western Sydney coach Marko Rudan has failed to front up for his post-match press conference after a 7-0 thrashing from Melbourne City, the…

Round 19 was an interesting weekend of football with no draws, 19 goals in six matches, two five-goal games on Sunday and for the…