


- Video
-
Club Roar
Captured a great grassroots sporting moment? We want to see it!Content Collections
The Roar Community
- Join
- Login
Opinion
It is a fundamental truth of Test match cricket that bowlers win matches.
Batsmen give their teams the opportunity to win, however bowlers generally must take 20 wickets across two innings within five days for a team to claim victory. Another way to look at it is that batsmen can stop a team from losing but bowlers make a team win.
This is also the fundamental difference between red-ball and white-ball cricket. In limited-overs cricket the aim is to score more runs than the opposition within a set allocation of deliveries, whereas in Test cricket the aim is to take 20 wickets within a set allocation of time, while conceding less runs than the opposition. Therefore in limited-overs cricket, batsmen win matches – but in Tests, the bowlers hold the key.
So bowlers are pretty important people. In this series I will examine which Australian bowlers have contributed most towards winning matches for their country.
See my previous series of articles looking at batting performances in wins and also which players have actually won the most matches.
There are four basic measures available when evaluating career bowling performances:
• Strike rate, being the average number of balls bowled for each wicket taken.
• Economy rate, being the number of runs conceded per over.
• Bowling average, being the number of runs conceded for each wicket taken. This measure effectively combines strike rate and economy rate.
• Wickets per Test. This underused and very basic measure tells us on average how many of those 20 wickets required are picked up by a particular bowler.
I will primarily be using bowling average and wickets per Test in this analysis. Where a bowler’s strike rate or economy rate provides an additional insight they will also get a mention.
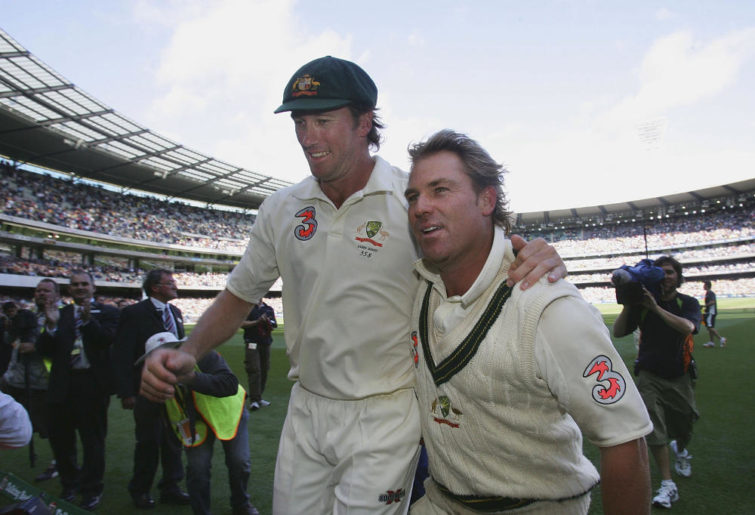
(Hamish Blair/Getty Images)
What I’m interested in here is to see who have been most valuable bowlers to Australia in winning Test matches, which of course is what the game is all about. Therefore, each bowler’s career has been split into wins, losses and draws. A bowler who, for example, takes six wickets per Test in wins at a bowling average of 20 will be extremely valuable.
Bowling statistics have been affected significantly more than batting numbers by changes to the game throughout history. Bowling averages and strike rates before World War I are markedly better than more recent numbers. Then from around 1920 to 1970 economy rates were much lower and strike rates much higher than modern times. In the past 40 to 50 years strike rates have dropped but economy rates have risen significantly as batsmen became more aggressive and covered pitches became less variable.
Interestingly, batting averages have not been affected as much by these trends, for the simple reason that batting average does not measure scoring speed, while the bowling average is affected by economy rates. Scoring rates have risen faster than strike rates have improved, leading to generally higher bowling averages.
So a straight list of the best bowling averages tends to favour pre-WWI bowlers. Add covered pitches, changes to LBW and no-ball laws, restrictions on leg-side fielders and pink balls, and comparisons over time become problematic.
To get around this, in addition to presenting the bowling average and wickets per Test in wins for each bowler, I will compare their bowling average to the performance of their fellow bowlers in those actual Test matches and provide a peer difference percentage. This added measure will tell us how well a bowler performed compered to his teammates of the era in exactly the same matches and conditions. This is of course still not a perfect comparison, and likely favours standout bowlers in weaker teams, but between the raw numbers and peer comparison maybe some insights will reveal themselves.
For this first article I will provide a review for one bowler as an example of how all of this works. Let’s have a look at ‘Billy the Kid’, Craig McDermott, who was an attack leader for Australia during the underwhelming mid 1980s and into the 1990s, retiring just as Australia overtook the West Indies as the number one Test nation.
Craig McDermott
27 wins (38.6 per cent of all matches), 18 losses and 25 draws. Wins average 22.74 (peer difference: +2.48 per cent). Wins wickets per match 4.85
These numbers show that on average in wins Craig McDermott took just under a quarter of the wickets available and gave up just under 23 runs to do so. This average is only 2.5 per cent better than other bowlers in those matches, who achieved a collective bowling average of 23.32.
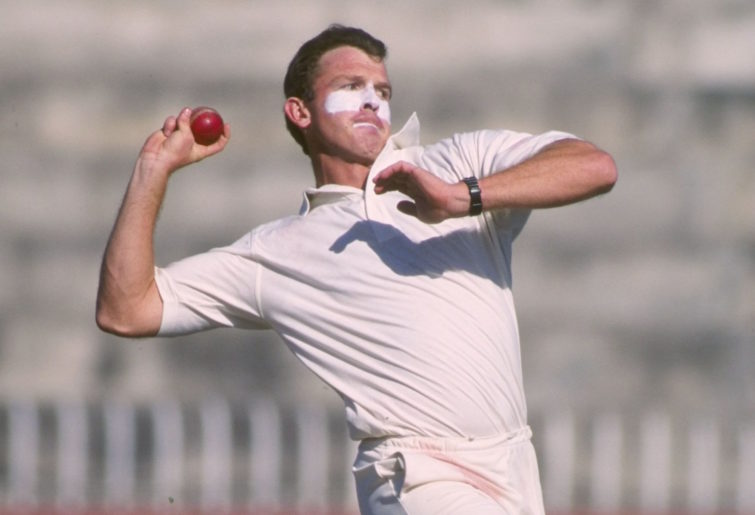
(Shaun Botterill/Allsport UK/Getty Images)
What this means is that McDermott was not head and shoulders above his peers in wins. For example, Pat Cummins is currently just under 18 per cent better than his peers in wins. That is very good considering who Cummins’ peers actually are.
Where McDermott does shine is in strike rate, which in wins was 48.1, pretty much a wicket every eight overs. This was 14.67 per cent better than his peers, who had a collective strike rate of 56.36. So in wins McDermott likely struck early and often, while giving up some runs, to allow time to take the required 20 wickets, while his peers took longer to get their wickets but kept it tight.
Obviously bowlers perform worse in losses, otherwise teams wouldn’t lose. For our McDermott example his average in losses was 33.6 with 3.67 wickets per Test. The players either side of McDermott on the list of averages in losses (minimum five losses) are 1990s brilliant beanpole Bruce Reid and solid Shane Warne offsider Tim May. McDermott’s figures here are actually better than they look. His comparison to peers rises to a 6.8 per cent better bowling average and a whopping 18 per cent better strike rate (i.e. 62.7 versus 76.6). So McDermott was pretty good in losses. In fact, that strike rate is the ninth best for all Australian bowlers to have played in at least ten losses.
Bowlers tend to have similarly less impressive performance in draws, where 20 wickets have likely not been taken in the match. McDermott averaged 32.43 (slightly better than in losses) and captured 3.76 wickets per Test. His closest neighbours here are the Bowlologist Damien Fleming and Mister two-for-22, Richie Benaud. McDermott’s performance in draws is very good. His average, strike rate and wickets per Test are all top ten all-time for Australian bowlers (minimum ten draws) – seventh, fourth and fifth respectively. The only bowlers to play in at least ten draws with better strike rates are Jeff Thomson, Brett Lee and Bruce Reid.
This analysis points to McDermott being a very good, if slightly expensive, strike bowler who took wickets regularly enough to allow his teams time to win matches.
Over the next four articles I will delve into some of our most famous bowlers, splitting them into four fairly arbitrary categories.
• The spinners: Shane Warne, Bill O’Reilly, Clarrie Grimmett, Richie Benaud, Stuart MacGill, Hugh Trumble, Ashley Mallett and Nathan Lyon.
• The attack leaders: Dennis Lillee, Glenn McGrath, Ray Lindwall, Garth McKenzie and Alan Davidson.
• The tearaways: Jeff Thomson, Brett Lee, Mitchell Johnson, Mitchell Starc and Keith Miller.
• The modern pace masters: Josh Hazlewood, Pat Cummins, Ryan Harris, Jason Gillespie, Stuart Clark and Peter Siddle.
Which tweaker was out most valuable player in wins? Watch out for the spin bowlers coming soon.
Build your own fantasy cricket team and put it to the test with Draftstars daily fantasy competitions. Pick your match, pick your team and watch the points roll in to take out cash prizes on each match. What are you really gambling with? Set a deposit limit.