


- Video
-
Club Roar
Captured a great grassroots sporting moment? We want to see it!Content Collections
The Roar Community
- Join
- Login
Opinion
Last time we examined our attack leaders and their performance in wins, so now let’s have a look at our crazy-eyed, vein-popping, nostril-flaring tearaways – the ones that put genuine fear into their opponents.
Compared to the attack leaders I expect to see lower strike rates, but also higher averages due to these guys being uninterested in keeping it tight.
Remember that the Peer Difference Percentage I talk about measures how a bowler performed compared to his teammates in the same matches.
Jeff Thomson
21 wins (41.2 per cent of all matches), 18 losses and 12 draws. Wins average 23.62 (peer difference: +7.5 per cent). Wins wickets per match 4.67.
The scariest of them all was Thommo. Particularly in his earlier years, those who saw him still rate him as the fastest there’s ever been. Thomson’s average in wins is unremarkable but still 7.5 per cent better than other bowlers in those matches. However, his strike rate of 45.5 is nearly 20 per cent better than his peers and ranks eighth all-time (minimum ten wins).
For the era, an economy rate of 3.1 was not great. The story this tells is that Thommo’s strike rate of a wicket of around every 7.5 overs gave his side time to take the 20 wickets necessary for victory.
Thomson struggled in losses. He had an average of 41.02. His economy rate was still high at 3.5 but he also could not keep his strike rate below 70. However, this bowling average is still 5.1 per cent better than his peers in those defeats and his strike rate is 17.5 per cent better.
For some reason, Thommo’s performance in draws is truly remarkable. In all three categories of bowling average (24.07), strike rate (49.4) and wickets per Test (4.42) he is the best of all-time (minimum ten draws). His Peer Difference Percentage for bowling average is plus-28.6 per cent and for strike rate it’s a brilliant plus-38.3 per cent.
Thommo for some reason is the draws champion (you might recall in last time’s article that the champion in wins is Dennis Lillee and in losses it’s Glenn McGrath).
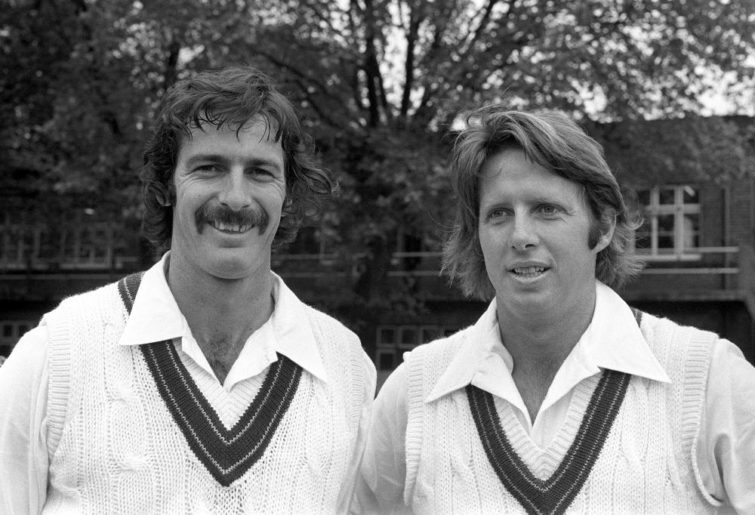
Dennis Lillee (left) and Jeff Thomson. (PA Images via Getty Images)
Brett Lee
54 wins (71.1 per cent of all matches), 11 losses and 11 draws. Wins average 27.52 (peer difference: -15.7 per cent). Wins wickets per match 4.17.
The only player to possibly rival Jeff Thomson for pace was Brett Lee. The most remarkable thing about Lee’s stats is the number of wins and especially a winning percentage of over 71 per cent. Lee sure played in some strong teams.
In terms of bowling average in wins, Lee’s contributions were nowhere near his fellow bowlers, which given they likely included McGrath and Shane Warne, is not very surprising. A Peer Difference Percentage of negative 15.7 per cent is not great. The only measure in which Lee was better than his peers in wins is strike rate. His strike rate of 49.1 was four per cent better than his peers.
This matches expectations for the extreme pace bowlers – a great strike rate offset by poor economy rate, but giving his team time to take 20 wickets. However, Lee’s strike rate is actually higher than the other express bowlers in this analysis.
In losses, Lee’s bowling average of 45.2 is just over 16 per cent worse than his peers and his strike rate in losses is virtually identical to the other bowlers in those matches. This means his economy rate was over 16 per cent worse, which is not ideal in close contests. With a minimum of ten losses, only 1960s attack leader Graham McKenzie in all of Australian history has a worse bowling average.
However in draws, like Jeff Thomson above, Brett Lee was very good. This is the only category where he moves into top-ten lists. His strike rate in draws of 59.6 and his 4.36 wickets per Test are second only to Thomson and oddly Lee took more wickets per Test in draws than in wins. Lee’s bowling average of 35.14 sounds pretty innocuous, but it was 29.8 per cent better than his fellow bowlers in those matches, which is the best Peer Difference Percentage of all time (minimum ten draws).
What is it with speed merchants and draws?
As a Queenslander, I just want to quickly check Lee’s winning performances against the two Sunshine State bowlers who most suffered from his continued selection: Andy Bichel and Michael Kasprowicz.
Lee: 27.52.
Kasper: 27.75 – so fair enough.
Bichel: 24.53 and with a better strike rate of 47.6. I’ll just leave it at that.
Mitchell Johnson
39 wins (53.4 per cent of all matches), 22 losses and 12 draws. Wins average 21.72 (peer difference: +12.9 per cent). Wins wickets per match 5.08.
These are seriously good numbers for Mitchell Johnson. More than five wickets per Test is very good, in fact the tenth best of all-time. An average under 22 as a fast bowler is excellent. A strike rate of 42.2 is truly elite. Only 19th-century bowler George Giffen and Australia’s greatest ever fast bowler Dennis Lillee do better. It is 17 per cent better than his fellow bowlers in those wins.
So when Mitch was good, he was very, very good. Anyone who saw the 2013/14 Ashes knows this. But the allegation is also that when he was bad he was awful. Let’s see.
In losses Johnson averaged 40.7, however, this was 8.7 per cent better than his peers and his strike rate of 67.5 was good. The problem was his economy rate of 3.61 (“he bowls it to the left”, etc).
In draws, Johnson had a nearly 15 per cent better bowling average than his peers. His strike rate was nearly 29 per cent better and is the fifth-best of all time in draws. His 3.75 wickets per Test ranks sixth. Again with the performances in draws by express bowlers!
So Johnson was a strike bowler in all circumstances and when he got it right he was unstoppable.
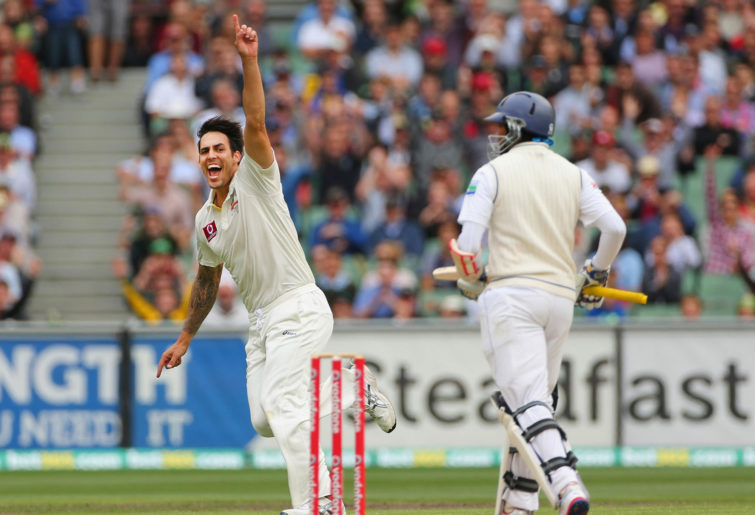
Mitchell Johnson. (Photo by Scott Barbour/Getty Images)
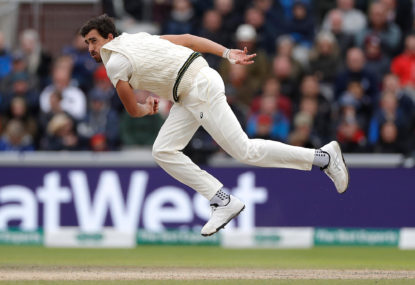
Mitchell Starc
31 wins (54.4 per cent of all matches), 20 losses and six draws. Wins average 23.39 (peer difference: -0.3 per cent). Wins wickets per match 4.65.
Let’s look at our current enforcer, Mitchell Starc. On raw numbers, Starc sits behind Mitchell Johnson, close to Jeff Thomson and well ahead of Brett Lee. But note that Peer Difference Percentage.
Unlike Thomson and Johnson who stood out among their teammates, Starc’s bowling average is almost exactly on par with his fellow bowlers in those victories. For Starc, much like the others in this analysis, it’s all about the strike rate. 43.1 is 14.3 per cent better than his peers. This mark is in between Johnson and Thomson, however both of these players have a higher Peer Difference Percentage than Starc’s – remember he competes against Josh Hazlewood and Pat Cummins, so this is hardly surprising.
On raw strike rate in wins, Starc sits fourth of all-time behind George Giffen, Dennis Lillee and Mitchell Johnson. So again, Starc’s ability to break through gives his teams time to push for victories.
Starc is not great in draws, with a bowling average of just under 44, although this is 7.3 per cent better than his peers, so this is certainly not a problem.
In losses, Starc really shines, making the all-time top ten for bowling average, strike rate and wickets per test. In terms of strike rate in defeats, Starc’s mark of 49.8 is the best in Australian history (minimum ten losses). Even if you drop the qualification to five losses, Starc is third behind only 19th-century bowler JJ Ferris, and interestingly, his current bowling partner Pat Cummins.
That strike rate is 26.5 per cent better than his peers. His Peer Difference Percentage for bowling average in losses of 17.4 per cent is actually the third-highest for any bowler, behind only late 1970s star, Rodney Hogg and the metronome himself, Glenn McGrath.
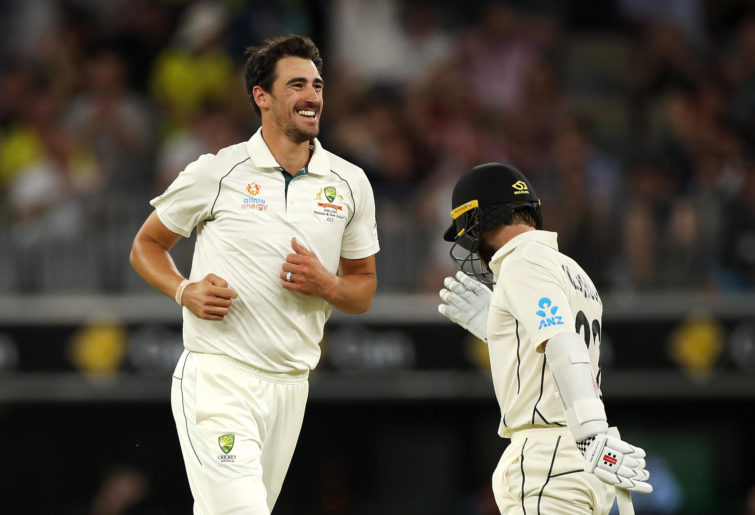
Mitchell Starc. (Photo by Cameron Spencer/Getty Images)
Keith Miller
31 wins (56.4 per cent of all matches), nine losses and 15 draws. Wins average 19.6 (peer difference: +10.8 per cent). Wins wickets per match 3.65.
Keith Miller doesn’t really fit in this company in terms of raw speed, although he was pretty sharp and didn’t mind dishing up the short stuff at all. I’ve placed him here as much on personality as anything else and I had to have him somewhere.
Miller’s average in wins of 19.6 is superb. It ranks him 12th all-time, just behind Garth McKenzie and just ahead of Pat Cummins. Compared to the speedsters above Miller has a much better economy rate but a higher strike rate and fewer wickets per test. This points to him being an excellent support bowler for Ray Lindwall rather than an out-and-out strike weapon.
A Peer Difference Percentage of nearly 11 per cent is excellent. And he could bat a bit!
In draws Miller only took 2.2 wickets per Test at an average of 35.2, which is almost exactly the same as his peers.
Miller really stood out in losses. His bowling average of 22.08 from nine matches is the third-best from anyone who participated in at least nine defeats, behind only 19th-century bowlers Charles Turner and Fred Spofforth. This mark is 32.6 per cent better than his teammates in these matches.
Next time we look at some more of our modern era bowlers and see who is the most valuable of the Big Three.
Build your own fantasy cricket team and put it to the test with Draftstars daily fantasy competitions. Pick your match, pick your team and watch the points roll in to take out cash prizes on each match. What are you really gambling with? Set a deposit limit.