Ryan Smith delighted to be off the nudie run after scoring in 50th cap for the Reds
It was a memorable night in more ways than one for the Queensland forward.
Opinion

Much has been said about the superiority of the New Zealand teams over the Australian teams.
A quick look at the events of Round 1 of Super Rugby Trans-Tasman might help us appreciate something of what really sets the two styles of play apart.
In principle, if we focus, for example, on the clash between Crusaders and Brumbies, we see that the Australians were more effective in the visits within 22 yards of their opponent than the recent champion from Aotearoa (+15.5 per cent ratio obtained based on quantity of visits to 22 yards of the opponent and tries conquered), although the general average of effectiveness decidedly favours the New Zealanders (56.5 per cent versus 37.3 per cent).
In contemporary rugby, we see that defences far exceed the performance of attacks, and the southern hemisphere is not on the fringes of this reality.
Returning to the analysis of Crusaders against Brumbies, we see that this match does not escape the exception: despite counting a total of nine tries scored between the two sides, the defences did their job, presenting ratios of 1.1 tackles of the defender for each carry by the attacker which explains, in a way, the relative parity in the conditions of the game and its reflection in the final score.
| Team | BLU | CHI | CRU | HIG | HUR |
|---|---|---|---|---|---|
| Own Tackles | 85 | 176 | 96 | 158 | 169 |
| Opponent Carries | 62 | 115 | 85 | 133 | 135 |
| Defensive Effectiveness | 1.4 | 1.5 | 1.1 | 1.2 | 1.3 |
| Team | BRU | FOR | REB | RED | WAR |
| Own Tackles | 98 | 82 | 81 | 105 | 129 |
| Opponent Carries | 89 | 59 | 96 | 99 | 130 |
| Defensive Effectiveness | 1.1 | 1.4 | 0.8 | 1.1 | 1 |
By focusing on set pieces, we see that the Brumbies scrum faced the Crusaders pack at 16 kilograms less in the sum and he paid dearly: more weight, greater dominance and more experience on the side of the New Zealanders tipped the balance in their favour in this facet of the fixed formations that has been gradually losing prominence since 2020.
At the breakdown, we verified the power of the New Zealand teams from the frequency of loss of balls in rucks.
In the case of the Crusaders and Brumbies, the New Zealand side granted one turnover for every 23 rucks executed, compared to one turnover for every 19 Brumbies rucks, making this relationship a general trend for both Kiwis and Aussies.
Otherwise, the effectiveness ratios in the ruck amply support the Kiwi teams.
While it is true that we expected greater prominence from the Kiwi franchises compared to those of Australia, the design of Super Rugby Trans-Tasman was probably decisive for the first round to show the technical superiority of the New Zealand sides’ model over the Australians’.
Although the Aussie teams lost all the games they played in this first round, the Western Force’s clashe against the Chiefs and Crusaders-Brumbies ended with meagre point differences of one and two points in favour of the Kiwi teams.
After all, the differences that exist may be much more apparent than real.
Let’s wait for the development of the tournament to monitor some extra indicators of attack, defence, breakdown and game management.
Join The Roar rugby editor Christy Doran, former Wallaby Matt Toomua and a cast of regular and special guests as they look at the biggest issues in the game on The Roar Rugby Podcast. If you’re looking for great odds on the next game check out Aussie bookmaker PlayUp. Chances are you’re about to lose. Set a deposit limit.
It was a memorable night in more ways than one for the Queensland forward.
The youngster was playing his first Super Rugby Pacific debut off the bench, but his game wasn't the main talking point after the game.
Is this a sign that rugby laws are getting too tricky, even for the players and commentators?
The kick of around 50 metres got the Reds well downfield!

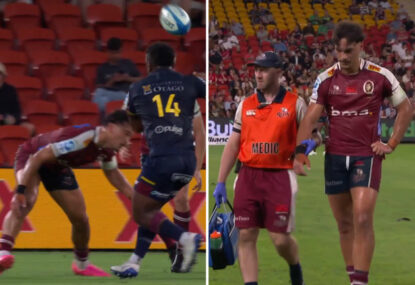
Wallaby Jordie Petaia is in doubt for the rest of the Super Rugby season, and potentially Australia's Test series against Wales, after suffering a…
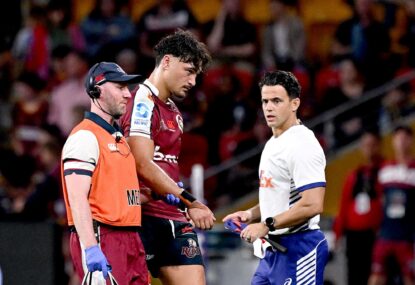
The Reds centre had to leave the field to get the shoulder popped in, with fears he will need several weeks on the sideline…