Try to picture a town of only 46,832 people.
According to Wikipedia, the closest real town to this in Australia is Gladstone (45,000), although NSW gets pretty close with Port Macquarie (49,000).
We could all quite easily picture this imaginary town of 46,832 people: one or two shopping centres, several schools, probably just one cinema and definitely a couple of sports teams per sport. That’d be about it. A cozy country town with just enough going on, but not too much.
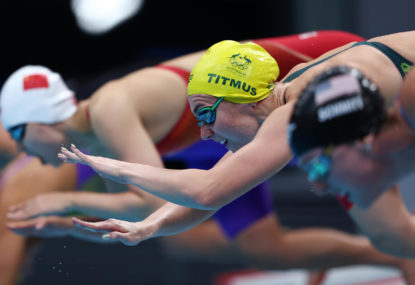
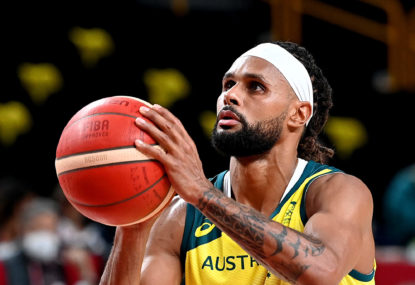
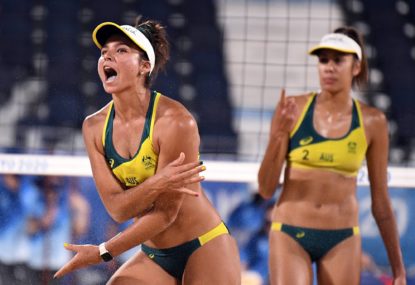
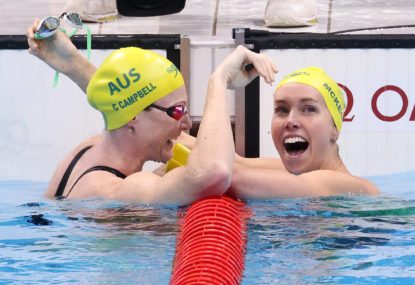
Well Australia has, on average, one top-eight Olympic athlete for every such 46,832-strong town. How impressive is that!
It means that whenever you drive through a town, suburb or community with that many people, you’re statistically guaranteed to be driving past at least one person with the physical prowess, talent and mental determination of the very best athletes in the world.
Australia must be pretty good then, mustn’t it? We’ve always been proud of punching above our weight, of outscoring the global behemoths per capita, and this proves it… right?
(Photo by Tom Pennington/Getty Images)
Well, surprise number two: we’re not even in the top ten for punching above our weight. Devastating I know, but unfortunately it means we can’t claim to be the greatest sporting underdogs.
All this comes from some amateur statistical analysis I’ve done on the recently completed Tokyo Olympics. I’ve always been underwhelmed with simply using gold medals or medals as indicators of a country’s Olympic performance – measuring only by gold medals completely ignores all the other sporting talent, while measuring by medal tally treats first and third as just the same. They also don’t make it easy to account for population.
So I created my own little point-scoring system. In this article I’ll quickly run you through how the point scoring works (very simple, I promise no complicated maths at all), show you the top and bottom ten countries for total points (Australia is in one of those, but which one?), and then finish with the real gold, the top and bottom ten for punching above their weight, a per-population analysis that reveals the definitive list of the best Olympic nations.
If people are interested I could do later articles where I reveal the winners and losers from the individual sports.
Point-scoring system
As I said above, I wanted to avoid using gold medals or medal tallies to measure performance. I wanted something that rewarded more than just one person’s high performance, but also recognised the differences between the best and the rest.
I settled on the top eight as those who deserved points. Eight is a convenient number for a lot of sports: the finalists in swimming events, finalists in many track and field events, and anyone who gets into the quarter-finals of the many sports that use knockouts. It doesn’t match perfectly with absolutely every sport (more on that in a bit), but it can be made to fit with all.
In terms of distribution of points, I started with one point for eight, and continued that margin of one point up to fourth place, which therefore earns five points. Then I thought that third and second places deserve a bit more reward, so their margin is 1.5 points more each time: 6.5 points for third and eight points for second. Then I thought the winner deserves just a bit more reward again, so with a margin of two points this means that first place earns ten points.
(Photo by Cameron Spencer/Getty Images)
So that’s the system: first place = ten points, second place = eight points, third place = 6.5 points, fourth place = five points, fifth place = four points, sixth place = three points, seventh place = two points, and eighth place = one point. Everyone else, no doubt you’re incredible humans for making it to the Olympics, but we’ve got to draw the line somewhere. The curse of ninth spot strikes again.
As I said, most sports slot into the system very smoothly. Rowing finals only have six in their race, but they’ve got a B final so I just took the two fastest finishers from that to complete the eight. The thornier problem came from sports with knockout structures, which is quite a lot. Obviously the semi-finalists (medallists and fourth place) were usually defined quite clearly, but places five to eight were not always. It varied quite a bit by sport.
Some sports, like rugby sevens, were very obliging and held separate matches to determine these lower placings. Thank you rugby, very helpful. Other sports didn’t, and held no more matches after the bronze medal match. For these my general approach was to use their margin of loss in the quarter-finals to determine places five to eight.
If they were still equal after that, my approach depended on the sport: sometimes going back to group performance, sometimes using unique aspects of that sport. If you’re interested in a particular sport, ask me in the comments and I’ll share my approach to that one.
So, enough of the background, let’s see some results!
Outright points
The ten countries with the most points from the Tokyo Olympics are as follows:
1. USA – 1291.5 points
2. China – 956
3. Russia – 790
4. GB – 740
5. Japan – 704
6. Australia – 544.5
7. Italy – 501
8. France – 454.5
9. Netherlands – 445
10. Canada – 340.5
(Photo by Bradley Kanaris/Getty Images)
I know Russia competed as ROC, but I’m calling them Russia. They still speak Russian, a lot of them still live in Russia and are probably still paid by Russia. A dog is a dog even if you call it a cat.
Anyway, let’s see how that compares to the traditional medal tally:
1. USA
2. China
3. Japan
4. GB
5. Russia
6. Australia
7. Netherlands
8. France
9. Germany
10. Italy
So Russia, Canada and Italy are beneficiaries of my system, jumping up two, two and three places respectively, while Japan and Netherlands are revealed as slightly overrated by a count of medals, dropping two places each. Germany was worst of all though, dropping from ninth to 18th. Yikes!
Some other notable changes outside the top ten are South Korea jumping up from 16th on the medal tally to 11th on my list and Cuba dropping from 14th on the medal tally to 21st on mine.
Overall though there weren’t too many radical changes between lists, which is good. I wasn’t trying to reinvent Olympic measurement, just to give more recognition to those countries with greater depth and spread of their talent, while also rewarding outright excellence.
(Photo by Li He/Xinhua via Getty Images)
My list does correspond slightly better to overall medals than the gold medal tally (recognising Russia as well as the considerable gap between USA and China) but even there it’s not identical – Germany has more medals than France and Netherlands but didn’t have as much depth below that, so they got punished on mine.
Actually before showing you the bottom ten, I’ll show you places 11-20. Some of these countries might become significant later on…
11. South Korea – 284 points
12. Hungary – 265.5
13. Spain – 259
14. Brazil – 251.5
15. Ukraine – 229
16. New Zealand – 215.5
17. Poland – 205.5
18. Germany – 181.5
19. Switzerland – 174
20. Turkey – 161.5
If you want the score of a particular country, again just ask in the comments and I’ll let you know.
Okay, onto the schadenfreude section where we look at the bottom ten. I can’t really compare this to the medal tally, because 93 countries got at least one medal while 123 countries got at least one point in my system.
Also, remember that these countries aren’t really the worst ten, because 82 counties didn’t even get a single point. So instead we’ll have a quick glance at these unlucky nations, give them a pat on the back and move on. From lowest to highest, as it were, here they are:
1. Senegal – one point
1. Guinea – one
3. Tanzania – two
3. Guinea-Bissau – two
5. Cameroon – three
5. Niger – three
5. Uruguay – three
5. Trinidad and Tobago – three
5. Tonga – three
10. Burundi, Haiti, Liberia, Eritrea, Mauritius, Montenegro – four
Interestingly, in the punching above their population analysis, several of these countries will fare quite poorly again, but one of these will actually be in the top ten. Hmm, who could that be…
(Photo by Stanislav Kogiku/SOPA Images/LightRocket via Getty Images)
Punching above their population
So here we go, the real meat of this promising pie we’ve only nibbled into so far. But first a quick rundown of how I did it.
I used 2021 population estimates for each country, and divided that by their number of points. This yields a people-per-point number, which is basically how many regular people there are for every Olympic top-eight finisher/finalist.
So a smaller number is better – as I described at the start, a good way to make sense of these numbers is to think of a town or suburb or, if it’s not a good number, a city with that many people, and there’ll be one Olympic top-eight finisher/finalist for every community of that size.
Thus, without further ado, introducing the ten definitive and definitely official best sporting nations in the world!
1. San Marino – 1616 people per point
2. British Virgin Islands – 6046
3. Bermuda – 6228
4. Grenada – 13,238
5. Bahamas – 16,385
6. New Zealand – 22,377
7. Jamaica – 23,689
8. Slovenia – 26, 825
9. Tonga – 35,232
10. Hungary – 36, 386
I bet you didn’t expect to see San Marino on top! San who? That other famed sporting nation, British Virgin Islands, isn’t even close!
Removing tongue from cheek, this obviously throws up some interesting results. There’s a clear Caribbean theme, and also a clear island theme – seriously small nations gain a distinct benefit from this system, and can rocket to the top of this list with just a couple of athletes.
San Marino’s points come from just two athletes (a wrestler who came third and a shooter who scored in two events) while the British Virgin Islands’ points come solely from Kyron McMaster, who came fourth in that insane 400-metre hurdles final.
(Photo by Etsuo Hara/Getty Images)
Nobody could doubt those individual athletes’ talents, but there will be an argument this list isn’t a true reflection of sporting-ness, that it disproportionately rewards very, very small nations.
That’s a fair criticism – it’s hard to say that a small handful of athletes is a reflection of a broader sporting system or culture. But before I suggest another measurement that might address that issue, I’ll show you two more lists.
Firstly, this is the punching above their population list, places 11-20, because I think we need some comforting after that San Marino upset:
11. Netherlands – 38,505 people per point
12. Denmark – 38,874
13. Georgia – 40,499
14. Croatia – 42,763
15. Australia – 46,832
16. Switzerland – 49,739
17. Fiji – 54,330
18. Latvia – 54,672
19. Norway – 55,889
20. Estonia – 56,448
Yay, we made it onto a list! There’s that good old imaginary country town of 46,832, nestled in between Croatia’s Traralgon-Morwell (according to Wikipedia) and Switzerland’s Port Macquarie. You can see it’s quite tight in places, between Netherlands and Denmark and Fiji and Latvia.
The next list is another interesting one, the bottom ten the punching below their population. Again, it’s not truly a list of the worst, because at these countries got some points. From worst to slightly better:
1. Tanzania – 29,867,109 people per point
2. Pakistan – 27,611,543
3. Vietnam – 19,467,716
4. Senegal – 16,743,927
5. India – 16,727,326
6. Guinea – 13,132,795
7. Nigeria – 10,055,590
8. Cameroon – 8,848,621
9. Niger – 8,068,881
10. Peru – 5,495,309
(Photo by Sebastian Gollnow/picture alliance via Getty Images)
Those numbers from Tanzania and Pakistan in particular are eye-watering – you could go through to entire population of Australia and not find a single Olympic finalist. Ouch. Peru was a surprise for me, I always thought of them as generally fairly sporty. They’ve got a big population but not massively so (33 million).
The other countries aren’t too surprising I guess: absurdly big and/or not very rich. It makes sense: if your country’s resources and quality of life are a bit thin on the ground, sport is understandably not high on your priority list. If anyone’s interested I could have a crack at analysing the countries by GDP or GDP per capita, that would probably shake up this list.
One more thing before moving on to the final list. In this list of 123 countries ranked by people per point, there’s obviously quite a range – from San Marino’s tiny country town’s worth of 1616 to Tanzania’s country’s worth of nearly 30 million.
The median of all these countries (median being the best way to find the average with such outliers) is Botswana, with 247,540 people per point, and you might be interested to know that right next to them, with 256,293 people per point, is USA! How about that, almost perfectly average!
I think we should all stand and raise a toast to a country with such a commitment to being so very average, jolly well done. Roughly one Olympic finalist for every Geelong-sized town, whodathunkit.
So who is the best?
Okay, the final section. Some of you might still be grumbling about a system which overly rewards tiny islands nations, and some might just be wanting to see Australia on top of something, anything. Let’s see what we can do.
My potential solution to not disadvantage large, high-scoring countries is to take the overall top point scorers, then sort them by their people per point score. It becomes a bit arbitrary how many you include, because if you keep letting countries in you’ll just end up back where you started, with all the countries ranked by people per point.
But it should do, as it demands that a country have some significant impact on the sporting world before making allowances for its size.
(Photo by Alexander Hassenstein/Getty Images)
For this final list I’ve gone with the top 15, plucked out of nowhere simply because we came 15th in the punching above their population list.
So here we go, the top 15 overall point scorers ranked by their people per point score, and therefore the definitive, this-time-the-definitely-best sporting nations in the world!
1. Hungary – 36,386 people per point
2. Netherlands – 38,505
3. Australia – 46,832
4. GB – 92,277
5. Canada – 110,843
6. Italy – 120,682
7. France – 143,616
8. Japan – 179,654
9. Spain – 180,520
10. South Korea – 180,525
11. Russia – 184,727
12. Ukraine – 190,977
13. USA – 256,293
14. Brazil – 845,167
15. China – 1,505,569
Damn, still not on top! Ah well, at least we made the podium, and we like the Hungarians, so it’s not too bad. And just quietly, the other positive is that we beat the Kiwis! (Only just though – they came 16th on the overall points and had by far the best people per point score of these countries. Oh well, what a shame.)
If you want to know the numbers of any particular country then hit me up in the comments, otherwise I hope you enjoyed this nerdy dive into the Olympics!


