


- Video
-
Club Roar
Captured a great grassroots sporting moment? We want to see it!Content Collections
The Roar Community
- Join
- Login
Opinion
Unfortunately, the article never even made it to first base as I was told in no uncertain terms that my premise was false.
Undeterred, this follow-up piece begins on firmer terrain because at least two Roarers have asserted the myth now under scrutiny, that is, that the batting average has been constant since 1920. Therefore, if challenged this time, the rebuttal will require no more than a cut and paste.
To be candid, this proposition has always struck me as suspicious, after all, haven’t the most stupendous batting achievements been registered in the 1920s and ’30s?
For example, despite 170 years of Australian first-class cricket, a score of 400 has only been achieved three times and all these instances came in the ’20s and ’30s (Bill Ponsford 1923 and 1927, and Bradman in 1930).
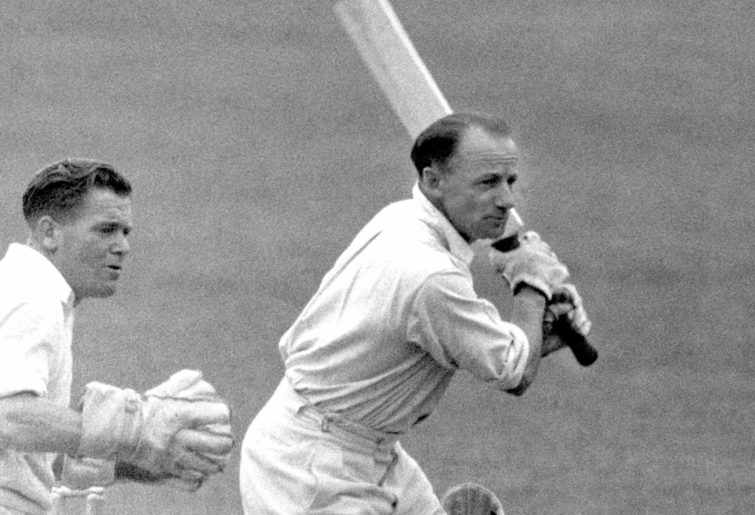
(PA Images via Getty Images)
The Sheffield Shield has been running since 1892 and in this time, three batsmen have managed to maintain an average above 70, and you guessed it, they all played in the 1920s and ’30s (Ponsford 83.3, Alan Kippax 70.1 and Bradman 110.2).
In Ashes cricket, only four teams have managed to reach a total of 675, now when do you think they occurred? There are absolutely no prizes for saying in the ’20s and ’30s. In fact, at this time, the conditions in England were so heavily stacked in favour of batsmen that a total approaching 700 became de rigueur.
Consider the four tours in question:
1926: England reached 3-475 (third Test)
1930: Australia reached 6-729 (second Test) and Australia reached 695 (fifth Test)
1934: England reached 9-627 (third Test) and Australia reached 701 (fifth Test)
1938: England reached 8-658 (first Test) and England reached 7-903 (fifth Test)
Wow! that makes seven occasions in only 18 matches. As England were to discover in 1930, this was an era when you could start off with a score of 400 and find yourself in serious trouble.
Therefore, when I heard the claim that batting averages have been constant since 1920, I thought, ‘here is a myth that needs debunking’. The table below outlines the batting averages of the top order (first seven batsmen) in the first innings of an Ashes match, broken down by era.
| Era | 100s | Innings | 100s % | Average |
|---|---|---|---|---|
| 1877-1895 | 26 | 610 | 4.3% | 24.71 |
| 1896-1910 | 31 | 602 | 5.1% | 30.32 |
| 1911-1925 | 17 | 255 | 6.7% | 35.77 |
| 1926-1940 | 61 | 470 | 13.0% | 48.09 |
| 1945-1969 | 67 | 845 | 7.9% | 36.99 |
| 1970-1985 | 48 | 760 | 6.3% | 33.26 |
| 1986-1999 | 66 | 640 | 10.3% | 41.61 |
| 2000-2020 | 73 | 780 | 9.3% | 40.21 |
As you might have suspected, the 1926-40 era stands out like a giraffe in a polar-bears-only golf club. Averages in this Bradman era are 34.5 per cent higher than for the previous era, and 30 per cent higher than for the subsequent era.
But wait, there’s more! The next table uses the same filters: top order, Australia versus England, first innings, however this time the games are played in England.
| Era | 100s | Innings | 100s % | Average |
|---|---|---|---|---|
| 1877-1895 | 11 | 225 | 4.9% | 24.25 |
| 1896-1910 | 17 | 318 | 5.3% | 28.10 |
| 1911-1925 | 4 | 108 | 3.7% | 31.92 |
| 1926-1940 | 38 | 255 | 16.1% | 53.13 |
| 1945-1969 | 29 | 423 | 6.9% | 34.48 |
| 1970-1985 | 27 | 380 | 7.1% | 33.57 |
| 1986-1999 | 37 | 340 | 10.9% | 42.70 |
| 2000-2020 | 35 | 425 | 8.2% | 37.27 |
Now, averages in the Bradman era are 67 per cent higher than for the previous period and 54 per cent above the ensuing period. Furthermore, this Bradman era average is 25 per cent above any other era in history.
Also, consider how the following ten batsmen all averaged 70 in the first innings of an Ashes match in England (minimum three Tests): Len Hutton 138, Don Bradman 127, Eddie Paynter 114, Bill Ponsford 81, Charlie Macartney 81, Kumar Duleepsinhji 78, Maurice Leyland 74, Bill Brown 71, Warren Bardsley 70, Arthur Chipperfield 70.
In this epoch, it is not an exaggeration to say that half the top order was averaging at least 70 – half of them!
And do not think for a moment that there was something wrong with the bowlers because when given a fair chance on a wicket that contained a little grass – fancy that, a pitch with some grass – as they had in the Trent Bridge Tests of 1930 and 1934, and the Leeds Test of 1938, only three batsmen would reach 80 in those three Tests (from a combined 84 attempts: Bradman 131 and 103, Stan McCabe 88, and Chipperfield 99).
So, this was not an era of freak, superhuman batsmen but rather a period in cricket history when wicket preparation was regularly taken to an extreme. Consider the feelings of Bill O’Reilly, Leslie Fleetwood-Smith, Hedley Verity or Ken Farnes when they had to front up at the Oval in 1938, knowing that the last two games here had produced first innings scores of 695 and 701.
As it happened, it was O’Reilly and Fleetwood-Smith who would be put to the sword to the tune of 7-903 (with one run out!).
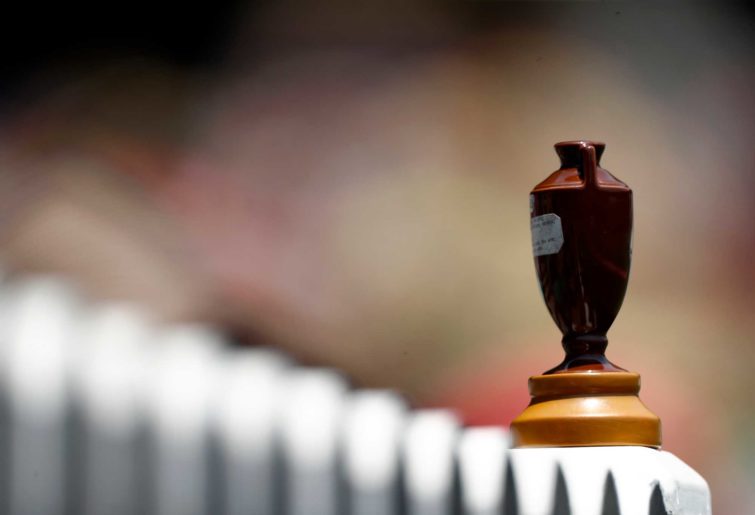
(Photo by Ryan Pierse/Getty Images)
Envision the most lifeless, yellowish strip of turf at Peshawar, the type of deck where even the fastest of bowlers cannot get the ball above stump height. Visualise the batsmen coming forward with impunity as they nullify any lateral movement.
You can see the spinners bowl for hour after hour under a baking sun, with barely the hint of a breeze. The ball turns slowly and there is plenty of time for batsmen to stay on the back foot and read the ball off the pitch.
Once a batsman is set, the only way to get out is to do something dumb. You see the hundreds go up on the scoreboard one after the other: Mark Taylor 334, Justin Langer 116, Saeed Anwar 126, Ijaz Ahmed 155, and then poor old Inzamam-ul-Haq is dismissed on 97.
Before a ball is bowled, 90 per cent of the public believes the game will finish in a draw, and after the first day concludes with Australia 1-224, the last of the doubting Thomases are convinced. And what a first day, Michael Slater is dismissed in the first half hour and then for the next five and a half hours, when the deck was at its liveliest, not a single wicket fell.
This is what I imagine it was like playing cricket on the Kennington Oval in the 1930s, a batsmen-bowler contest where the dice were well and truly loaded.
Is it going too far to say that under these lop-sided conditions, facing England’s best was no more difficult than facing Zimbabwe on a spicy pitch? You certainly would not expect Australia to make 700 against the Zimmers on a wicket that was doing a bit.
For this reason, I have struggled to exalt the monster hundreds made in England during this period: Ponsford’s 266 and 181, Paynter’s 216*, Hutton’s 364, Leyland’s 187 and 153, Brown’s 206, and of course, Bradman’s quintet of 334, 304, 254, 244, and 232.
Should marks be deducted when a performance is delivered on a wicket like those at the Oval in the 1930s? After 150 or so, aren’t the bowlers delivering the same stuff while the captain has exhausted his entire bag of tricks?
Greg Chappell once likened batting to an examination – a test where each delivery represents a new question.
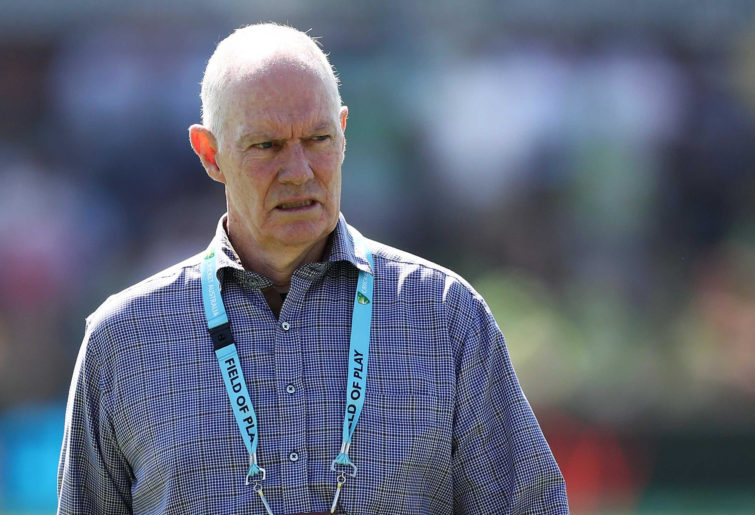
(Photo by Matt King – CA/Cricket Australia/Getty Images)
If this depiction is true, then could I say that batting at the Oval in the 1930s was like answering the same set of easy questions, over and over? As a mathematics teacher, I wouldn’t make a big distinction between a score of 40/40 and one of 200/200 if the questions were all of the same standard.
On the other hand, I would become enthused if the same student scored 30/40 in an extremely difficult exam. Kim Hughes’ 100 not out is exactly this type of performance, he made a few mistakes in an exceedingly difficult exam.
Conversely, Ponsford’s 266 at the Oval is the cricket equivalent of 200/200 in a simple test, as the same easy questions were dispatched with mechanical perfection. For me, these two performances are light years apart in terms of impact and cailbre.
Returning to the topic at hand, on the query of whether batting averages have remained constant since 1920, the evidence seems to be overwhelming, particularly under English conditions.
So how did this myth come into existence? My guess is that well intentioned enthusiasts have conducted analyses using the stats guru search engine, typed in: ‘batting averages, top order, era XYZ’ and hey presto! The averages appear constant.
This type of analysis fails to consider the presence of other variables that may have been specific to one era.
Would the introduction of Test cricket novices the West Indies, New Zealand and India have an effect on the overall batting averages? Would an increase in the number of matches played by the relatively weak South Africans have an effect? Both these events occurred in the Bradman era.
The debut of the West Indies, New Zealand and India came to pass in 1928, 1930 and 1932, respectively. In addition, the South Africans were a stronger side in the period 1900-1910 when compared to 1930-40 and yet, it was the second cohort who played the most Test cricket, 2.7 Tests per year versus 1.7.
The West Indies, on their first Test tour of England in 1928, registered first innings scores of 177, 206 and 238. New Zealand and India hardly did any better on their first tours: New Zealand: 224, 193; India: 189.
Meanwhile, on the same wickets, the Poms were racking up scores of 400-plus in almost every match. So, tell me Roarers, has the batting average remained constant since 1920?
Build your own fantasy cricket team and put it to the test with Draftstars daily fantasy competitions. Pick your match, pick your team and watch the points roll in to take out cash prizes on each match. What are you really gambling with? Set a deposit limit.