


- Video
-
Club Roar
Captured a great grassroots sporting moment? We want to see it!Content Collections
The Roar Community
- Join
- Login
Opinion
As the 2021 AFL season finished up last Saturday, many in the AFL world were basking in the red and blue light of Melbourne’s victory and the future dynasty that might ensue for the next five years.
During this time of the grand final aftermath, we often overlook the runners up – in this case the Western Bulldogs, who for two and a half quarters were well in the game. And if not for a white-hot Melbourne side, we might have seen Chris Grant pass the premiership cup to Luke Beveridge and Marcus Bontempelli.
For now, Western Bulldogs fans look towards 2022 with great aspirations that they can use this heartbreaking loss to motivate themselves to premiership glory.
Unfortunately, the last 30 years have shown us a sinister fall for the runners up, so Bulldogs fans, you might want to look away.
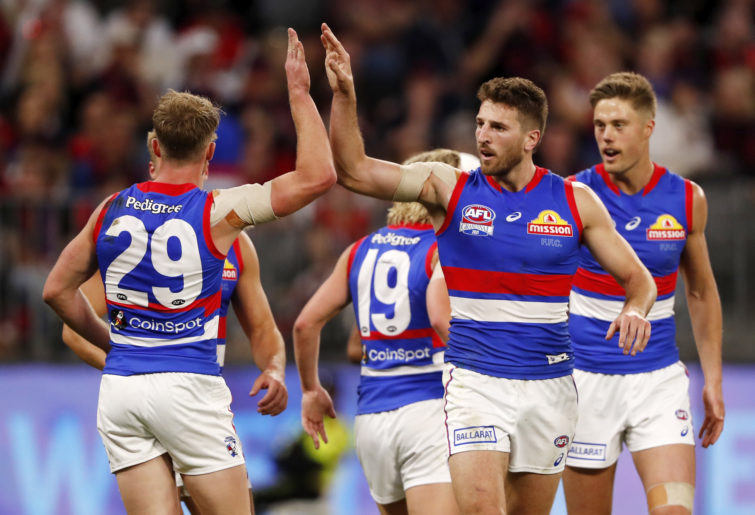
(Photo by Dylan Burns/AFL Photos via Getty Images)
The last 30 years have seen incredibly close grand finals with 2002, 2005, 2006, 2010 and 2018 all springing to the mind of footy fans.
We have also had grand finals blowouts with the margins being bigger than Ben-Hur with 1994, 2000, 2003, 2010 (replay), 2019 and the infamous 2007 grand final between Geelong and Port Adelaide springing into mind and giving PTSD for those fans on the receiving end.
While the teams who play in them and the margins in these games couldn’t be more different, the results of the season after for these runners up all have a striking similarity.
Runners up don’t tend to do well the season after making in some cases a long-awaited grand final appearance.
While this trend has become more common in time with Adelaide and GWS being prime examples of this statistic, there are far more examples of these statistics being right, which spells trouble for the Bulldogs.
Runners ups in grand finals since 1990 on average lose 3.26 positions regardless of whether the game is close or a blowout, which using the Bulldogs’ ladder position this year (fifth) would place them eighth on the ladder in 2022.
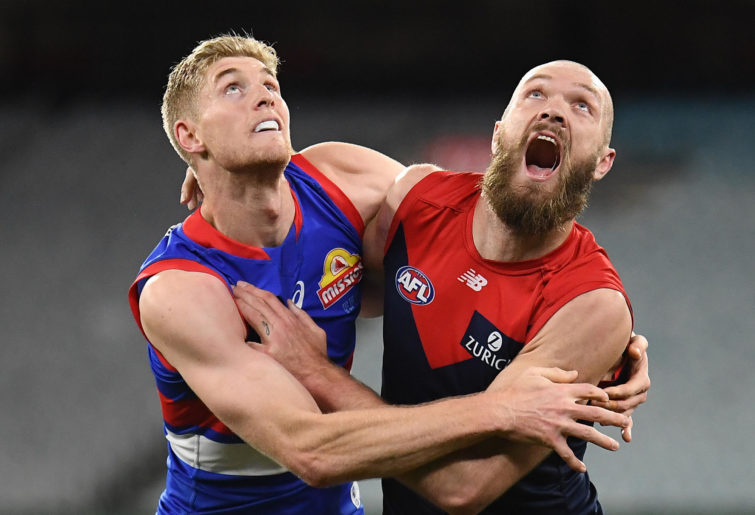
(Photo by Quinn Rooney/Getty Images)
However, this stat gets even worse for Bulldogs fans. Teams who lose by 50-plus points or more in a grand final – as the Dogs did on Saturday – on average lose 5.11 positions, which using this stat would place the Bulldogs tenth on the ladder, potentially making the Dogs the third team in five years to miss out on finals after making the grand final the year before.
While the Bulldogs will still play in September next year, this still should be deeply concerning for supporters of the red, white and blue.
We have seen these sorts of losses set back clubs for years with Port Adelaide falling into mediocrity until Ken Hinkley’s resurgence in 2014 and its rejuvenation last year. Adelaide are now in the middle of a rebuild due to their response to their loss, which saw the club fall on the ladder. And Greater Western Sydney surprisingly fell out of the finals last year only to rebound this year.
All these fans can attest to these results hurting the club in recent years.
While there have been examples of teams able to redeem their grand final losses with West Coast in 1992 and 2006, North Melbourne in 1999, Geelong in 2009 and Hawthorn in 2013 all came back to redeem themselves the year after losing the year prior proving to be the exceptions to the rule.
But that’s the thing, they are exceptions. While there are examples of this, for every example of this, there are teams that prove this stat to be true.
For every West Coast in 2005 and 2006, there is a Collingwood of 2002 and 2003. For every Geelong in 2008 and 2009, there is a St Kilda of 2009 and 2010. For every Hawthorn in 2012 and 2013, there is a Geelong of 1994 and 1995 and the list goes on.
So, to you Bulldogs fans, I’ll warn you with this: not every grand finalist can redeem their mistakes. So enjoy your team’s grand final appearance regardless of the result as there might be a fair few drinks in between.
| Year | GF loser | GF margin | GF year ladder position | Post-GF year ladder position | Ladder position change |
|---|---|---|---|---|---|
| 1990 | Essendon | 48 points | First | Sixth (lost elimination final) | -5 |
| 1991 | West Coast | 53 points | First | Fourth (won grand final) | -3 |
| 1992 | Geelong | 28 points | First | Seventh (missed finals) | -6 |
| 1993 | Carlton | 44 points | Second | Second (lost semi-final) | 0 |
| 1994 | Geelong | 80 points | Fourth | Second (lost grand final) | +2 |
| 1995 | Geelong | 61 points | Second | Seventh (lost grand final) | -5 |
| 1996 | Sydney | 43 points | First | Sixth (lost qualifying final) | -5 |
| 1997 | St Kilda | 31 points | First | Sixth (lost semi-final) | -5 |
| 1998 | North Melbourne | 35 points | First | Second (won grand final) | -1 |
| 1999 | Carlton | 35 points | Sixth | Second (lost preliminary final) | +4 |
| 2000 | Melbourne | 60 points | Third | 11th (missed finals) | -8 |
| 2001 | Essendon | 26 points | First | Fifth (lost semi-final) | -4 |
| 2002 | Collingwood | Nine points | Fourth | Second (lost grand final) | +2 |
| 2003 | Collingwood | 50 points | Second | 13th (missed finals) | -11 |
| 2004 | Brisbane | 40 points | Second | 11th (missed finals) | -9 |
| 2005 | West Coast | Four points | Second | First (won grand final) | +1 |
| 2006 | Sydney | One point | Fourth | Seventh (lost elimination final) | -3 |
| 2007 | Port Adelaide | 119 points | Second | 13th (missed finals) | -11 |
| 2008 | Geelong | 26 points | First | Second (won grand final) | -1 |
| 2009 | St Kilda | 12 points | First | Third (lost grand final) | -2 |
| 2010 (replay) | St Kilda | 56 points | Third | Sixth (lost elimination final) | -3 |
| 2011 | Collingwood | 38 points | First | Fourth (lost preliminary final) | -3 |
| 2012 | Hawthorn | Ten points | First | First (won grand final) | 0 |
| 2013 | Fremantle | 15 points | Third | Fourth (lost semi-final) | -1 |
| 2014 | Sydney | 63 points | First | Fourth (lost semi-final) | -3 |
| 2015 | West Coast | 46 points | Second | Sixth (lost elimination final) | -4 |
| 2016 | Sydney | 22 points | First | Sixth (lost semi-final) | -5 |
| 2017 | Adelaide | 48 points | First | 12th (missed finals) | -11 |
| 2018 | Collingwood | Five points | Third | Fourth (lost preliminary final) | -1 |
| 2019 | GWS | 89 points | Sixth | Tenth (missed finals) | -4 |
| 2020 | Geelong | 31 points | Fourth | Third (lost preliminary final) | +1 |
In 1994, the finals systems was expanded to eight teams, with the expansion to 16 teams in the league.
Who’s in your ultimate team? Pick the best team and compete with other fans for daily prizes on Draftstars. For the best odds on the game try out Aussie bookmaker PlayUp. Think. Is this a bet you really want to place? Set a deposit limit.