


- Video
-
Club Roar
Captured a great grassroots sporting moment? We want to see it!Content Collections
The Roar Community
- Join
- Login
Opinion
In addition to an obsession with rugby league, I’m afflicted with a love of association football.
It’s as if being a St George Illawarra supporter doesn’t give me enough frustration and disappointment.
I was recently prompted to recall a couple of my favourite things about Spanish football and the game’s vivid history by Nico’s informative article about the historical significance of rugby league’s City Cup.
First, there’s the historical classification, a record of every La Liga team’s performance since 1929 collated by Madrid-based tabloid Marca, an up-market version of The Daily Telegraph.
Real Unión, a small club from the northern border town of Irun, haven’t played in La Liga for 90 years, but their record is lovingly maintained, even though the chances of them ever resurfacing from the murky depths of the lower leagues are slim at best.
They’re a club of historical significance – founding members of La Liga and four-time King’s Cup winners – and it’s only right they’re recognised.
Second is the story of Levante who, along with sympathetic local politicians and officials, fought for years to have a cup title won during the Spanish Civil War recognised in the game’s official records.
Levante eventually succeeded and Spanish football’s keen sense of history is showing no signs of waning.
Which got me wondering what would a rugby league historical classification look like and how could some of the game’s lesser known and valued achievements be recognised?

(Photo by Fox Photos/Getty Images)
Rugby league’s historical classification includes every regular season and finals game from the New South Wales Rugby League (NSWRL), ARL, Super League and NRL.
Between 1912 and 1925, the NSWRL premiership was generally awarded on a first-past-the-post basis, with the occasional final played as a tiebreaker.
The City Cup acted as a quasi-finals series and the tournament’s popularity eventually saw it expand into a league format of its own.
In the early 1920s, winning the City Cup was arguably a more significant achievement than winning the league.
City Cup results between 1912 and 1925 are included, along with the results of the 1937 edition when the premiership was cut short by the Kangaroo tour.
City Cup titles until 1937 are recognised alongside premierships. Given I’m a football supporter, it won’t surprise you to know I value league position highly. Therefore, minor premierships are also recognised.
I’ve recognised a total of 230 titles across 115 seasons. The four tiebreaker finals of 1916 and 1922-24 are included, with Melbourne having vacated four titles won between 2007 and 2009.
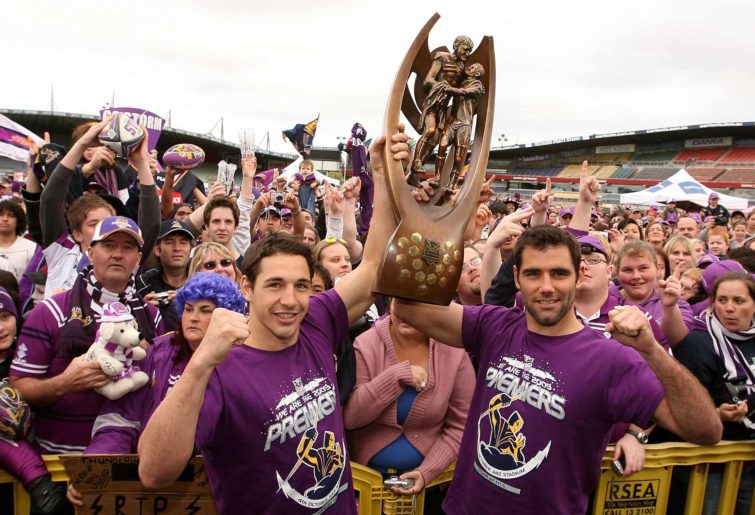
(Photo by Robert Prezioso/Getty Images)
A team’s place in the historical classification is not decided by competition points accrued, or on a points-per-game basis.
The former method would mostly be a measure of longevity, while the latter method is prone to over valuing performance in small samples.
Another method is needed, and it comes in the shape of the weighted historical averages metric, or WHAM.
The WHAM method
WHAM is based on four performance measures. The first two, win percentage and percentage of competition points gained, are self-explanatory and carry the heaviest weightings.
The third measure is title percentage. Easts, for example, have won a title of some sort in just under 30 per cent of their seasons played to date.
The fourth measure is expected win percentage. This is a version of points differential but, unlike the traditional measure, it’s points for and against compared to the historical value of point-scoring.
The aggregate data over 115 seasons tells us that scoring more than 35 points in any given game guarantees victory, assuming no wild fluctuations from the mean. Conceding 17 points per game leaves a team with a 50-50 chance of victory. Expected win percentage is based on these markers.
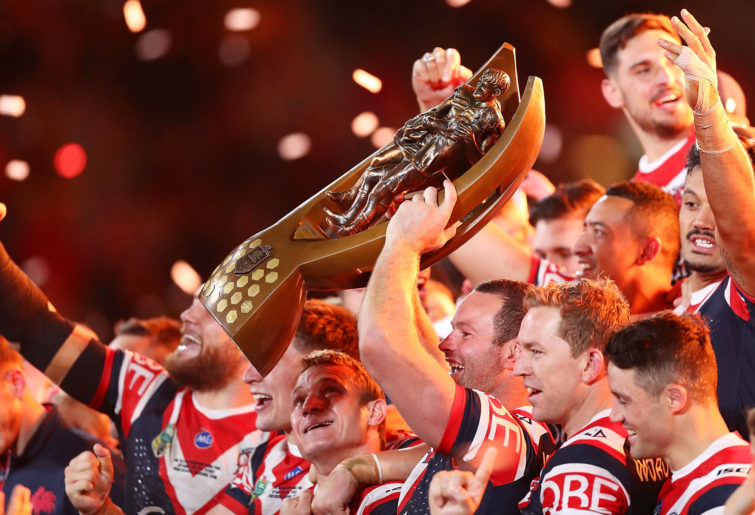
(Photo by Mark Metcalfe/Getty Images)
The rugby league historical classification
Unsurprisingly, after winning two thirds of their games since joining the NRL in 1998, claiming ten titles and almost matching their expected win percentage (which is truly scary in the modern era), Melbourne leads the historical classification.
St George rode their extraordinary peak of 1955 to 1967 into second place, with 22 titles, an 80 per cent win percentage and a positive differential of nearly 3000 points over just 13 seasons.
Souths’ extended period of mediocrity between their last two premierships has seen them slip slightly behind their eternal rivals Easts, who’ve been much better on average for the past 50 years.
Everybody’s favourite reclamation project, North Sydney, lost almost 60 per cent of their games and finished behind every team that’s played at least 20 seasons at the top level. I’ve heard bringing them back is imperative. I’m not sure why.
For the sake of simplicity, I’ve combined win and competition points percentage into a single measure as they carry the same weighting.
| Team | Win/points % | Expected win % | Title % | WHAM |
|---|---|---|---|---|
| Melbourne | 66.90 | 68.61 | 41.67 | 62.03 |
| St George | 58.98 | 49.71 | 38.46 | 53.95 |
| Brisbane | 59.57 | 63.68 | 29.41 | 53.95 |
| Manly | 57.44 | 55.62 | 23.61 | 50.49 |
| Easts | 54.49 | 50.58 | 29.82 | 49.17 |
| Souths | 53.10 | 49.17 | 34.82 | 49.05 |
| Glebe | 55.86 | 37.95 | 9.09 | 44.72 |
| Balmain | 52.04 | 43.98 | 17.39 | 44.31 |
| Canterbury | 51.36 | 48.61 | 17.24 | 44.26 |
| Canberra | 51.36 | 61.34 | 10.00 | 44.09 |
| St George Illawarra | 49.83 | 59.50 | 13.04 | 43.44 |
| Cronulla | 48.86 | 51.76 | 5.45 | 40.47 |
| Newcastle Knights | 47.55 | 57.07 | 5.88 | 40.17 |
| Parramatta | 46.72 | 49.23 | 12.00 | 40.03 |
| Penrith | 45.15 | 52.25 | 10.91 | 39.01 |
| Newtown | 45.64 | 40.58 | 13.16 | 38.64 |
| New Zealand | 45.34 | 58.35 | 3.70 | 38.32 |
| Wests | 44.10 | 41.88 | 13.04 | 37.67 |
| Wests Tigers | 42.97 | 58.15 | 4.55 | 36.80 |
| Newcastle Rebels | 45.00 | 41.64 | 0.00 | 35.66 |
| North Queensland | 41.49 | 57.01 | 3.70 | 35.49 |
| Norths | 41.89 | 42.50 | 5.43 | 34.66 |
| Northern Eagles | 39.80 | 58.77 | 0.00 | 33.74 |
| Gold Coast Titans | 40.40 | 53.70 | 0.00 | 33.65 |
| Hunter | 38.89 | 54.90 | 0.00 | 32.71 |
| Western Reds | 39.75 | 46.05 | 0.00 | 32.43 |
| Illawarra | 39.46 | 47.15 | 0.00 | 32.34 |
| Adelaide | 31.55 | 46.79 | 0.00 | 26.76 |
| Gold Coast-Tweed | 22.46 | 37.70 | 0.00 | 19.49 |
| South Queensland | 20.38 | 36.66 | 0.00 | 17.94 |
| University | 21.29 | 28.29 | 0.00 | 17.73 |
| Annandale | 16.87 | 19.36 | 0.00 | 13.75 |
| Cumberland | 12.50 | 13.41 | 0.00 | 10.09 |
WHAM in the NRL era
Here are the WHAM ratings for all current NRL clubs from 1998 to 2021.
It’s based on the same method as the historical classification, but the markers underpinning expected winning percentage have been adjusted to reflect the value of points in the modern era. Forty-three points should guarantee victory. Twenty-one points conceded is the tipping point in terms of win probability.
The numbers from the NRL era indicate brief booms and extended busts for most clubs. It’s hard to get to the top and it’s almost impossible to stay there for long.
| Team | Win/points % | Expected win % | Title % | WHAM |
|---|---|---|---|---|
| Melbourne | 66.90 | 56.52 | 41.67 | 60.82 |
| Easts | 57.78 | 53.97 | 37.50 | 53.35 |
| Brisbane | 55.69 | 51.86 | 20.83 | 48.34 |
| Manly | 52.92 | 52.10 | 9.52 | 44.16 |
| Penrith | 50.75 | 50.93 | 16.67 | 43.95 |
| Canterbury | 51.76 | 48.85 | 8.33 | 42.79 |
| St George Illawarra | 49.83 | 49.01 | 13.04 | 42.39 |
| Parramatta | 50.50 | 48.37 | 8.33 | 41.85 |
| Cronulla | 49.04 | 47.54 | 8.33 | 40.75 |
| Canberra | 48.25 | 51.22 | 0.00 | 38.89 |
| Newcastle | 46.77 | 49.64 | 4.17 | 38.54 |
| Souths | 45.60 | 48.73 | 4.55 | 37.71 |
| New Zealand | 44.95 | 47.96 | 4.17 | 37.09 |
| North Queensland | 43.45 | 48.30 | 4.17 | 36.08 |
| Wests Tigers | 42.97 | 47.90 | 4.55 | 35.78 |
| Gold Coast | 40.40 | 44.24 | 0.00 | 32.70 |
Reckon you can pick the winning team? Build your own dream team with Draftstars daily fantasy and compete on any match. For great odds on the NRL head on over to PlayUp. Imagine what you could be buying instead. Set a deposit limit.