


- Video
-
Club Roar
Captured a great grassroots sporting moment? We want to see it!Content Collections
The Roar Community
- Join
- Login
Opinion
Another season’s done and history has been made.
Penrith won the premiership trophy for the second consecutive year, after also taking the JJ Giltinan Shield a few weeks back. Cronulla and North Queensland made strides toward future premiership contention.
The bottom fell out of Newcastle and the Gold Coast. Wests hit rock bottom. After a poor start, Canterbury briefly became the entertainers again. St George Illawarra rose into a slightly different class of mediocrity.
We’ve had four Prime Ministers since the last time Melbourne failed to qualify for a preliminary final. As for Brisbane, who knows? All does not appear well at Red Hill.
While I’ve long advocated players going on strike over poorly designed jerseys, the Manly kerfuffle wasn’t what I had in mind.
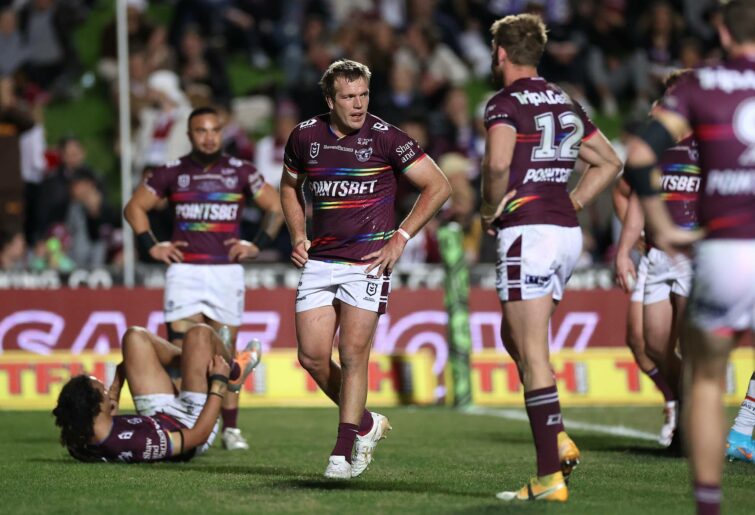
(Photo by Cameron Spencer/Getty Images)
But what does all this mean in the much broader scheme of things? Earlier this year, I debuted the weighted historical averages metric (WHAM) on The Roar to decide who is the greatest team of them all.
WHAM is a measure of every team’s performance across their entire history, with weighted averages used to arrive at a ranking of every team, active and defunct, since 1908. I’ve also developed rankings of every active team during the NRL era (1998-present), as well as compiled the raw data.
I’ve updated WHAM – both the all-time and NRL era rankings – to reflect results from the 2022 season. Eagle-eyed readers will note that there’s been a methodological change. After peer review by the Institute of Dubious Rugby League Ranking Systems, I’ve changed the formula underpinning ‘expected winning percentage’.
Rather than measuring teams against the virtual certainty of a win (scoring 35.5 points), I’m measuring them against the likely probability of a win (26.6 points). You might still lose from that footing, but you really shouldn’t.
The all-time historical classification after 2022
Not surprisingly, the Cumberland Fruitpickers haven’t managed to move off the bottom, mainly because they’ve been defunct for 114 years. They really do need to get their act together. Where’s the Central Cumberland expansion proposal?
At the other end, Melbourne are still well on top. Even if the Storm were to go into a deep decline and Brisbane somehow manage to create a new golden age, it’d probably take them at least five years to overhaul the purple ones.
There has been movement elsewhere. The methodological change saw the great teams of the 1990s, Brisbane and Canberra, leap forward. The Broncos went past the old Dragons, while the Raiders surpassed Balmain, Canterbury and Glebe. Scoring lots of points helps.
Elsewhere, both Parramatta and Penrith have leapfrogged Newcastle, with another dominant season from the Panthers edging them just in front of their great rivals, the Eels. There’s a nice cherry for the top of the Penrith cake.
North Queensland have moved back into the top-20 all-time at the expense of the Newcastle Rebels who were also disadvantaged by no longer existing. As a result, the Gold Coast Titans are even further behind their nearest extant rival but do have Norths and the Northern Eagles within reach.
While the Glebe Dirty Reds have slipped one place, they’re still the eighth-best team in league history. Norths are still 22nd, having lost nearly 60 per cent of their games with a points differential of minus-2691. Who should we bring back? The Perth Dirty Reds has a certain ring to it.
Here are the rankings. Every team’s position at the end of 2021 is in brackets, with active teams in bold. If you’re wondering why, for example, Souths have 39 titles, remember that every minor and major premiership and City Cup victory since 1908 is counted.
Melbourne’s ill-gotten titles from 2007-09 are not counted.
| Rank | Team | Win/points % | Expected win % | Titles | WHAM |
| 1 | Melbourne (1) | 66.64 | 91.57 | 10 | 63.81 |
| 2 | Brisbane (3) | 59.42 | 84.50 | 10 | 55.76 |
| 3 | St George (2) | 58.98 | 66.06 | 30 | 55.58 |
| 4 | Manly (4) | 57.16 | 73.94 | 17 | 52.06 |
| 5 | Eastern Suburbs (5) | 54.55 | 67.53 | 34 | 50.85 |
| 6 | South Sydney (6) | 53.18 | 65.68 | 39 | 50.69 |
| 7 | Canberra (10) | 51.52 | 81.48 | 4 | 46.16 |
| 8 | Glebe (7) | 55.86 | 50.42 | 2 | 45.96 |
| 9 | Balmain (9) | 52.04 | 58.45 | 16 | 45.75 |
| 10 | Canterbury (9) | 51.08 | 64.53 | 15 | 45.62 |
| 11 | St George Illawarra (11) | 49.83 | 78.83 | 3 | 45.27 |
| 12 | Cronulla (12) | 49.26 | 69.16 | 3 | 42.47 |
| 13 | Penrith (15) | 45.96 | 70.06 | 8 | 42.04 |
| 14 | Parramatta (14) | 47.00 | 65.85 | 9 | 41.86 |
| 15 | Newcastle Knights (13) | 46.91 | 75.34 | 2 | 41.51 |
| 16 | Newtown (16) | 45.64 | 53.92 | 10 | 39.97 |
| 17 | New Zealand (17) | 44.62 | 77.05 | 1 | 39.66 |
| 18 | Western Suburbs (18) | 44.10 | 55.65 | 12 | 39.05 |
| 19 | North Queensland (21) | 42.54 | 76.63 | 1 | 38.15 |
| 20 | Wests Tigers (19) | 41.84 | 76.31 | 1 | 37.79 |
| 21 | Newcastle Rebels (20) | 45.00 | 55.33 | 0 | 37.03 |
| 22 | North Sydney (22) | 41.89 | 56.48 | 5 | 36.06 |
| 23 | Northern Eagles (23) | 39.80 | 78.09 | 0 | 35.67 |
| 24 | Gold Coast Titans (24) | 39.44 | 71.35 | 0 | 34.74 |
| 25 | Hunter (25) | 38.89 | 72.95 | 0 | 34.52 |
| 26 | Western Reds (26) | 39.75 | 61.19 | 0 | 33.95 |
| 27 | Illawarra (27) | 39.46 | 62.66 | 0 | 33.89 |
| 28 | Adelaide (28) | 31.55 | 62.17 | 0 | 28.30 |
| 29 | Gold Coast-Tweed (29) | 22.46 | 50.10 | 0 | 20.73 |
| 30 | South Queensland (30) | 20.38 | 48.71 | 0 | 19.14 |
| 31 | University (31) | 21.29 | 37.59 | 0 | 18.66 |
| 32 | Annandale (32) | 16.87 | 25.73 | 0 | 14.38 |
| 33 | Cumberland (33) | 12.50 | 17.82 | 0 | 10.53 |
The NRL era historical classification after 2022
The biggest losers are the Canterbury Bulldogs. While some signs of life emanated from Belmore during 2022, especially when interim coach Michael Potter reinvigorated the team’s attack, it was another poor season.
As a result, the Dogs slipped just behind Parramatta and St George Illawarra in terms of overall performance since 1998.
Penrith’s dominant season saw Manly rudely evicted from fourth, while Souths and North Queensland both moved up one place at the expense of Newcastle and the New Zealand Warriors respectively.
Melbourne and the Roosters are still well enconsed at the top and won’t be challenged for a while, but it wouldn’t surprise to see Penrith overtake the Broncos in 2023.
Parramatta should go past the Dragons, and it seems likely that the Bulldogs will fall behind Cronulla by the time next season is done.
Bring on 2023.
| Rank | Team | Win/points % | Expected win % | Titles | WHAM |
| 1 | Melbourne (1) | 66.64 | 76.10 | 10 | 62.26 |
| 2 | Sydney Roosters (2) | 57.87 | 72.69 | 9 | 54.98 |
| 3 | Brisbane (3) | 55.64 | 69.42 | 5 | 49.73 |
| 4 | Penrith (5) | 52.23 | 68.93 | 6 | 48.26 |
| 5 | Manly (4) | 52.26 | 69.57 | 2 | 45.36 |
| 6 | St George Illawarra (7) | 49.83 | 65.51 | 3 | 43.93 |
| 7 | Parramatta (8) | 51.10 | 65.38 | 2 | 43.91 |
| 8 | Canterbury (6) | 50.91 | 64.90 | 2 | 43.72 |
| 9 | Cronulla (9) | 49.88 | 64.15 | 2 | 42.93 |
| 10 | Canberra (10) | 48.64 | 68.58 | 0 | 40.91 |
| 11 | South Sydney (12) | 46.25 | 65.98 | 1 | 39.84 |
| 12 | Newcastle (11) | 45.93 | 65.84 | 1 | 39.53 |
| 13 | North Queensland (14) | 44.52 | 65.47 | 1 | 38.51 |
| 14 | New Zealand (13) | 44.17 | 63.86 | 1 | 38.11 |
| 15 | Wests Tigers (15) | 41.84 | 63.42 | 1 | 36.50 |
| 16 | Gold Coast (16) | 39.44 | 59.29 | 0 | 33.54 |
CLICK HERE for a seven-day free trial to watch the NRL on KAYO
Reckon you can pick the winning team? Build your own dream team with Draftstars daily fantasy and compete on any match. For great odds on the NRL head on over to PlayUp. Imagine what you could be buying instead. Set a deposit limit.