


- Video
-
Club Roar
Captured a great grassroots sporting moment? We want to see it!Content Collections
The Roar Community
- Join
- Login
Opinion
Robbed of certain victory by ongoing inclement weather throughout both of the first two tests of the 2001-02 home series against New Zealand, Australia were staring down the barrel of a very embarrassing series defeat when the lowly ranked visitors piled on 534 after getting first use of a very good batting surface in the Perth decider.
Australia struggled to avoid the follow on and only managed to finally do so off the back of a very famous 99 from lower order batsman, Shane Warne.
Despite making all of the running over the first four days, it would have been the New Zealand players and fans, rather than the Australians, sweating (profusely) throughout the final day.
Going into the final day, Australia were 2 for 69 in theoretical pursuit of an extremely unlikely 440, and the assumption would have no doubt been that they would struggle to even survive out the day for a draw. However, the Australians clearly did not see it that way. Hayden left for 57 at 130, and Mark Waugh lasted until 195, 4th out for 86 off 158 balls.
When Damien Martyn was out for 30, Adam Gilchrist joined skipper Steve Waugh, and the victory chase was still on.
With the captain playing the anchor role, and Gilly racing past 50 at nearly a run a ball, Australia got to 101 more needed with 79 balls to do it in, and 5 wickets still standing. Then came that fluky run out … but still the chase continued, only eventually being forced to put up the shutters and shut up shop when first innings top scorer, Shane Warne, was also run out, with 85 to get, 65 balls remaining, but now only three tailenders remaining to support Gilchrist.
In a Test that finished with one side only 59 runs from victory, the other a mere three wickets, every single run scored by Australia in both innings retained top value. Given that Australia were in crisis from early in their first inning until their final day counterattack, every delivery that any of the batsmen received that didn’t result in a wicket was also priceless.
Let’s see how deciding Test maestro Mark Waugh performed across both innings combined in comparison to his six batting colleagues, as well as, on this occasion, first innings saviour Shane Warne.
The most important innings for Australia in this match were Warne’s 99, Mark’s 86 and Gilchrist’s 83 not out, so this was certainly a genuine team effort, rather than a lone hand.
However, across both innings, Mark top scored with 128 runs, making a par 40 plus 2 in Australia’s first innings rear guard action, and then top scoring in the second innings as well as launching the initial assault on the final day in the quest for what would have been one of the all-time great come from behind victories.
In scoring 18.5% of Australia’s runs off the bat, he faced 17% of the deliveries bowled to the Australian batsmen across both their innings in this particular Test match. He outscored the other Australian batsmen in the match, including Warne, by an average quotient of 1.72 and absorbed more potential wicket taking deliveries than those same team mates by an average quotient of 1.76.
The full tables of Mark’s decimal fractional quotient above peers is shown in Tables A and B below.
| Shane Warne | 1.17 |
| Damien Martyn | 1.42 |
| Adam Gilchrist | 1.54 |
| Steve Waugh | 1.71 |
| Justin Langer | 1.71 |
| Matthew Hayden | 2.25 |
| Ricky Ponting | 2.25 |
| Damien Martyn | 1.11 |
| Steve Waugh | 1.28 |
| Shane Warne | 1.29 |
| Justin Langer | 1.32 |
| Matthew Hayden | 1.88 |
| Adam Gilchrist | 1.95 |
| Ricky Ponting | 3.46 |
Tables C and D below show that Mark was the only Australian batsman to score more than 30 in both innings.
| Shane Warne | 99 |
| Mark Waugh | 86 |
| Adam Gilchrist | 83 |
| Justin Langer | 75 |
| Steve Waugh | 67 |
| Damien Martyn | 60 |
| Matthew Hayden | 57 |
| Ricky Ponting | 31 |
| Mark Waugh | 42 |
| Damien Martyn | 30 |
| Ricky Ponting | 26 |
| Shane Warne | 10 |
| Steve Waugh | 8 |
| Adam Gilchrist, Matthew Hayden, Justin Langer | 0 |
Mark Waugh’s strike rate across both innings of 59 was superior to the 55.6 that represents the flattened average strike rate of the other seven Australian batsman combined.
The three among the other seven with higher match strike rates i.e., Ponting (90.5), Gilchrist (74.1) and Warne (64.5) occupy positions 8, 8, 8 and 2; 3, 7, 3, and equal 8; and 2, 4, 1 and 4 respectively on the tables in comparison to Mark’s 1, 1, 2 and 1.
Finally, the fusing together of run scoring and scoring speed previously championed on The Roar by both Renato Carini and myself: as this is one solitary Test in isolation, it will be based on aggregate rather than average, with 50 remaining as the par strike rate for test cricket. Match fusions are shown in Table E below.
| Mark Waugh | 151 |
| Shane Warne | 140.6 |
| Adam Gilchrist | 123 |
| Ricky Ponting | 103.2 |
| Damien Martyn | 82.2 |
| Justin Langer | 68.2 |
| Steve Waugh | 66.2 |
| Matthew Hayden | 56 |
Table F demonstrates two different hypothetical effects:
1. How Australia’s victory aspirations would have dramatically improved had any one of Steve, Martyn, Hayden or Langer faced the same number of deliveries that they did across both innings, but rather scored at the same overall match strike rate as Mark i.e., 59 and…
2. How Australia’s victory aspirations would also have genuinely improved had either of Warne or Ponting faced a mere 32 extra deliveries scoring at the same strike rate that each did across both innings combined.
Table F
| Match Runs facing 32 more balls at same strike rate | Victory target deficit at call of time (59 in real events) | Match run scoring at Mark’s strike rate | To win at Steve Waugh’s exit in runs/balls (101 off 79 in real events) | To win at Warne’s exit in runs/balls (85 off 65 in real events) | New Fusion (Mark 151) | |
| Shane Warne | 130 | 34 | n/a | n/a | n/a | 157.7 |
| Ricky Ponting | 86 | n/a | n/a | 49 off 25 | n/a | 155.7 |
| Adam Gilchrist | n/a | n/a | n/a | n/a | n/a | 149.8 |
| Damien Martyn | n/a | n/a | 116 | 75 off 79 | 59 off 65 | 136.9 |
| Steve Waugh | n/a | n/a | 100 | 76 off 79 | 60 off 65 | 118 |
| Justin Langer | n/a | n/a | 97 | 79 off 79 | 63 off 65 | 114.5 |
| Matthew Hayden | n/a | n/a | 68 | 90 off 79 | 74 off 65 | 80 |
The reason another 32 deliveries are factored into either Ponting or Warne’s respective innings is because when Australia finally called off the run chase upon Warne being the 7th wicket of the innings to fall (and final one of the match as it turned out), Gilchrist protected tailender Jason Gillespie by taking 41 of the remaining 65 deliveries of the match.
Had either Ponting or Warne faced an extra 32 deliveries, then Gillespie would not have been needed to bat, and the strike with Gilchrist could have been more evenly shared along the lines of 32-33.
This being the case, Gilchrist would have been able to keep going along at the same strike rate as when Warne got run out, at which point he (Gilchrist) had scored around 60 off around 70 balls. This adjustment leaves Gilchrist with a base individual score of 87 not out off 101 balls if and when time is called with Australia still (only slightly) shy of the target.
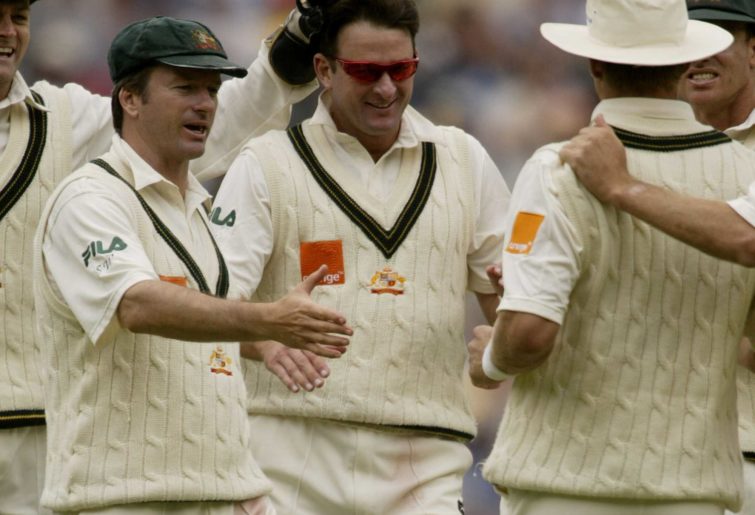
Mark Waugh (Sean Garnsworthy/Getty Images)
Finally, if Ponting, Gilchrist and Warne had all scored exactly as they did, but Hayden, Langer, Martyn and Steve had faced the same number of deliveries they each did in Australia’s second innings, and all four had scored at the same 54.4 strike rate as Mark in his 86, Australia would have finished, mathematically, a mere eight runs short of victory. This factors in Australia having the luxury of sending in Brett Lee instead of Jason Gillespie upon Warne’s dismissal, and Lee facing the same number of deliveries that Gillespie did (24), but also scoring at that same aforementioned strike rate of 54.4. It does not factor in the very real potential for Gilchrist to sufficiently increase his strike rate with the victory finish line well and truly in sight.
If, however, those same four batsman (Hayden, Langer, Steve and Martyn) had managed Mark’s overall strike rate across both innings of 59, with all other batsman including Mark and the tailenders scoring exactly as they did, then Australia would have already won the match in a canter at pretty much precisely the point in time when Warne was run out late on that final day i.e., with approximately 11 overs to spare.
The various different scenarios centred around the previous Table F do not represent fantasy alternate histories, but are rather mathematically driven to demonstrate just how much Mark Waugh outperformed the rest of his batting peers in a vital Test match in which Australia almost made massive history. The only one in his team to come significantly close to matching him was a tailender who played the innings of his life.
While his best performances were mostly in Ashes cricket as well as against the top tiered teams from among the test match cricketing community of his time, occasionally Mark was required to produce something special against the minnows and weaker teams of his era, such as New Zealand. Here in Perth, already over the hill at 36 and a half, he massively outperformed, when it mattered most, the then current generation recently arrived at or coming to their peaks of Langer 31, Hayden 30, Martyn 30, Gilchrist 30 and Ponting 27, not to mention his equally over the hill twin (obviously of the same age as him).
In line with the previous, penultimate paragraph, against the same opposition some 20 months earlier there had been the little remembered effort of 72 not out in a team total of 214 (next best scores 46 and 17) to start the series down in the land of the long white cloud, one of four times in his test career when Mark was the batsman left stranded upon the team being properly bowled out.
In that match, the victory margin had been a mere 62 runs.
Build your own fantasy cricket team and put it to the test with Draftstars daily fantasy competitions. Pick your match, pick your team and watch the points roll in to take out cash prizes on each match. What are you really gambling with? Set a deposit limit.