There will be two consequential matches in this week’s final regular season round.
If Western Sydney – 33 points, and in sixth – lose to Adelaide – 36 points, and in fifth – then the winner of Brisbane v Perth – both equal on 32 points, in seventh and eighth respectively – could snatch that last finals slot.
In the event of a Wanderers loss and a draw between the teams below, goal difference would need to be taken into account, with Brisbane and the Wanderers equal on -8, and Perth further back on -12. Brisbane, it seems, in this case, would have the advantage if they drew and Wanderers lost.
This is a glowing point of relevancy on the table, with everything of real consequence already sorted.
So, with that in mind, why not stroll through some of the data that the 2017-18 season has produced? This has been a season that has swayed a little uneasily, troubled by a general downturn in enthusiasm, a few wincing off-field nonsenses, all while muddling through under the light sedative of Sydney FC’s near-pillar-to-post dominance.
Let’s start with that dominance.
Sydney will finish the regular season having held the top spot for 22 of the 27 rounds. They have scored 63 goals and conceded 22, which means their goal difference of +41 is a higher figure than more than half the league’s goal-scored tally.
Newcastle’s is the next highest goal difference, at +14. Their points-per-game rate is 2.35, almost a full point above the league average.
They have conceded 0.85 goals-per-game; the next stingiest team is Melbourne City, at 1.19 goals conceded-per-game. Four out of their 19 wins were by four or more goals, more than any other team.
They conceded more than one goal on six occasions, but only three of those matches resulted in defeat. Their potency in attack and miserliness in defence was astonishing for the second straight year.
But are there any slightly less obvious numbers to note? Well, of all the defenders who have completed more than 80 long passes, Jordy Buijs has done so at the highest rate of accuracy (63%), by some distance. Alex Wilkinson (58 per cent) isn’t far behind.
Anyone who has watched Sydney play – and play well – this season will have noticed how often Buijs’s passing range is used; the Sydney fullbacks surge up, the central pair split and cover the vacated areas on the wings, and Buijs is given the ball and told to distribute up the field from deep.
This is a mechanism that Graham Arnold has developed to suit the talents of his players, the mark of a keen tactician.
Newcastle have lost their last three matches, conceding 10 goals in the process; to put that in perspective, it took nine games for them to concede that many to start the season. It has put a serious dampener on their campaign, which has otherwise been astonishingly successful.
A high-octane offence was based on directness and speed; they have the fewest passes-per-goal of any A-League team and have the second-lowest average possession.
But they’ve smacked in more total shots-on-target than any other team (148), and Dimi Petratos and Andrew Nabbout are fourth and fifth for shots-on-target among players, even though the latter left for Japan in early March.
Their system was unashamedly vertical in nature; no team played fewer backwards passes than Newcastle, and every other team sent in more crosses – if you have vague memories of the Jets crossing the ball a lot, it’s likely Petratos you’re thinking of, and only him. Strangely enough; only Leroy George sent in more crosses than Petratos this season, but no other Jet appears in the league’s top 20 in this regard – it seems as though only Petratos had the license to cross in volume numbers, for some reason.
We’ll see whether this system can survive the heightened conditions of the finals and whether Newcastle’s scoring form can return; of the players to score more than five goals this season, only Oriel Riera and Bobo needed more shots to do so than Petratos.

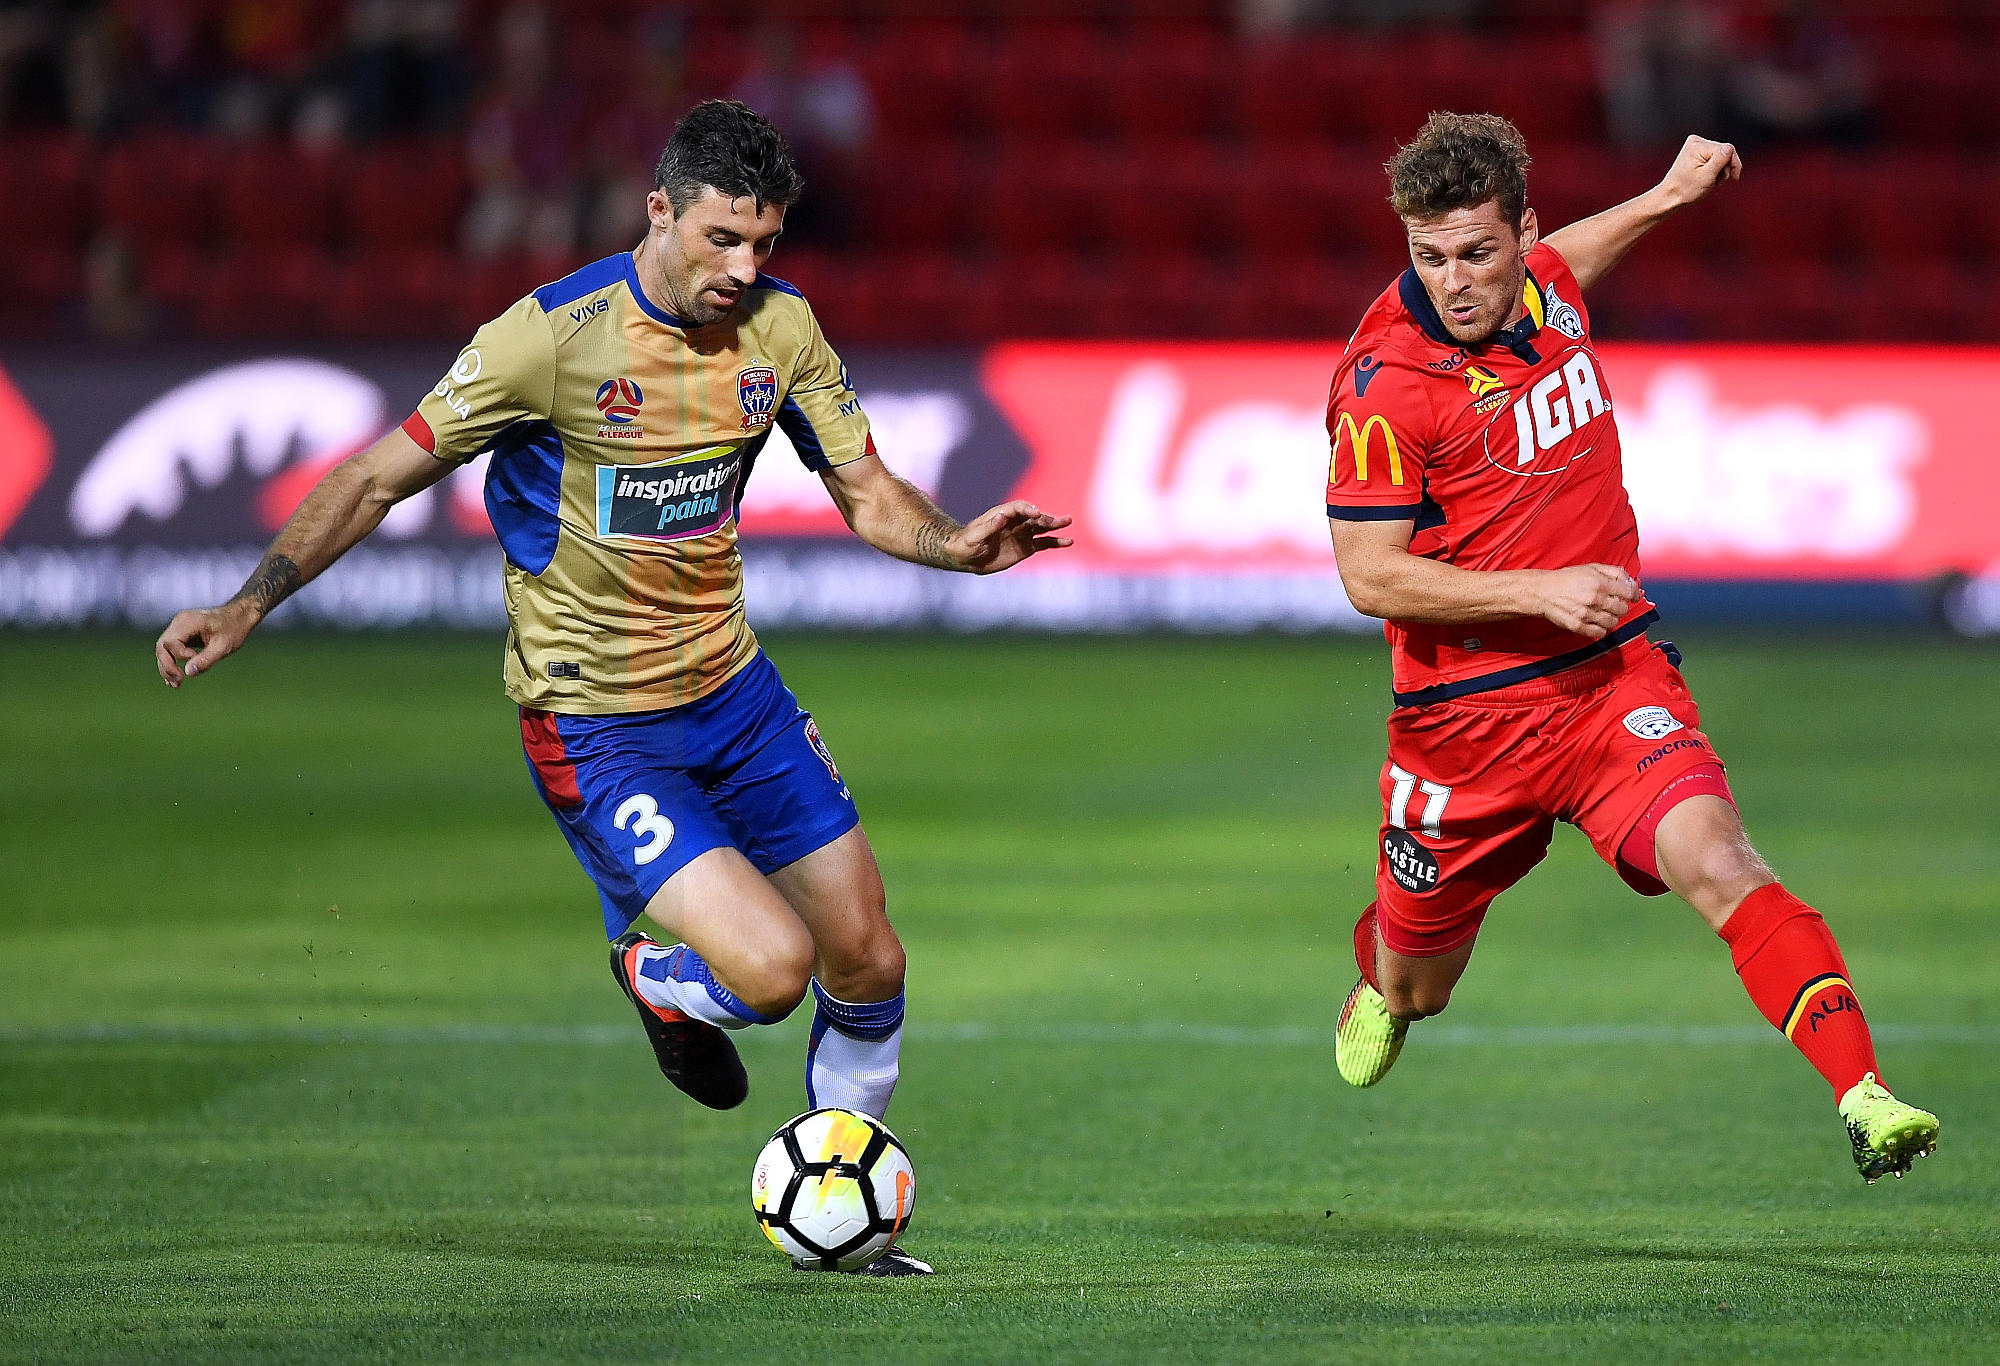
(Photo by Mark Brake/Getty Images)
Naturally, they lead the league in completed crosses as well, but this due to pure volume; their rate of accuracy is good (25%) but not enough to justify the mammoth amount they bloot in every game, sitting second to Sydney’s (27%).
They shoot often, but, as Ante Jukic elucidated beautifully in this Guardian piece from last month, generally these shots are not quality opportunities.
This is further reflected in the fact Adelaide has won the equal-most corners in the league; crossing endlessly to set defences will result in a fair few corners, but this clearly shows that corners are not always a byproduct of quality offensive pressure.
There is a caveat to this; Johan Absalonsen, who has been injured for huge portions of Adelaide’s season, is actually third in the league for goals-per-90-minutes, among players to have made 9 or more appearances (Absalonsen has made 10).
He also ranks inside the top five for headed goals-per-90-minutes. To put it more simply, he’s started just seven games for the Reds this season and has managed to score in all but two of those starts.
Adelaide have dearly missed his finishing, especially in the air, and so their approach may seem a little less futile if he’s fit and firing in the finals.
Feel free to discuss the lingering impressions you’ve all had of this regular season – statistical or otherwise – and what they might mean for the finals below the line.
Part two is coming tomorrow.
Kangajets
Guest
Muppets Stadler and Waldorf are my favourite grumpy old men
Waz
Roar Rookie
Statistics never lie. It’s the muppets interpreting the statistics that do that ?
Nemesis
Guest
"Victory lost their away game to Sydney FC" Maybe, this will be true if you write it on Saturday. Right now, it's an ALT-FACT.
Mark
Guest
I don’t really buy the talk of Victory’s apparently superior away record as having any significance whatsoever for finals. Derbies are effectively neutral territory, particularly those played at AAMI Park. This season, Victory won their two ‘away’ derbies, and lost their ‘home’ derby. I would be interested to see how the figures hold up if you exclude the derbies. Also, of their potential semi final opponents, Victory lost their away game to Sydney FC, and lost both their away games to Newcastle. I maintain what i’ve said here a couple of times before. I can’t see Victory getting past the semis, because they cannot win big matches away from home.
Evan Morgan Grahame
Expert
Thanks James, I have to trawl through a number of sites for the stats; Fox Sports and the A-League website's stats area can be good, and I've recently discovered sofascore.com, which has very detailed player stats database, and can be sorted by per-game, per-90 minutes, or by raw totals. Transfermarkt is used for appearances, team formations, and starting XI information. There can be certain amount of inconsistency between these source, I assume this must be due to the way each outlet tracks and records the individual metrics.
Kangajets
Guest
Nice defence and deflection
Grobbelaar
Roar Guru
Maybe put up a link on wookie's article from yesterday?
Kangajets
Guest
An end of season 7 a side gala day with all the teams involved. That should sort out who is the best .
Kangajets
Guest
Gr Thought you might be interested, there is an interesting article in the “economic truth ” , basically saying that t v ratings are incredibly inaccurate.
Kangajets
Guest
Newcastle have gone from scoring 28 goals last season to scoring 49 this season Newcastle conceded 53 last season compared to 35 this season These statistics show that Newcastle are an 80 per cent better team this year Sydney conceded 12 last season compared to a massive 22 against this season , almost a 100 percent decline in Sydney defense,... the stats show how fragile Sydney are in defence Statistics, .... they never lie
Nemesis
Guest
"Could this have anything to do with the North Terrace ceasing their active support at the end of last year?" Really? Is that what you observed as a football analyst? You really think MV's poor home form - especially early in the season - was due to lack of visuals people not jumping & singing in the stands? And, North Terrace have been out of action a lot longer than this season. They've hardly been at MV matches in past few years. Having said that the new Active Fans (Back Row Melbourne) create a more vibrant atmosphere at home matches than North Terrace did in their final years.
Buddy
Guest
Agreed it would be something....but what exactly? Without igniting the obvious debate, the idea just leaves me not knowing what conclusions to draw from the season. If only we could finish with a proper knockout competition final or League winner vs Cup winner!
Stevo
Roar Rookie
There is a distinct possibility that we could see an all Melbourne grand final. Now that would be something.
Nemesis
Guest
MVFC can still have a home Grand Final - literally, or geographically.
James Rosewarne
Guest
Great stats, Evan. Genuinely love the work you do. Im very curious however as to what source(s) you use for those stats? Keep it up!
Grobbelaar
Roar Guru
An interesting aspect about the Victory stat that they performed better on the road than at home is that if they reach the semi final, they will play away from home. They will win that game and earn a grand final berth....away from home.