With 2019 State of Origin series opener going the way of Queensland in a surprise victory, we head towards Game 2 with a completely different outlook on both sides.
New South Wales entered Game 1 as the favourites, the defending champions, with a great squad full of form players interspersed with most of last year’s series-winning outfit. Queensland entered with a squad decimated by injury, their captain and halfback playing his first game in weeks after recovering from an injury, and some media conjecture hanging over the team.
More Origin 2
» Five talking points from Origin 2
» Match Report: Blues belt Queensland to force decider
» WATCH: Video highlights from Origin 2
» Re-live the match with our live blog
What transpired was a gutsy and dominant 18-14 win by the Maroons, a scoreline that flattered the Blues.
This resulted in New South Wales coach Brad Fittler ringing in seven changes to his side, while Queensland have made just two, both due to injury. Freddie’s men enter this match under much scrutiny and criticism and with the series on the line.
Once again, a statistical analysis has been done for each match-up for Game 2, to see if the numbers can reveal which team’s and combinations have the edge.
Key for below stats
Pl=Games Played, Min=Minutes, TA=Try Assists, MPR=Metres per run, LB=Line Breaks, TklBrk=Tackle Breaks, OL=Offloads, Tkl=Tackles made, MT=Missed Tackles, TKL%=Tackle effectiveness, Err=Errors, PC=Penalties conceded.
Fullback: Kalyn Ponga vs James Tedesco
Tedesco is clearly the more prolific running fullback, while Ponga is more of a ball player. Tedesco dominates in the areas of runs, metres and tackle breaks, while also being ahead narrowly for tries scored, metres per run and offloads.
| Pl | Min | Tries | TA | Runs | Metres | MPR | LB | TklBrk | OL | Tkl | MT | Tkl% | Err | PC | |
|---|---|---|---|---|---|---|---|---|---|---|---|---|---|---|---|
| Ponga | 12 | 77.6 | 7 | 0.6 | 9.7 | 103.0 | 10.7 | 1.2 | 4.2 | 0.5 | 6.4 | 1.5 | 77.8 | 1.1 | 0.3 |
| Tedesco | 12 | 80.2 | 8 | 0.4 | 15.4 | 167.0 | 10.8 | 1.2 | 5.6 | 0.9 | 2.7 | 0.8 | 66.7 | 1.3 | 0.0 |
Wing: Corey Oates vs Josh Addo-Carr
Oates has Addo-Carr covered in nearly every metric so far this year, except one: raw speed. Oates averages two runs and 26 metres per game more than Addo-Carr, while being marginally ahead in metres per run, line breaks, tackle breaks and tackles made.
| Pl | Min | Tries | TA | Runs | Metres | MPR | LB | TklBrk | OL | Tkl | MT | Tkl% | Err | PC | |
|---|---|---|---|---|---|---|---|---|---|---|---|---|---|---|---|
| Oates | 12 | 80.0 | 10 | 0.0 | 13.7 | 149.5 | 10.9 | 1.1 | 3.7 | 0.2 | 4.1 | 0.9 | 80.3 | 1.8 | 0.1 |
| Addo-Carr | 12 | 79.8 | 10 | 0.0 | 11.7 | 123.2 | 10.6 | 0.8 | 3.3 | 0.4 | 3.8 | 0.4 | 80.7 | 1.0 | 0.3 |

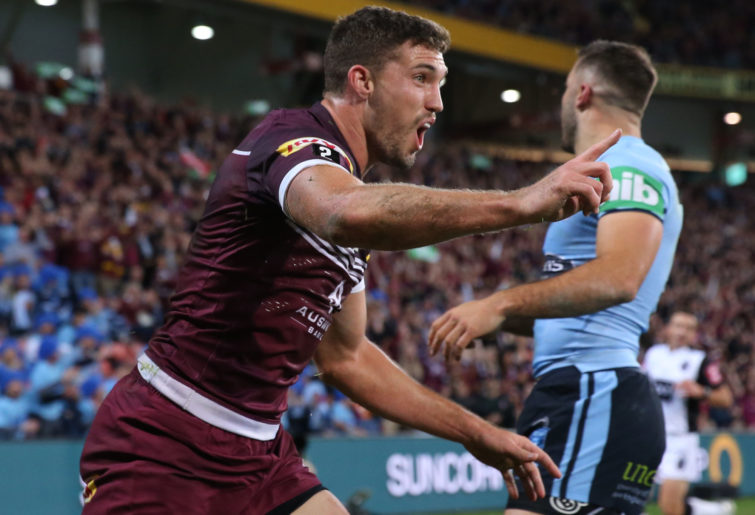
(Photo by Chris Hyde/Getty Images)
Centre: Michael Morgan vs Jack Wighton
This is essentially the battle between a ball-running five-eighth and a ball-playing five-eighth, despite the fact they are both playing at centre. Wighton’s style is better suited to this role, however Morgan proved he was capable enough at the job in Game 1, despite being outplayed by Josh Morris.
Wighton trumps Morgan when it comes to tries scored, runs, metres, metres per run, tackle breaks, all aspects of defence and also has fewer errors.
| Pl | Min | Tries | TA | Runs | Metres | MPR | LB | TklBrk | OL | Tkl | MT | Tkl% | Err | PC | |
|---|---|---|---|---|---|---|---|---|---|---|---|---|---|---|---|
| Morgan | 13 | 80.3 | 2 | 1.3 | 6.4 | 45.7 | 7.2 | 0.2 | 1.6 | 0.8 | 13.5 | 3.2 | 76.8 | 2.2 | 0.6 |
| Wighton | 13 | 80.0 | 5 | 0.2 | 8.2 | 81.5 | 10.0 | 0.2 | 2.7 | 0.3 | 17.2 | 1.9 | 84.8 | 1.8 | 0.8 |
Centre: Will Chambers vs Tom Trbojevic
Chambers has played more games at centre in the last two months than Tom Trbojevic has played in his five-year career. Trbojevic is a fullback who can fill a spot on the wing, coming into this match with just four games under his belt in 2019.
Despite that, Trbojevic has as many tries as Chambers (four apiece), more try assists, runs, metres, metres per run, line breaks, tackle breaks and offloads per game. However, those were all from his games at fullback.
| Pl | Min | Tries | TA | Runs | Metres | MPR | LB | TklBrk | OL | Tkl | MT | Tkl% | Err | PC | |
|---|---|---|---|---|---|---|---|---|---|---|---|---|---|---|---|
| Chambers | 13 | 79.3 | 4 | 0.2 | 9.0 | 74.9 | 8.3 | 0.2 | 1.1 | 0.5 | 9.8 | 1.1 | 81.9 | 1.2 | 0.2 |
| T.Trbojevic | 4 | 70.5 | 4 | 1.3 | 14.8 | 164.0 | 11.1 | 2.0 | 6.5 | 2.0 | 3.5 | 0.8 | 70.0 | 1.5 | 0.3 |
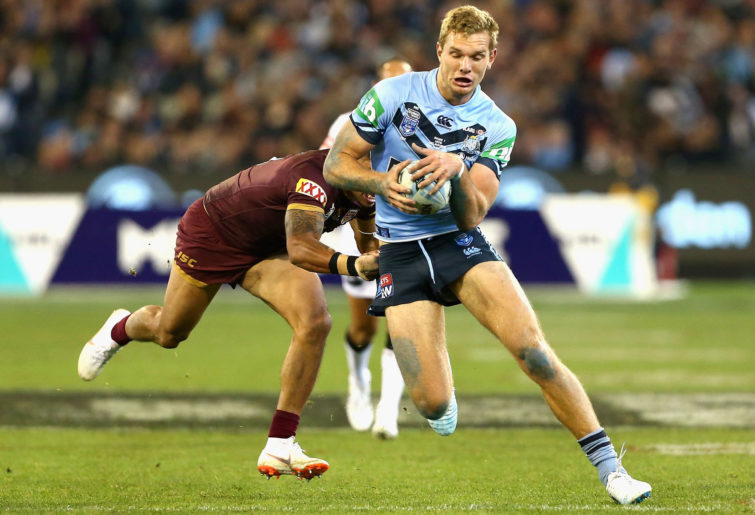
(Photo by Robert Prezioso/Getty Images)
Wing: Dane Gagai vs Blake Ferguson
Gagai loves playing at Origin level and will no doubt be at his absolute best here. Ferguson has the height and leap advantage, so he’ll likely be a target for the Blues to kick towards. Ferguson’s ball-running and metre-making ability are superior to Gagai’s.
| Pl | Min | Tries | TA | Runs | Metres | MPR | LB | TklBrk | OL | Tkl | MT | Tkl% | Err | PC | |
|---|---|---|---|---|---|---|---|---|---|---|---|---|---|---|---|
| Gagai | 13 | 80.4 | 2 | 0.1 | 13.1 | 117.4 | 9.0 | 0.2 | 3.8 | 0.2 | 12.4 | 2.1 | 79.7 | 0.9 | 0.3 |
| Ferguson | 13 | 77.4 | 5 | 0.3 | 17.1 | 160.7 | 9.4 | 0.6 | 2.4 | 0.9 | 4.0 | 1.3 | 68.4 | 1.8 | 0.2 |
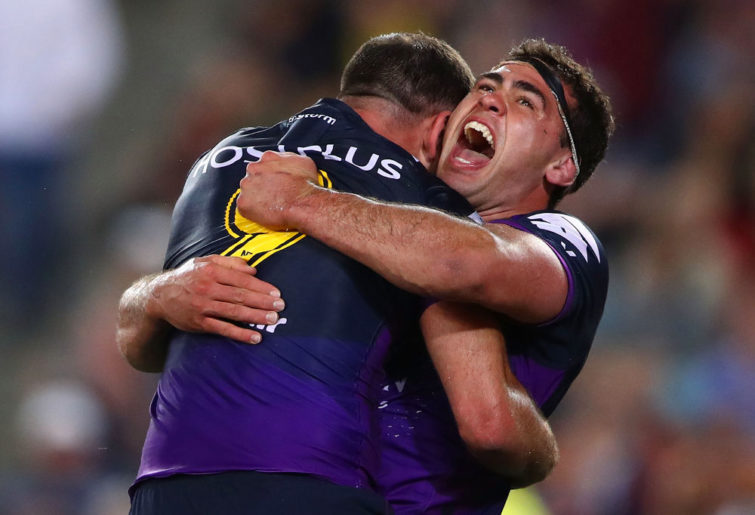
Five-eighth: Cameron Munster vs James Maloney
Two of the game’s elite number sixes will square off in Origin 2 after Maloney was brought in to replace Cody Walker, who had a game to forget in the series opener. Munster has produced more try assists, runs, metres, line breaks, tackle breaks and offloads than Maloney, while also being better in defence and discipline.
| Pl | Min | Tries | TA | Runs | Metres | MPR | LB | TklBrk | OL | Tkl | MT | Tkl% | Err | PC | |
|---|---|---|---|---|---|---|---|---|---|---|---|---|---|---|---|
| Munster | 13 | 79.8 | 5 | 1.0 | 8.0 | 64.2 | 8.0 | 0.4 | 2.5 | 0.5 | 21.2 | 1.8 | 89.3 | 0.8 | 0.5 |
| Maloney | 13 | 80.4 | 2 | 0.7 | 5.5 | 45.5 | 8.3 | 0.2 | 1.2 | 0.3 | 15.7 | 3.9 | 76.7 | 0.9 | 1.5 |
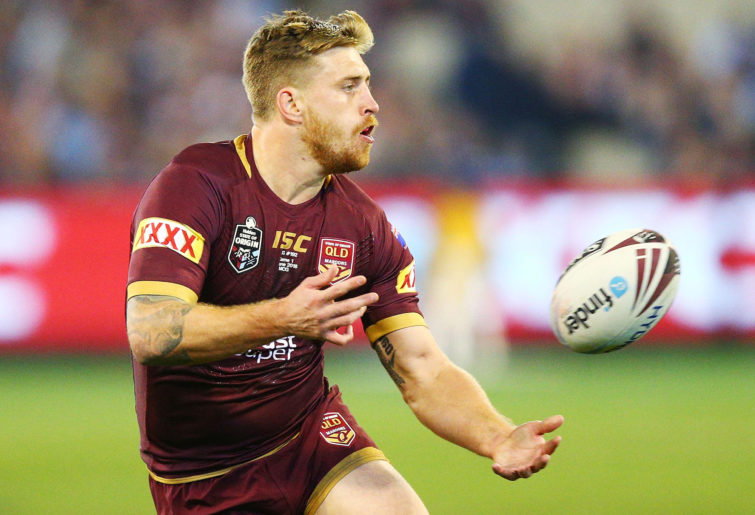
(Photo by Michael Dodge/Getty Images)
Halfback: Daly Cherry-Evans (c) vs Nathan Cleary
Despite playing four fewer NRL games, Cherry-Evans has produced more try assists and line breaks than Cleary. The young Blues half doesn’t have as many errors in his game while being DCE’s match defensively.
| Pl | Min | Tries | TA | Runs | Metres | MPR | LB | TklBrk | OL | Tkl | MT | Tkl% | Err | PC | |
|---|---|---|---|---|---|---|---|---|---|---|---|---|---|---|---|
| Cherry-Evans | 9 | 75.9 | 3 | 0.8 | 4.8 | 48.3 | 10.1 | 0.6 | 1.4 | 1.1 | 17.2 | 1.8 | 85.6 | 1.9 | 0.4 |
| Cleary | 13 | 79.5 | 3 | 0.4 | 6.8 | 52.3 | 7.7 | 0.2 | 1.5 | 1.3 | 15.4 | 1.8 | 85.5 | 1.0 | 0.2 |
Prop: Dylan Napa vs Paul Vaughan
Vaughan is a real workman in the middle, outperforming Napa in runs, metres, tackle breaks, offloads and tackles per game. He also plays, on average, nine minutes more per game than Napa, which will be of huge benefit to the Blues, given their lighter bench for Origin 2.
| Pl | Min | Tries | TA | Runs | Metres | MPR | LB | TklBrk | OL | Tkl | MT | Tkl% | Err | PC | |
|---|---|---|---|---|---|---|---|---|---|---|---|---|---|---|---|
| Napa | 10 | 44.3 | 2 | 0.2 | 11.7 | 102.3 | 8.7 | 0.1 | 1.0 | 0.3 | 19.9 | 2.9 | 84.0 | 0.3 | 0.4 |
| Vaughan | 13 | 53.6 | 0 | 0.1 | 15.3 | 137.9 | 9.0 | 0.1 | 1.2 | 0.8 | 29.5 | 1.3 | 91.2 | 0.1 | 0.5 |
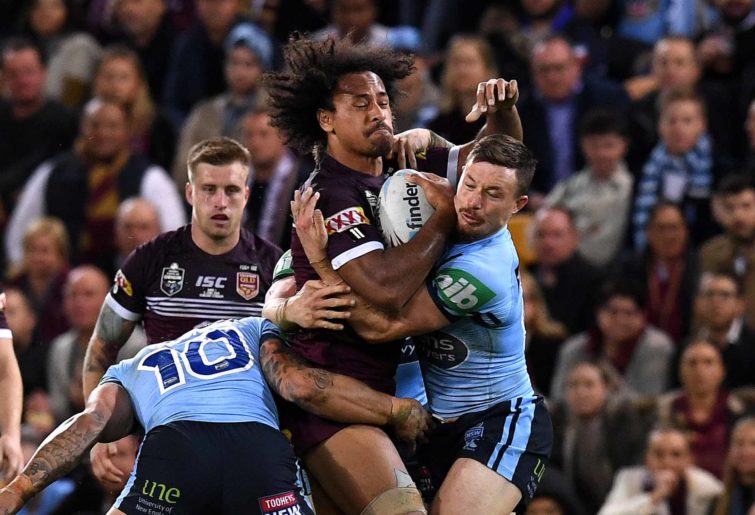
Hooker: Ben Hunt vs Damian Cook
Maroons hooker Ben Hunt is traditionally a halfback but proved he was well and truly up to the task at this level in Game 1. He’ll be up against the current Test rake Damian Cook, who is averaging more try assists, metres per game and per run and line breaks per match than Hunt, while also being much stronger in defence and more disciplined.
| Pl | Min | Tries | TA | Runs | Metres | MPR | LB | TklBrk | OL | Tkl | MT | Tkl% | Err | PC | |
|---|---|---|---|---|---|---|---|---|---|---|---|---|---|---|---|
| Hunt | 13 | 79.3 | 5 | 0.8 | 4.8 | 39.1 | 8.2 | 0.3 | 1.9 | 1.5 | 20.8 | 3.8 | 81.3 | 1.7 | 0.5 |
| Cook | 13 | 79.4 | 2 | 1.3 | 4.5 | 42.1 | 9.3 | 0.4 | 1.6 | 0.8 | 37.5 | 1.3 | 93.0 | 0.9 | 0.3 |
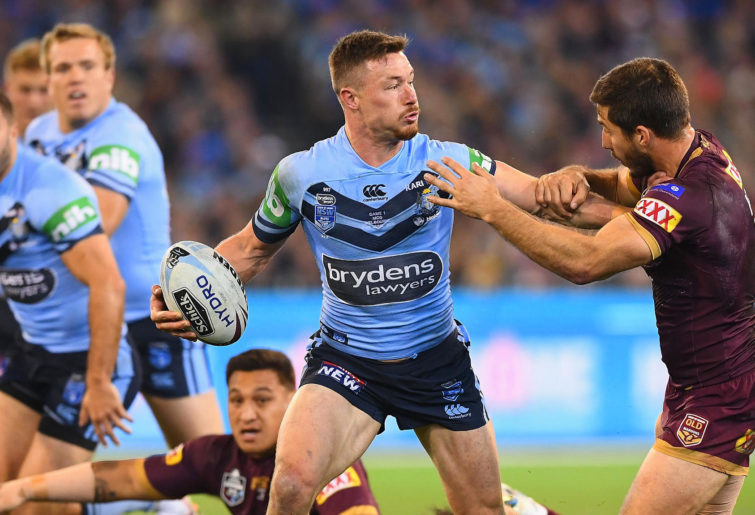
(Photo by Quinn Rooney/Getty Images)
Prop: Josh Papalii vs Daniel Saifiti
This is the most lopsided contest in the match. Josh Papalii outperforms Saifiti in every statistical field, and in some instances, by a huge margin. He averages almost 50 metres more, takes five extra runs and plays 11 more minutes per game than the Blues debutant.
| Pl | Min | Tries | TA | Runs | Metres | MPR | LB | TklBrk | OL | Tkl | MT | Tkl% | Err | PC | |
|---|---|---|---|---|---|---|---|---|---|---|---|---|---|---|---|
| Papalii | 13 | 54.5 | 1 | 0.1 | 14.6 | 134.6 | 9.2 | 0.2 | 1.2 | 0.8 | 23.4 | 0.7 | 94.1 | 0.1 | 0.4 |
| Saifiti | 11 | 43.4 | 0 | 0.1 | 9.6 | 86.5 | 9.0 | 0.0 | 0.7 | 0.1 | 22.1 | 1.8 | 90.3 | 0.3 | 0.4 |
Second row: Felise Kaufusi vs Tyson Frizell
Kaufusi has really improved his endurance and is now a regular 80-minute player. The differences in statistics between these two players is so slim, making for a mouth-watering clash between two big men who like to wreak havoc on the edges.
| Pl | Min | Tries | TA | Runs | Metres | MPR | LB | TklBrk | OL | Tkl | MT | Tkl% | Err | PC | |
|---|---|---|---|---|---|---|---|---|---|---|---|---|---|---|---|
| Kaufusi | 13 | 78.8 | 1 | 0.1 | 10.1 | 89.8 | 8.9 | 0.0 | 0.5 | 0.4 | 29.5 | 1.2 | 92.3 | 0.6 | 0.8 |
| Frizell | 11 | 54.8 | 1 | 0.1 | 9.9 | 87.5 | 8.8 | 0.1 | 0.5 | 0.6 | 25.2 | 1.4 | 89.1 | 0.5 | 0.2 |
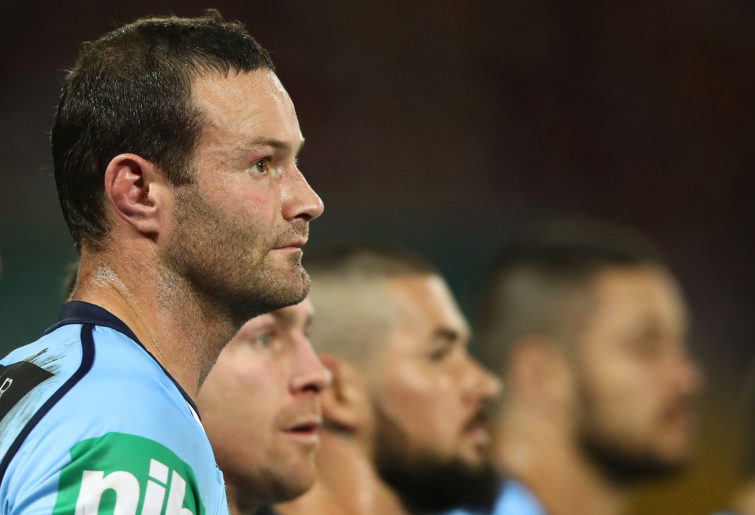
Second row: Matt Gillett vs Boyd Cordner (c)
The Blues captain has been in great touch this year and that is seen in his dominance over Gillett, particularly with runs (four more per game), metres gained (almost 50 more per game) and tackle breaks (just over one extra per game).
| Pl | Min | Tries | TA | Runs | Metres | MPR | LB | TklBrk | OL | Tkl | MT | Tkl% | Err | PC | |
|---|---|---|---|---|---|---|---|---|---|---|---|---|---|---|---|
| Gillett | 12 | 65.8 | 4 | 0.0 | 8.3 | 63.5 | 7.7 | 0.1 | 0.8 | 0.4 | 31.9 | 1.6 | 90.3 | 0.5 | 0.3 |
| Cordner | 12 | 73.0 | 4 | 0.1 | 12.3 | 113.0 | 9.2 | 0.2 | 1.9 | 0.6 | 23.3 | 2.1 | 86.4 | 0.6 | 0.3 |
(Photo by Mark Kolbe/Getty Images)
Lock: Josh McGuire vs Jake Trbojevic
McGuire has been posting big numbers all year in attack, averaging 137.5 metres per game, 27 more than Trbojevic – not that the Manly lock is a slouch. ‘Moose’ is also averaging 1.5 tackle breaks per game, which is 1.3 more than his Blues opponent. On the flip side, Trbojevic is considerably more effective in defence – just look at the tackle numbers.
| Pl | Min | Tries | TA | Runs | Metres | MPR | LB | TklBrk | OL | Tkl | MT | Tkl% | Err | PC | |
|---|---|---|---|---|---|---|---|---|---|---|---|---|---|---|---|
| McGuire | 11 | 62.6 | 0 | 0.0 | 16.3 | 137.5 | 8.5 | 0.0 | 1.5 | 0.8 | 26.3 | 1.5 | 89.2 | 0.5 | 0.5 |
| J.Trbojevic | 13 | 79.2 | 1 | 0.2 | 13.0 | 110.5 | 8.5 | 0.0 | 0.2 | 0.3 | 40.5 | 1.1 | 93.8 | 0.5 | 0.8 |
Bench: Moses Mbye vs Wade Graham
Mbye will be playing as a genuine backline utility, capable of playing at fullback and in the halves, while Graham is back in the Blues side just two games after his return from a nine-month injury absence. His return has been phenomenal for Cronulla, hence him being rushed into the Blues side. He’ll be a weapon on the left edge and capable of playing as a centre, five-eighth or in his preferred back row spot.
| Pl | Min | Tries | TA | Runs | Metres | MPR | LB | TklBrk | OL | Tkl | MT | Tkl% | Err | PC | |
|---|---|---|---|---|---|---|---|---|---|---|---|---|---|---|---|
| Mbye | 11 | 80.9 | 1 | 0.3 | 12.6 | 101.0 | 8.0 | 0.2 | 2.9 | 0.5 | 10.5 | 1.1 | 87.1 | 1.1 | 0.4 |
| Graham | 2 | 43.0 | 0 | 0.5 | 8.5 | 84.5 | 9.9 | 1.0 | 2.0 | 0.5 | 14.0 | 2.5 | 82.3 | 0.5 | 1.0 |
Bench: Jarrod Wallace vs Tariq Sims
Both players have been called in to replace injured players. Wallace is a front rower who can cover lock, while Sims is more of a traditional edge forward, but one not afraid to get in the middle and rip in.
| Pl | Min | Tries | TA | Runs | Metres | MPR | LB | TklBrk | OL | Tkl | MT | Tkl% | Err | PC | |
|---|---|---|---|---|---|---|---|---|---|---|---|---|---|---|---|
| Wallace | 12 | 51.0 | 1 | 0.1 | 15.3 | 141.3 | 9.2 | 0.2 | 1.5 | 1.5 | 24.5 | 1.5 | 91.3 | 0.8 | 0.7 |
| Sims | 13 | 79.1 | 1 | 0.0 | 12.7 | 106.7 | 8.4 | 0.4 | 1.8 | 0.5 | 27.2 | 2.5 | 88.9 | 1.0 | 0.7 |
Bench: Tim Glasby vs Dale Finucane
Two more bench players brought in for this second match. Both play at lock for their clubs, are solid toilers, defensively brilliant and will likely be playing as part of the front row rotation. Finucane plays more minutes, makes more metres per game and per run.
| Pl | Min | Tries | TA | Runs | Metres | MPR | LB | TklBrk | OL | Tkl | MT | Tkl% | Err | PC | |
|---|---|---|---|---|---|---|---|---|---|---|---|---|---|---|---|
| Glasby | 13 | 45.2 | 2 | 0.0 | 9.3 | 71.6 | 7.7 | 0.1 | 0.5 | 0.5 | 25.7 | 0.7 | 95.2 | 0.3 | 0.4 |
| Finucane | 13 | 57.2 | 1 | 0.0 | 12.3 | 111.8 | 9.1 | 0.2 | 1.5 | 0.5 | 29.8 | 1.0 | 93.5 | 0.4 | 0.6 |
(Photo by Mark Kolbe/Getty Images)
Bench: David Fifita vs Cameron Murray
The two debutants from Origin Game 1 have retained their places on the bench. Murray’s statistics show his dominance over Fifita, which the Blues hope will be replicated on the field tomorrow night.
| Pl | Min | Tries | TA | Runs | Metres | MPR | LB | TklBrk | OL | Tkl | MT | Tkl% | Err | PC | |
|---|---|---|---|---|---|---|---|---|---|---|---|---|---|---|---|
| Fifita | 13 | 41.2 | 2 | 0.1 | 8.5 | 76.1 | 8.9 | 0.2 | 1.2 | 0.5 | 18.2 | 0.8 | 91.9 | 0.1 | 0.2 |
| Murray | 13 | 59.5 | 6 | 0.1 | 10.8 | 96.5 | 9.0 | 0.4 | 1.8 | 1.3 | 32.8 | 1.0 | 93.2 | 0.6 | 0.8 |
In the head-to-head rankings (stats fields won), this is how the two teams measure up:
Fullback: NSW 11-6
Winger: QLD 11-7
Centre: NSW 10-7
Centre: NSW 9-7
Winger: NSW 10-6
Five-eighth: QLD 13-3
Halfback: NSW 9-8
Prop: NSW 12-4
Hooker: NSW 11-5
Prop: QLD 15-2
Second row: QLD 11-7
Second Row: NSW 11-7
Lock: NSW 10-8
Bench 1: QLD 10-6
Bench 2: QLD 10-7
Bench 3: NSW 11-7
Bench 4: NSW 13-4
Total: NSW 159-129
(AAP Image/Dan Peled)
Backs (Including Bench 1): NSW 53-47
Halves: QLD 21-12
Forwards (Including Bench 2, 3 and 4): NSW 84-71
Spine (fullback, five-eighth, halfback, hooker): NSW 34-32
All of the stats fields have narrowed significantly, especially in the halves and on the bench. New South Wales have fielded a more mobile side with arguably greater strike power out wide, while Queensland look to have a slight upper-hand in the middle.
The numbers suggest New South Wales should win, however they convincingly said the same thing for Game 1. With the numbers even closer here, Queensland’s chances of winning will be higher as well.
kk
Roar Pro
One fortuitous 50/50 could decide this game and the gate at ANZ.
Josh H
Roar Rookie
Good analysis, but not quite sure about how you went about examining the bench. Wade Graham may be the most versatile of the Blues' bench, but I highly doubt they'd want to play him anywhere other than his preferred position of second row. He isn't quite the like-for-like utility selection alongside Mbye. And that's kinda mucked up the rest of your bench. You've tried to compare Murray with Fifita despite them playing completely different positions. You'd be much better served to compare Murray to his opposite no.16 in Glasby, as they are both locks. Equally, both Graham and Fifita are edge forwards. I appreciate it's a bit tricky as each team would form their bench in a different way, just not sure whether you went about it in the best method.
Andrew Ferguson
Expert
It does complicate matters, however it does also tend to favour the specialist over the fill-in, as it should.
madrid john
Guest
Nice column, nice work. One bug bear, would be stats for players out of position. How do you compare stats for centers, for example, when most of them play somewhere else in club land? How to compare Hunt with Cook? Cook is a full-time hooker, while Hunt plays half at clubland. Surely that would screw up the stats
Chuck
Guest
So NSW to win, huh. Yeah, nah, good luck with that.
Roar GOAT
Roar Rookie
A lot of work into this for nothing interesting. The stats say Morgan makes more errors than Wighton, yet anyone without one green eye would see that Wiggtkn continually cripples the raiders with a brutal error at a critical time. These stats posts are meaningless.
Peter
Guest
Thank you for the hard work that obviously went into this fascinating table.. But still, meh. Stats shmats. Because why? Because Origin, belief, heart, history. Because QUEENSLANDER!!! Goodness that was satisfying. Better go and have a nice sit down for a while. :-)