In this series, we have been looking at how Australian players have performed in Test match wins, both how many career wins and losses they have and how they have performed in those victories compared to their fellow top-six batsmen. (It was top seven but we’ve changed it to remove the wide discrepancy in the batting talents of wicket keepers over time.)
After looking at Allan Border, Adam Gilchrist and Michael Clarke last time around, in this edition we turn to three of our great opening batsmen: Justin Langer, Matt Hayden and Mark Taylor, each boasting over 50 career Test wins.
But before we get there, I need to briefly address the curious case of Adam Voges. Voges famously finished his career with a batting average of 61.87. This puts him third on the all-time list of highest career batting averages (minimum 20 Tests), behind only Don Bradman and Steve Smith. Voges just made it to 20 Tests, prompting some to consider raising the minimum Test threshold to 21.
Voges specialised in destroying New Zealand and especially the West Indies. His performances against the weak Caribbean attacks are scarcely believable – four innings, 542 runs, once out. Voges also averaged a cool 99 against the Kiwis. Exactly half of his 20 Tests came against these two opponents, giving him an incredible 1186 runs at an average of 169.4!
Voges’ other ten Tests were against England and Sri Lanka away and South Africa at home. These netted him just 349 runs at the very mortal average of 20.5.
But we are talking about performance in wins here and Voges has the single highest average in wins in world history (minimum five wins) at 153.85. Incidentally, if you remove the five-win qualification, there are two other Australians who averaged even more – Martin Love (168.0 from three matches) and Albert Trott (2 matches, 195 runs and never dismissed). For reference, Don Bradman’s win average was around 130 across 30 matches.
Looking at the top-six comparison in Voges’ winning Tests, we see that all teammates batting one to six averaged a combined 63.3. This is extremely high. For example, in my last article, the top six comparisons for Michael Clarke, Adam Gilchrist and Allan Border ranged from 49 to 54, remembering that Gilchrist batted with possibly our greatest line-up of all time.
Related

So 63.3 is very high. But Voges contributed nearly two-and-a-half times more runs than the average of his teammates (143 per cent to be exact). So while batting was obviously easy, he cashed in like nobody else.
Voges only participated in two drawn Tests and averaged 80 in those, compared to 72.07 from his peers.
However, Voges was selected to provide an experienced backbone for the tougher trials, especially the 2015 Ashes. This didn’t work out and Voges is now pretty much considered to be a bit of a flat-track bully. The numbers do bear this out.
Voges averaged just 16.5 in losses. Virtually every batsman performs significantly worse in losses (or they wouldn’t lose!), generally at about 50-60 per cent of their average in wins, but the West Australian performed at less than 11 per cent capacity.
In those losses, his peers averaged a collective 25.67, which is not going to win you any matches, but Voges was more than 35 per cent worse than that. To put it in further perspective, the two players on either side of his loss average are Pat Cummins and Peter Siddle.
Adam Voges, a statistical anomaly. Let’s move onto our three opening batsmen.
Justin Langer
70 wins. 5229 runs at 48.41 with 15 centuries (Losses: 26.38, Draws: 56.07). Top six comparison: 52.87 (losses: 30.13, draws: 50.46).
The now-national team coach was part of the most prolific opening partnership Australia has ever seen and he registered 70 career wins – eighth on Australia’s all-time list. Langer performed admirably in those matches, with his winning average of 48.41 being a few points higher than his overall mark of 45.27. He also scored 15 of his 23 career centuries in victories.
However, he was generally not the dominant force in those winning performances. His batting peers averaged 52.87 during those matches. So, on average, Langer contributed 4.5 runs less per innings than his peers, or about eight per cent less. Batting in a team with Hayden, Ponting, Waugh and Gilchrist has its advantages.
Langer’s winning average ranks him 46th of all Australian players to have won at least five Tests, behind such luminaries as Matt Renshaw and Joe Burns. In fact, I can count around ten openers with higher winning averages.
In losses, Langer’s average of 26.38 puts him in an even worse position, around 12.5 per cent less productive than his top-six teammates in those matches.
Langer performed much better in draws, averaging 56.07 and suddenly he is 16th on Australia’s all-time list. The top-six comparison here is 50.46, so Langer was 5.6 runs or 11 per cent better than his peers in draws.
There are still some memorable winning performances for Langer to cherish. His back against the wall chase with Adam Gilchrist against Pakistan in Hobart in 1999 was discussed in my previous article and was a brilliant, gutsy innings. This was a pattern for Langer, particularly early in his career. He averaged over 40 in the fourth innings, showing he knew how to close out a match.
Other big showings included:
- An unbeaten 179 not out from number three in the first innings of the Adelaide Ashes Test of 1998 to set up a 200-run win for Australia. No other player in that innings reached 60 and we are talking Slater, Taylor, a pair of Waughs, Ponting and Healy.
- A double of 51 and 127 in the 1999 fourth Test against the West Indies in St John’s. This win allowed Australia to weather a run of Brian Lara masterpieces to stagger away with a drawn series in one of the great contests. Despite losing this match by a comfortable margin, Lara had put on another show, scoring 100 from only 84 balls in the first innings before nicking off to Glenn McGrath.
- In a close contest against New Zealand in Hamilton in 2000, Australia were left chasing 210 to win in a match where the previous three innings all finished under 260. Langer smacked 122 at nearly run a ball to romp it home, with the next best teammate contributing just 37.
In later years, Langer’s contributions moved more towards the first innings as he and Matthew Hayden demoralised opponents with huge opening stands at speed to effectively end matches almost before they began. An example is the Boxing Day Ashes Test of 2002, where the first 45 overs brought 200 runs before Hayden was out. Langer went on to notch 250 before Australia defeated a spirited England by five wickets.
Even if Hayden was having a rare off Test, Langer could get the job done. Against Pakistan in Perth in 2004 Langer turned five for 78 into 381 all out, with 191 first-innings runs. He threw in another 97 in the second innings for good measure.

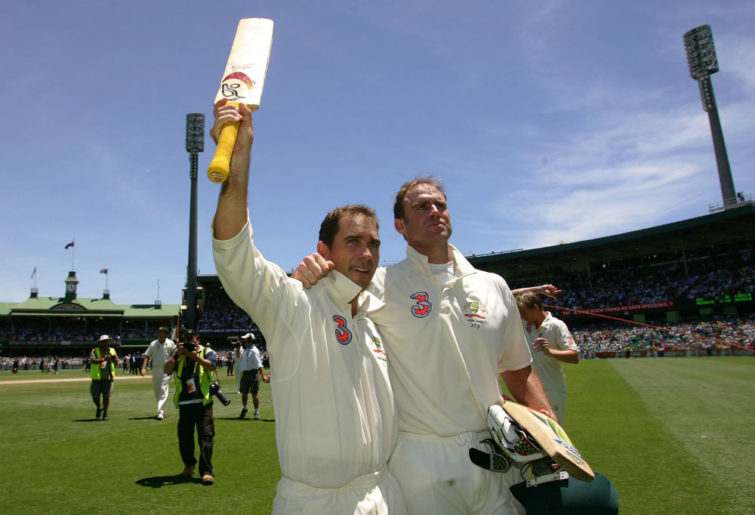
Langer and Hayden. (Photo by Hamish Blair/Getty Images)
Matthew Hayden
71 wins. 6154 runs at 55.44 with 23 centuries (losses: 30.3, draws: 60.0). Top six comparison: 53.73 (losses: 33.17, draws: 50.55).
Hayden hit 23 centuries in Australian wins. Only Steve Waugh (25) and Ricky Ponting (30) have more. His winning average of 55.44 is in Australia’s top 20, just behind Michael Clarke.
Hayden comfortably shades his long-time opening partner for averages in wins, losses and draws. Compared to his peers, his winning average is 1.7 runs per innings or 3.2 per cent better, so Hayden made a marginally stronger contribution that his all-time great teammates. His draw average of 60 is not too shabby and is 9.5 runs more than the men he played alongside.
Hayden’s average in losses is solid but not spectacular, but then he only played in 18 defeats. His contribution is 8.7 per cent less than his teammates, which appears to put him back in the pack for openers, contributing less than the middle order.
Interestingly, on either side of Hayden in the list of averages in losses sits 1980s batsman-forced-to-keep Wayne Phillips and perennial LBW candidate Shane Watson. So Hayden was a front runner and that sort of fits with my general perception. But it was still a better performance in losses than Langer, who was considered more of a scrapper.
Hayden’s performances in wins could best be described as brutal. And he loved the big stage, with centuries in six different Boxing Day Test wins. As an opener seeing off the new ball, he had a strike rate in wins of 60.45. Here is a selection of Hayden’s winning performances:
- Hayden famously trained himself to sweep and handle Indian conditions before his first tour of the sub-continent in 2001. In the first Test, replying to India’s 176, Australia were struggling, losing regular wickets. Hayden held firm until he found an ally in Adam Gilchrist. His 119 held the innings together and paved the way for a ten-wicket win. He would go on to score 549 runs across the three-Test series.
- Later that year, Hayden scored 138 first innings runs in the Boxing Day Test against South Africa, forming a 202 first wicket partnership with Justin Langer to engineer a nine-wicket victory. In the next Test in Sydney, the pair did it again, this time 212 runs with Hayden contributing 105. In the return series in South Africa, Hayden started off the series with 122 as Australia crushed their rivals by an innings.
- In Sharjah in 2002 against Pakistan, Hayden was the only player from either side to master the brutal conditions. His 119 runs in the first innings were amazing. The next highest score in the entire match was 44. The combined Pakistan team scores across two innings totalled only 109.
- Back in Brisbane for the first Ashes Test in 2002/03, Nassar Hussein infamously won the toss and sent Australia in to bat. The home side finished the day at 2 for 364 with Hayden unbeaten on 186. He added 103 in the second innings for good measure. The Ashes were over.
- Then there was the small matter of 380 runs, a world record at the time, against Zimbabwe in Perth in 2003.
- Hayden liked to cash in. He was pretty much the only player who took Australia versus the World XI seriously, setting up Australia’s comfortable win with a double of 111 and 77, top-scoring in both innings.
Mark Taylor
52 wins. 3812 runs at 45.92 with 11 centuries (losses: 23.02, draws: 55.84). Top six comparison: 53.22 (losses: 26.58, draws: 43.81).
There is a third Australian opening batsman who notched over 50 career wins: celebrated captain and air conditioner salesman Mark ‘Tubby’ Taylor. Taylor averaged just under 46 in wins, which is only 2.5 runs above his overall average.
Like Justin Langer, this was well below his batting peers in those games, 7.3 runs per innings, or 13.7 per cent less. I would suggest that Hayden is an outlier as an opener averaging more than his middle-order teammates and it is much more likely that even in wins an opener will cop the odd good one from a fresh bowler with a hard new ball.
Taylor still scored 11 of his 19 centuries in wins. His first was in his very first Ashes Test, when he announced himself as a new star. 136 first innings runs set the team up for a score in excess of 600. Taylor picked up another 60 while setting up a declaration. He went on to score over 800 runs for the series, including a double century in a 329-run partnership with Geoff Marsh to win the fifth Test.
Other memorable winning contributions included:
- In the West Indies in 1991, when Australia were still four years away from taking the mantle as world number one, Taylor contributed a double of 59 and 144 against Ambrose, Walsh, Patterson and Marshall as the Aussies secured a consolation win in the fifth test.
- In 1992 against India in Adelaide, Taylor’s second innings 100 from 303 balls helped turn an 80-run first innings deficit into a close 38-run victory, with the aid of a super ten-wicket haul from Craig McDermott.
- In the 1993 Ashes at Lords, Taylor’s 111 was part of centuries by each of the top three (with fourth bat Mark Waugh bowled for 99) as Australia destroyed England by an innings. It was only made all the funnier when England captain Michael Atherton was run out on 99 while trying to save the match in their second innings.
Taylor’s draw average of 55.84 is very respectable, helped by his famous 334 not out in Peshawar, plus six other centuries. This result is 12 runs and 27.5 per cent better than his peers in those matches, which indicates Taylor was good in a draw and got his team out of trouble a few times.
One good example was in the Sydney Ashes Test of 1994/95. England put on 309 and then Darren Gough shot Australia out for just 116, of which Taylor scored 49, more than double the next best contributor. Michael Atherton infamously declared with Graeme Hick not out on 98, setting Australia just over four sessions to survive for a draw. Taylor then put on a 200-run stand with his long-time opening partner Michael Slater and despite some wobbles, the team held on seven wickets down for the draw.
Taylor’s average in losses is about half of that in wins and puts him in the same company as such players as Bob Simpson, Brad Haddin and surprisingly, Mitchell Johnson. Taylor only hit one century in a lost match. Like his average in wins, this result is below his peers (3.5 runs or 13 per cent) and is likely a consequence of opening the batting.
Incidentally, Taylor’s sole century in a loss was his potentially career-saving century in Birmingham in the 1997 Ashes after enduring a horrific run of form over the previous 12 months.
Next time, we will tackle three players who were hands down the best Australian batsmen of their respective eras. Just how dominant were they?
matth
Roar Guru
Yeah, it’s all good. There are others much better qualified to write about the great Dean Jones, or alternatively how the Broncos broke my heart this year.
All day Roseville all day
Roar Guru
Hi matth, Unfortunately you've picked the worst-possible week in which to publish a long article based on complex statistics !
matth
Roar Guru
Charles Davis did a top 20 peak. The ICC player rankings use a two year period with more recent games weighted more heavily and a discount applied during a players first I think 20 tests? They also consider the relative rankings of the opposition. It does not consider home vs away. They are all good but not perfect measures. In this series I’m not looking for the greatest batsman, more looking to see if performances in wins and losses provide another angle in reflecting on a player’s career. Will we find more front runners like Hayden, unexpectedly good results in losing efforts like Wayne Phillips (yep, Wayne Phillips), etc. I won’t be doing a team but at the end I’ll do a top 20 for performances in wins, 15 best averages, plus the other players with the highest level of contribution compared to their peers in those games.
All day Roseville all day
Roar Guru
Hi matth, nice read. Will the 11 winningest players make the winningest team, or are team dynamics far more nuanced ? I suspect that it would win any series, but 3-2 or 4-1 rather than 5-0. George Bailey had a 4-0 record in his only series, and Adam Voges had a great average, but that doesn't make them winningest or even lucky charms. Any balanced team will have a Ross Edwards for every Doug Walters, and a Mark Taylor for every Michael Slater. Players like Edwards and Taylor let the match-winners release the shackles, and lay platforms for wins in tough conditions. Sheek's theory is a good one. Cricinfo's Anantha Narayanan recently did such an analysis for Kapil Dev- https://www.espncricinfo.com/story/_/id/29864910/did-kapil-dev-really-end-career-poorly-people-believe-did? I'd love to have the time to compare each player's peak period, say 40 consecutive Tests or (for less-recent players) five consecutive years. Alternatively, weight each player's performances. For example, give each modern player an 18-match aggregate comprised of average per-Test performances home-and-away against 9 opponents. 4-73 v England away, 5-90 v England at home, 6-119 v Pakistan at home, 3-127 v India away, 2-96 v South Africa away and so on. That way, a career with lots of matches against Bangladesh or Zimbabwe wouldn't skew comparisons.
sheek
Roar Guru
Matth, "Adam Voges, a statistical anomaly". So true. Voges' place in the record books is to remind us mere mortals constantly that we are indeed, only 'mere'. Only God knows the real value of each player. It is also to remind us that while stats are informative, they should never be regarded as definitive. And so we argue over stats like they're bikinis. What they reveal might be awesome. But what they conceal is also crucial. We can pick players based on most test appearances, or most runs or wickets, or best averages (highest batting/lowest bowling), but we will never quite nail the truth. Ultimately we are left with our perception, which is our only recourse to truth. And it helps if our perception is as balanced as possible. Here, you have provided yet another way at determining our heroes. I remember back around 2000, I think it was Phil Derriman for the SMH, concentrated on the core career for each player, in deterring the best. He called it something else, but basically, the core career, cut out the first few tests/series (developing his game) & last few tests/series (falling off in intensity). I suppose if you followed the Derriman principle, you would cut out roughly the first 10% & last 10% of a player's career, & concentrate on the middle 80%. Keeping in mind also, tying to contain that 10% to whole series. I thought it was a good way to make his selections. I might try it to see if it offers any new insights.