Originally, I was going to add Mark Taylor for a three-way comparison, given his outstanding series at home in 1989-90 and his very good series at home in 1995-96.
However, this would mean I would need to include Steve Waugh’s 1988 and 1989-90 performances, which would be perhaps a tad unfair as it was before Mark was selected for Australia and would give Steve a lopsided number of innings in comparison.
Therefore, I have decided to stick with the four series they played together in the 1990s, which greatly benefits Steve because his meaningful innings in those aforementioned first two series were zero, one, 59, 20 and 17.
He also had meaningless performances of 13, 19, and three as well as an innings of four in a fourth innings when they weren’t actively chasing the target.
The 2002-03 series on neutral ground in Sri Lanka and UAE will also not be included because by that stage both Waughs were well past their prime.
Table 1 below shows the four series against Pakistan in 1994, 1995-96, 1998 as well as 1999-00 and includes the Sydney dead rubber in 1995-96.
| Batsman | Meaningful innings | First-innings average | Meaningful average | Strike rate* | 100s | 50s |
|---|---|---|---|---|---|---|
| Mark | 16 | 50.4 | 46.9 | 56 | 3 | 5 |
| Steve | 15 | 52.9 | 36.8 | 46.8 | 1 | 3 |
*Strike rate (linked directly/entirely to meaningful average)
As with the dead rubber at Centurion Park outlined in the previous South African analysis, Australia lost after already closing out the series win in the first two Tests.
However, on this occasion, it was Mark who performed rather than Steve, with innings of 116 and 34, while Steve made 38 and 14.
As this Test was decided by a small double-digit number of runs, all scores for all batsmen in both innings across both teams have full numerical value in this particular game.
Across these two dead rubbers in question, Mark scored 145 runs for three dismissals, ignoring his 42 in the lost cause second innings at Centurion, while Steve scored 119 for three dismissals, ignoring his unbeaten 67 at Centurion for the same reason as Mark’s aforementioned 42.

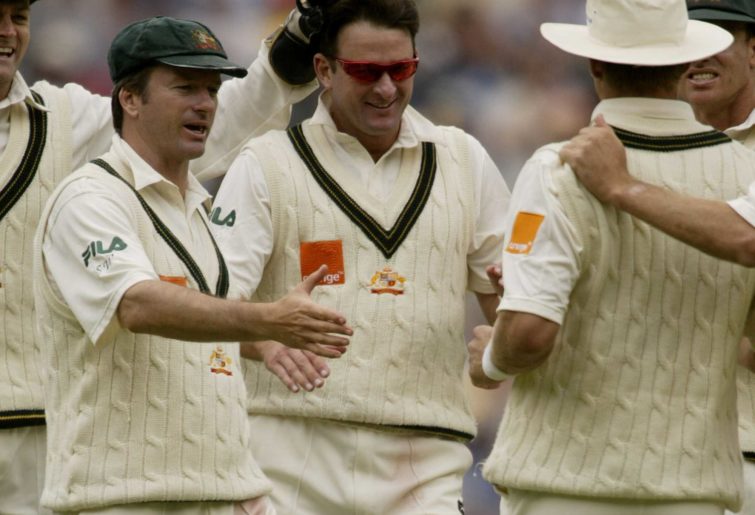
(Image credit: Sean Garnsworthy/Getty Images)
However, it is neither here nor there to combine these numbers for isolated dead rubber Tests across two different series against two different opponents.
Table 2 below shows their numbers for those same four series if this Sydney dead rubber in 1995-96 is excluded from the analysis.
| Batsman | Meaningful innings | First-innings average | Meaningful average | Strike rate* | 100s | 50s |
|---|---|---|---|---|---|---|
| Mark | 14 | 44.5 | 42.9 | 55.1 | 2 | 5 |
| Steve | 13 | 54.6 | 36.8 | 47.7 | 1 | 3 |
*Strike rate (linked directly/entirely to meaningful average)
As outlined in the previous analysis for series against South Africa, dead rubbers against these two opponents are far less of an issue for the reasons already outlined.
However, as also previously stated in the previous analysis, if we are focusing on actually winnings series, individual player performances in them still need to be downplayed.
In both cases, Centurion Park and Sydney, each Waugh who performed had also already made a significant and meaningful contribution to the respective series victory prior to each of these dead rubber defeats actually playing out.
In the first of these four series, 1994 in Pakistan, the two Waughs exerted similar impact. Mark scored 20 and 61, 68 and 71, while Steve scored 73 and zero, 98 and then missed the deciding third Test through injury.
On the first day of the series, Steve joined forces with debutante Michael Bevan and put on 121 in 110 minutes after Australia had slumped to 4-95.
Then in the second innings, Mark joined forces for the third wicket with veteran David Boon and extended the first-innings lead of 81 past the 250 barrier, only for a subsequent collapse of 8-61 to leave Pakistan chasing 314, after champion pacemen Wasim Akram and Waqar Younis had double teamed in searing fashion.
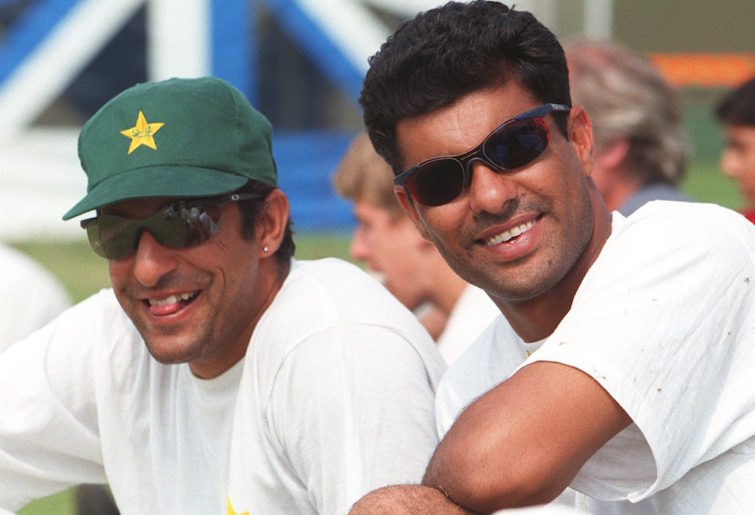
(Photo by Neal Simpson/EMPICS via Getty Images)
Losing that opening Test in Karachi was not the fault of either Waugh, but rather the Australian bowlers who failed to stop the Pakistani last pair putting on the required 58 still needed for victory.
In the second Test, once again batting first, neither Waugh came in under any sort of pressure, entering at 2-181 and 4-323 respectively.
Both made meaningful contributions to Australia’s 521 and after enforcing the follow on, it took Pakistan until approximately the halfway point of the fifth and final day to make the game safe from defeat for them.
Steve missed the third Test and Mark entered with Australia 2-106 in reply to Pakistan’s 373 and left at 4-248 having scored 71.
That Australia failed to put the finishing touches on any of the three winnings positions they found themselves in that series was entirely down to the bowlers, the batsmen having done easily enough.
In the return series a bit over a year later, Australia trounced Pakistan in the opening Test by an innings and plenty, with 42 by Michael Slater being the only sub-50 score by any of the top six batsmen.
Steve’s unbeaten 112 was at least 40 more than his team needed to still win comfortably with only a minimal elementary fourth-innings run chase required, even had Pakistan totalled twice as much in the first innings than they had when they were rolled for a mere 97.
Mark made 59 in Australia’s only innings, coming in with Australia comfortably placed at 2-119, while his brother had replaced him at an even more comfortable 3-213.
It was in the second Test in Hobart that Australia faced genuine pressure for the first time and it was Mark who responded.
He entered just before lunch on the opening day at 2-68, which then became 3-111, 4-156, 5-156, 6-209 and 7-235 as wickets fell at regular intervals before Mark himself perished for 88, eighth out at 240.
Batting productively with the tail when his fellow batsmen had failed to produce is something Mark did far more often than his detractors would care to believe.
Victorious by the lesser, but still comfortable margin of 155, after an excellent second innings century by captain Mark Taylor saw the series wrapped up.
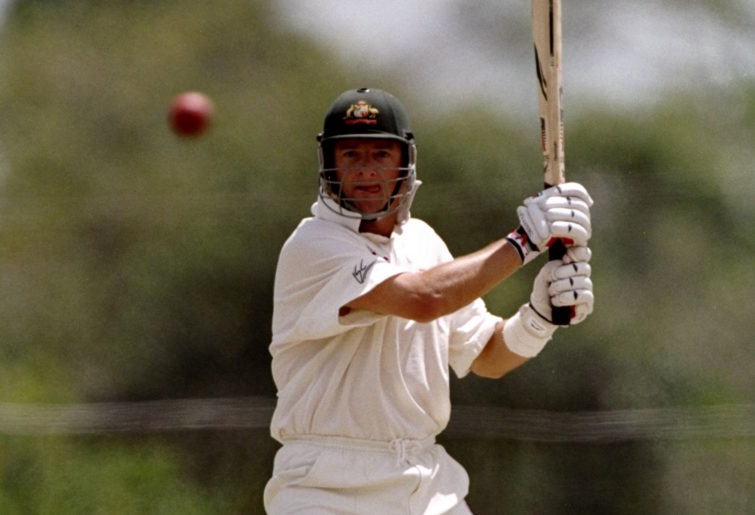
A tally of 150 in those two Tests for three times out for Mark, and a meaningful tally of 106 for twice out for Steve is an accurate reflection of their respective contributions or impact on Australia’s series victory.

(Credit: Ben Radford/Allsport/Getty Images)
In the return to Pakistan in late 1998, both Waughs made outstanding contributions to Australia’s first Test series victory there in 39 years.
In the first Test, Mark was out for a duck, as Australia slumped to 3-28 in reply to Pakistan’s first innings score of 269. Steve and surviving opener Michael Slater then took the score to 226.
Both scored centuries, before Darren Lehmann and Ian Healy took over, scoring 98 and 82 respectively, Australia totalling 513.
Winning by an innings and 99 runs, and three other batsmen scoring heavily in the same innings means both Slater’s 108 and Steve’s 157 can be capped at 100 in order to gauge their true meaningful contribution to the victory.
The second Test in Peshawar will be ignored completely in this analysis owing to the mundane, lifeless nature of the pitch which saw a mere 18 wickets fall for nearly 1500 runs over five full days of play.
Interestingly, both scored almost identical to their official (undissected) career averages, Mark 42 and 43, Steve one and 49 not out.
In the third and deciding Test, Mark made 26 and Steve a duck, as Australia’s 280 played Pakistan’s 252.
Mark entered in the second innings at two down and 163 in front, which then became three down 180 in front with the only other two half century makers in the innings, Taylor 68 and Justin Langer 51, both already gone.
The following batsmen would depart for the following scores: Steve 28 off 60 balls, Lehmann 26 off 72 and keeper Healy three off 13.
In among all this, Mark scored 117, and scored his runs 50 per cent faster than the combined rate of the rest of his batting colleagues.
He was out with the lead 385, although they were probably safe from defeat when the lead reached the 350 mark, which roughly coincided with his own score reaching 100.
Therefore, like Steve’s 157 in the first Test, Mark’s 117 can also be capped at 100 in terms of impact on his team’s fortunes in the match.
The pressure faced by Steve in the first Test going in at 3-28 in reply to 269 is self-explanatory, and together with Slater, what needed to be done was done, and then well beyond by Steve.
The pressure faced by Mark in the second innings of the deciding Test was somewhat more complex. At three down, and the lead 180, the situation resembled both the first innings of the same match as well as the second innings of the corresponding match on the same ground on the previous tour there four years earlier.
(Credit: Shaun Botterill/Allsport/Getty Images)
In the first innings of this same match, Mark had been third out with the score on 169 after an unusually slow grafting innings of 26 off 84 deliveries.
The team scoring rate at that point had also been painfully slow to that point of 2.2 per over, very slow for the Taylor era, so conditions were super difficult for batting.
At the aforementioned point of three down 180 in front in the second innings, the run rate was also only 2.3 per over.
If at that point, this Australian second innings followed the same course as their first innings, and they simply slowly but surely got knocked over, they would only end up setting Pakistan around 290, with four full sessions to get them.
Remember they had successfully chased down 314 on the same ground four years earlier, and in this game, as it panned out, they got to 6-262 from 4-75, having only a day to chase the eventual target of 419.
The comparison with the Karachi match four years earlier is the collapse of 8-61 from 252 in front (to set the aforementioned target of 314).
A similar collapse, at their current rate of scoring, would have left Pakistan well under 250 to win, with around five sessions, or the best part of two full days to get them.
Basically, the situation demanded a batsman stand up and make a century, and do it at a scoring rate of no less than a par 50 runs per 100 balls faced, and this is precisely what Mark did. He did what no other batsman in the team was capable of doing in the conditions faced that momentous day.
The 1999-00 home series didn’t see anything significantly series-defining by either Waugh. Steve’s scores, all of them meaningful in terms of being made well before any match had reached its decisive point, were one, 24, 28 and five while Mark’s were 100 (off 148 balls), five, zero and zero.
Mark’s aforementioned 100 involved some elements of pressure for a certain part of it, though not all of it. In reply to 367, Australia reached 269 before they lost their first wicket, and then Mark went in at two down three runs later.
There was no pressure at this stage. However, wickets then fell at 3-311, 4-328 and then 5-342, by which time Mark was on about 40.
Now there was a certain amount of pressure that wasn’t there when he went in because the opening stand that had demolished the opposition advantage was now being squandered away bit by bit.
Added to that was the fact that it was a debutant, Adam Gilchrist, coming in. It doesn’t matter how much potential brilliance a debutant possesses no team can ever count on them to succeed immediately in Test cricket – when they do it is a mere bonus.
(Photo by Daniel Pockett – CA/Cricket Australia via Getty Images )
The pressure dissipated around about the point of Mark and Gilchrist getting the team to 50 in front, during which time, Mark scored about 40 of his total 100 runs. He was out around 50 runs beyond that.
In the second Test, when Australia slumped to 5-127 in the fourth innings chasing an extremely unlikely 369 for victory, both Waughs were long since out for zero and 28 respectively.
My verdict for the Waughs’ performances in those four afore outlined series against Pakistan in the 1990s is thus.
First series: Contributions were approximately equal on a pro rata basis allowing for the fact that Steve missed the third and deciding Test.
Second series: Mark shaded Steve because their meaningful contributions were pretty much equal in the first Test drubbing that they handed the opposition when all Australia’s batsmen got among the runs.
Then it was Mark who propped up Australia’s innings batting first in the second Test when wickets were falling all around him after he had gone in with his team already in some trouble.
The third Test dead rubber where Mark scored a century doesn’t even need to come into the analysis.
Third series: At face value, their contributions appear equal, Steve’s in the first Test, Mark’s in the third and deciding.
However, Mark’s 117 was made among scores of 68, 51, 30, 28, 26, 25 (not out), 11 and three among the other six batsmen plus one tailender, while Steve’s 157 had 108, 98 and 82 in equal support among the top seven in the line-up.
Therefore, I would rate Mark’s performance as at least fractionally shading Steve’s.
Fourth series: Neither Waugh was anywhere near the difference between Australia winning, losing or drawing the series, which was clean swept 3-0, the only such occasion by either side across these four series.
In closing, as with Mark in the South African comparison, Steve has one of his tons downgraded to a half ton in the tables on account of legitimate capping on account of the team’s actual real needs when the innings was played.
This series will conclude with comparing all Australian batsmen who played with the Waugh twins in Ashes battles between 1986 and 2001.
Once Upon a Time on the Roar
Roar Guru
How do the runs themselves have any sort of numerical merit when the match was already a certain draw when they were scored?
matth
Roar Guru
Let's agree to come at this from different points of view. I prefer a broader view that is more consistent over time and between players and matches. you prefer a detailed examination and categorisation of each test, innings and performance within them. They both have merit. And in my opinion those runs did have merit. Resting our bowlers possibly preventing injuries, tiring their batters, making their batters wait with uncertainty as to when they would have to change from fielding to batting, demoralizing and tiring their bowlers further, etc. But mainly it's just a difference in philosophy, you pick a match and say "look, this proves my point". I don;t disagree, but over a career and 2,500 test matches that type of subjective work removes the ability to apply broad brush strokes and compare across era's, unless you have watched all those matches and statisticians all agree with your decisions on each match in how to treat each performance therein.
Once Upon a Time on the Roar
Roar Guru
It’s flawed for the reason of my example. I don’t know how all the players that came out good would come out if that important consideration I outlined was properly incorporated. How many players with a better century rate of evey 5.8 tests have a better record than 35% of them the only ton in the match I wonder. Anyway, have a look at the scorecard of the 3rd test of the 1989 Ashes series and tell me what would happen if Australia declared at 0 for 0 in their second innings with 62 overs left in the match, and then tell me whether any of the 158 runs Australia scored exerted any impact whatsoever on the result of the match ….
matth
Roar Guru
The averages are compared to peers in those same matches, so over a career shows whether a player, for example performed 30% better than his peers in all wins in which he participated. That will obviously include runs in various situations but over a decent career will show a player overall contributed more or less than his peers in wins. With a minimum 10 wins the players with an average more than 50% better than their peers in those same matches were The Voges Anomaly, Bradman, G Chappell, Smith and Walters. Bobby Simpson was 49% which was very admirable for an opener. S Waugh was 37%. M Waugh’s was actually negative 1.1%. So in all wins he participated in, he performed roughly the same at the rest of the Top 7, over his entire career. In losses only Trumper, Warner, Bradman and Harvey were at least 50% better than their peers. In draws it was Bradman, Macartney, Border and Clarke. On the world stage, the most interesting discovery was that each of Hobbs, Sutcliffe and Hutton performed significantly better in losses (on raw averages) than any Australian. The other winner was Andy Flower. No one beat the top Australians in wins or draws.
Once Upon a Time on the Roar
Roar Guru
So if a batsman scores 199 in a 450 run win, 135 in an innings and 200 not out run win, 96 in a 10 wicket win, 10 in a 3 wicket win and a duck in a 22 run win, you consider that to be an average in wins of 132.4 and is superior to someone who top scores with 67 in a 2 wicket win, scores the only century in the match, 111, in a 30 run win, top scores again with 70 in a 55 run win, scores the only century for his team in the match, 109, in a 60 run win, top scores for both teams in the match with 55 in a 10 run win and is second top score for his team with 44 in a 3 wicket win?
matth
Roar Guru
You can click on profile and search back for the articles if you like. M Waugh was not specifically profiled, I think I did about a dozen through history. But the data tables were done for every Australian player so if you read them for the method still want M Waugh’s stats I’ll be happy to pass them on.
matth
Roar Guru
I didn’t slice and dice. It was all wins for each player and comparison with all other top 7 batsmen in those wins. It’s just a philosophical difference in our respective approaches, and there is no universally acclaimed ‘right’ answer PS Roland Perry, the veteran cricket writer has just released a new book “Bradman vs Bodyline”. Should be interesting given he spent six years interviewing Bradman and also personally spoke to Larwood, Jardine and others over the years.
sheek
Roar Guru
Sad...
Once Upon a Time on the Roar
Roar Guru
“For it appears that many of his peers had the ability to reach a level of performance that is beyond him in other circumstances”. Name some specific situations … just five would be a start … You are making the ignorant assumption that he went to the wicket every time determined to make as many runs as he could. In reality, he went to the wicket trying to do what his team needed him to do, and he succeeded far more often than not when his team really needed something from him. “Another thing that irks me about this type of analysis is that if M. Waugh had already played two series against the Windies and he possessed this ability to switch gears why did it take us three series to beat them? To be very pointlessly specific, he scored 0 and 26 when we lost by 1 run. A few more runs on the board in that test would have been standing up to the occasion”. FFS, we were two runs away from winning the second series he played in against him and he was our best batsman in his first series against them as well as the first three tests of his second series against them when we were leading 1-0 when we had trailed 0-1, 0-3, 0-3 and 0-1 at the same point in our previous four series against them. Then he played one of two decisive innings in the deciding test when we did beat them in his third series against them, and then was leading run scorer for both teams when we beat them again in his fourth series against them.
Once Upon a Time on the Roar
Roar Guru
Just thinking about it all Dave, as I said I focus on the match situation when the batsmen went in to determine pressure average. While the closeness of the result is not irrelevant by any means, if that is all this Davis character focusses on, then he may well miss some vital nuances. What about this situation … a team is chasing 200 in 4th innings, and they are cruising at 0 for 100, with both openers on 50. Then they have a collapse of 5 for 40, and eventually scrape home by 2 wickets with one of the openers 100 not out. Those 100 runs are all meaningful, priceless in fact, but the first 50 were made completely without authentic pressure. The pressure built gradually as those first five wickets fell to reach a peak at 5 for 140 that was then maintained as the 6th, 7th and 8th wickets went down at 155, 169 and 191 respectively. Does Davis account for this kind of thing regarding pressure average?
Once Upon a Time on the Roar
Roar Guru
Although my approach focusses more on the match situation when the player went to the wicket.
Once Upon a Time on the Roar
Roar Guru
I follow that same criteria pretty much to arrive at Mark Waugh's averages of 34 in situations of no authentic pressure, 38 in situations of mild pressure, 47 in situations of genuine standard pressure and 51 in situations of extreme pressure. Bear in mind, some of his innings under pressure I have capped, such as his 113 not out in Durban 1994 at 70 and his 115 not out in Adelaide early 1998 has been treated as 0 not out, only considering the number of balls he faced in a game we could not win, but highlighting the need for a type of statistical annex for this type of situation.
Once Upon a Time on the Roar
Roar Guru
Mark scored 20 test tons, only five Australians before him had done that. Seven of those tons were the only one in the match for either side, for six wins and one draw, the draw a deciding test which ensured Australia did not lose the series. One of the wins was also a deciding test. On another two occasions, he was the only centurion for Australia in the match for one loss, the only one when he scored a ton in a loss, and a draw, once again, in a deciding match, which while drawn, Australia should have won it, but we led the series so won the series anyway. On five occasions he was the only centurion in the innings, for three wins and two draws, both draws were deciding test with us leading going in, and one of the wins was also a deciding test which sealed a series win. The other two wins were our first in many years in both India and the West Indies, while dead rubbers, were the catalyst for subsequently winning series there. In most of those tons, he easily outshone his team mates for strike rate, often conspicuously so, and sometimes he also outshone the opposition in both runs and strike rate. What exactly was your criteria?
Once Upon a Time on the Roar
Roar Guru
“Sometime ago I published articles showing the greatest players in wins, losses and draws by comparing batters’ performances against their peers who were in those same matches. M Waugh did not even feature in the top echelon.” You must have had some biased criteria, because look at Mark’s performances the seven occasions he made a century in a deciding test. Did you separate dead rubbers when they had lost the series for example?
Once Upon a Time on the Roar
Roar Guru
“Yes but using the author’s method many of Border’s great efforts are given … wait for it … ZERO weight as Australia would have lost anyway or that it was batting for a draw any way so runs are irrelevant.” Which Border efforts would they be Matth? His 98 not out and 85 of his 100 not out in POS 84 qualify, as does his 163 against India in Melbourne 1985-86, and his 125 in Perth against England 1986-87. His 205 in Adelaide against NZ 1987-88 does not, nor does his 152 not out against NZ in Brisbane 1985-86. Mark Waugh’s 84 in Melbourne against South Africa 1993-94 also does not qualify and his 115 not out in Adelaide 1997-98 is treated as 0 not out. What exactly is your problem? To be frank, I’m getting a little fed up with your ignorant snide remarks.
Once Upon a Time on the Roar
Roar Guru
All runs exist when entered in the score book Matth, the only runs of Crowe's disregarded when I am looking at match impacting runs are in games that had no potential for a result in the first place, and then in games that did, runs made after the match had already reached it's decisive point.
Once Upon a Time on the Roar
Roar Guru
Oh dear Sheek, he who only uses stats as a guide ... :shocked: :shocked: :shocked:
Renato CARINI
Roar Rookie
Agreed A missed opportunity
Once Upon a Time on the Roar
Roar Guru
If we want an underachiever and wasted talent than Matthew Elliott is your man. He had the cricketing world at his feet in late 1997 and I was convinced he was a much superior player to Hayden.
Once Upon a Time on the Roar
Roar Guru
Yeah I've always taken that as a given. And Trumper in Waugh's time would have been totally unjustly pillared from post to post as a wasted talent, and under achiever and even ignorantly accused of letting his team down when needed.