For most of the first decade of the new century and millennium I was a TESOL teacher, mostly in Jakarta, but also nearly one year in Brisbane, almost to the end of 2008. TESOL stands for ‘Teaching English to Speakers of Other Languages’ and it is pretty big business.
When a prospective new student came along to part with their hard-earned money, the placement Test to find their level was beyond belief. They were given 100 multiple-choice questions all at elementary level, elementary meaning beginner.
Imagine Budi scores 99/100 and Dewi 79/100. Is the one who scored 99 better versed in the English language to this point than the one who scored 79? What if this system dictated that scores above 95 go into advanced level, 80-94 upper intermediate, 65-79 intermediate, 50-64 lower intermediate, and anything below 50, elementary.
What if we capped the elementary level questions at 20, and added 20 each for the other four levels up the chain of second or foreign language learning, i.e. lower intermediate, intermediate, upper intermediate and advanced?
This time Budi scores 66/100 while Dewi only scores 51/100. Is Budi still better? What if, according to recognised linguistic experts, prospective students were correctly deemed to not have a sufficient grounding for the next level up if they scored less than 16 in any of the five section levels of the placement test?
So, Budi scores the following: 20/20 in elementary, 13/20 at lower intermediate, 12/20 for intermediate, 11/20 for upper intermediate and 10/20 for advanced.
Dewi scores 18/20 for elementary, 17/20 for lower intermediate, 16/20 for intermediate and has no idea about either upper intermediate or advanced. She doesn’t attempt either, and hence, scores 0/20 for each.
Under the legitimate regulations, Dewi will be able to cope fine with upper intermediate and there is no need to hold her back below that level, whereas Budi clearly does not yet have a sufficient enough grounding of even lower intermediate – place him any higher than that and he will struggle and go nowhere with his second language development.
Cricket is like the way I described above and will continue to be so until we stop looking at Jacques Kallis averaging 55, Steve Waugh 50, and Mark, of course, less than 42 and ranking them accordingly.

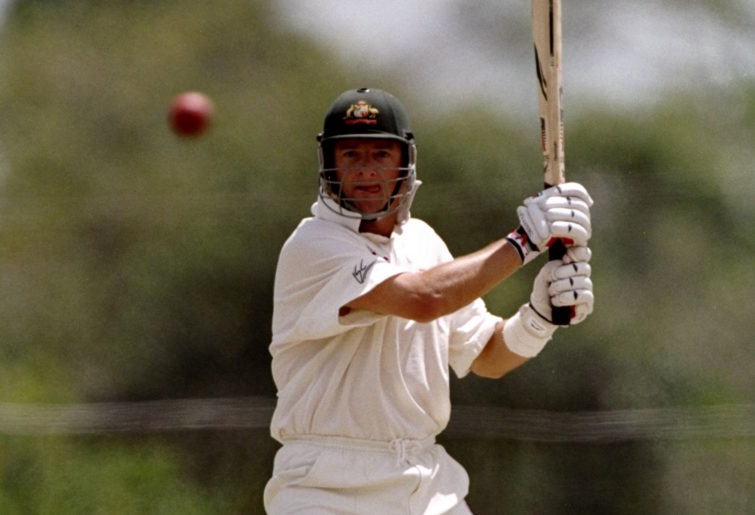
(Credit: Shaun Botterill/Allsport/Getty Images)
In the above example, Dewi, who scored 51 per cent overall, already has enough speaking prowess in the second language to assist her country’s president or prime minister in welcoming a head of state from another country who they are at tension with, and discuss a few of the problems, in the foreign language, whereas Budi, who scored 66 per cent, struggles to order a coffee in a café when he comes to Australia.
So, now to capping in Test cricket.
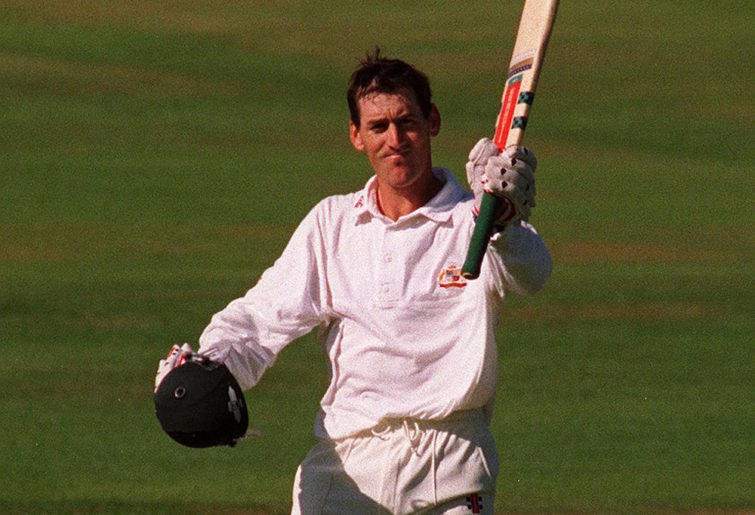
Does anybody really, seriously, think that Joe Burns scoring 51 not out chasing 90 for victory rates anywhere near as highly as Matthew Elliott scoring 44 in Australia’s run chase of 270 at Port Elizabeth in early 1997? More on that in a bit.
Steve Waugh, a fabulous player, scored 26 not out in Australia’s second innings in the Melbourne Ashes Test of 1994-95. His 94 not out in the first innings was priceless in a bowled-out total of 279 batting first.
When he came in that second innings, Australia were four down and 336 ahead, and nobody in the know at the time would have given England even a whisker of a chance of even chasing down 236 batting last.
The 94 was magnificent, as was Mark’s 71, but what bearing did the 26 have on the outcome of the match? Mark’s second-innings 29 at least came when Australia were only 147 ahead when he came in at two down.
These are some examples of why we need to grade batsmen on a similar scale as the second example of the afore described TESOL placement system.
First innings
At Headingley in 1993, Australia, batting first, scored 4-653 declared – not exactly an even contest between bat and ball. England had a very weak bowling attack that series, so run scoring was ridiculously easy. Mark Waugh contented himself with 52. How much was needed from him and the other batsmen?
England made 505 in two innings in reply. It is not one little bit retrospective to say that scoring 500 batting first as good as always protects you from defeat, and if you score quickly in getting to 500, then your opposition will not avoid defeat too often, other than when conditions don’t facilitate an even contest between bat and ball.
So let’s cap Australia’s innings at 500 in that Headingley 1993 innings. With the bowling England had, Ian Healy, extras and the tail were good for a conservatively estimated 100, so they needed 400 from the top six. Michael Slater made 67, Mark the aforementioned 52 and Mark Taylor 27, so the other three — David Boon, Allan Border, and Steve Waugh — needed 253, or 85 each. They made 107, 200 not out and 157 not out each.
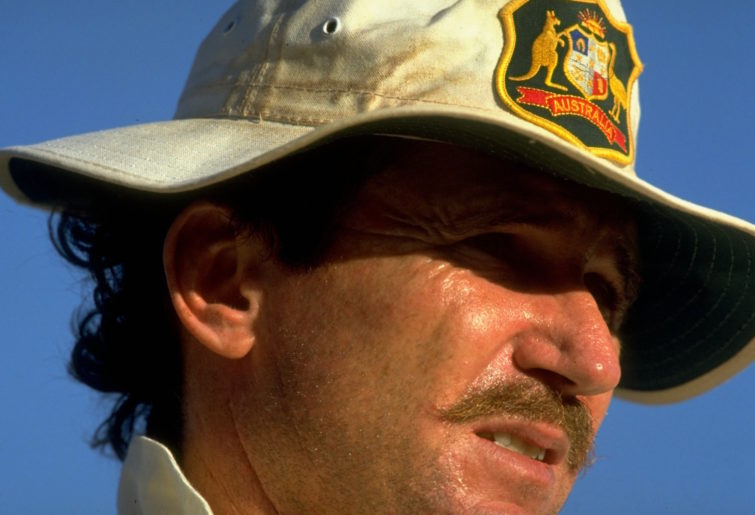
(Credit: Ben Radford/Allsport via Getty Images)
Retrospective-ness is completely irrelevant. None of Boon, Border or Steve Waugh were under any semblance of pressure whatsoever in making runs beyond 85 to their own personal scores.
Second innings
In Kolkata in 1998, Australia were bowled out for 233 to which India responded with 5-633. Does anybody seriously believe India needed to take a lead of anywhere near 400 to assure victory?
Mohammad Azharuddin came in three down and 114 ahead, no more than 50 runs away from the opposition being in lost-cause territory in their eventual subsequent second innings, and scored a majestic 163 not out.
What would you cap Azharuddin’s score at in terms of impact on his team’s victory aspirations? By the time he had scored 30, India were 400, 167 ahead and there was never going to be any way back from there for Australia. By the time he reached 50, they were 200 ahead.
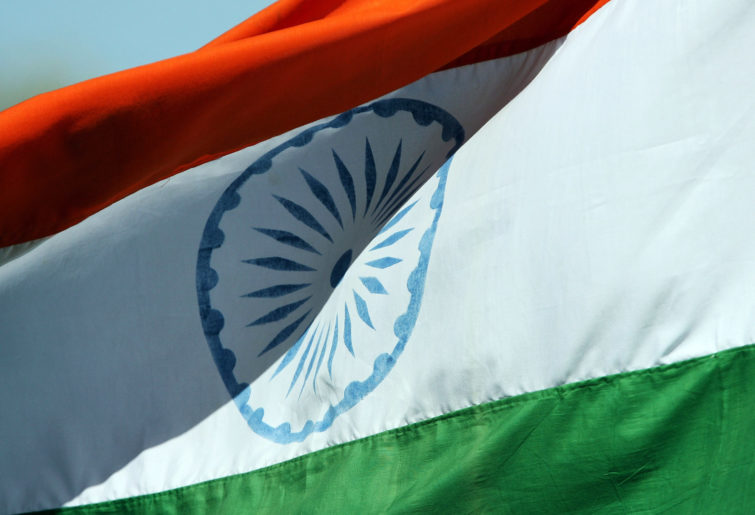
(Photo by Simon Cross/Getty Images)
Only six times in 145 years of Test cricket has a team won after trailing by more than 200, and not too many more occasions either when the deficit was 150 or more. The chances of surviving for a draw are also minuscule when so much time is still left in the match.
To get from 347 to the aforementioned 400, and then 433, India had three batsmen left, plus a keeper who could bat, Nayan Mongia, as well as the four bowlers making up the tail.
We can safely say that India needed only ten-15 runs from those four batsmen including Azharuddin and Mongia to complete the elementary task of putting Australia well and truly into the lost-cause region for their subsequent third innings. The exact same applies for Australia batting second in the Sydney Test some 20 months later.
Third innings
At Lord’s in 2015, England made 361 and then bowled Australia out for 128. Joe Root, opening, made 180 when England curiously declined to enforce the follow-on. How much did England actually need from Root to guarantee a comfortable victory?
Only four times in 145 years of Test cricket has a side successfully chased down 400 in the fourth innings, only eight times between 350 and 399 inclusive, and a further mere 26 times between 300 and 349 inclusive. The highest successful run chase is 418, so as long as England totalled 200 in their second innings, they were as good as guaranteed victors.
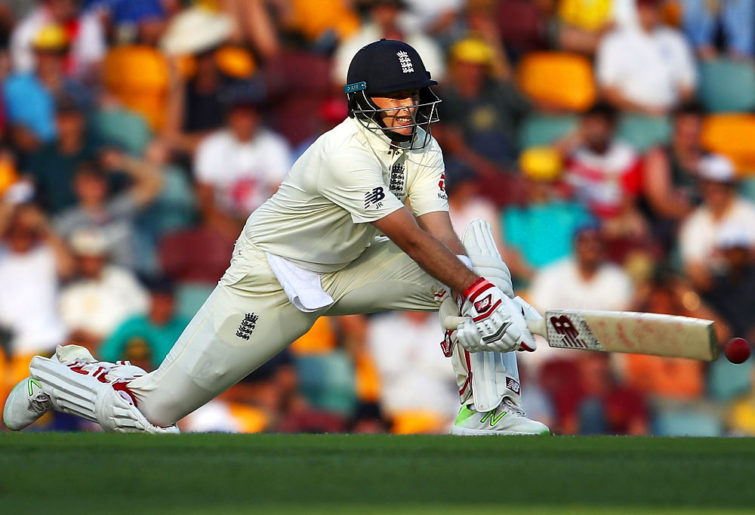
(Photo by Mark Kolbe/Getty Images)
With Tim Bresnan, Stuart Broad and Graeme Swann all very decent tail-end batsmen in the comforts of home at that stage of their careers, along with James Anderson and extras we can expect around 60 runs from them all. This leaves 20 each needed from the six batsmen plus keeper Matt Prior.
Alastair Cook, Jonathan Trott and Kevin Pietersen were dismissed for five, zero and eight respectively, so now England needed 127 from the remaining four batsmen including Prior.
Bresnan came in as night watchman at the fall of the third of those three wickets and made 38 the next day. His wicket fell at 129. Root was on about 70 at this stage, but now England only required 71 from Root, Jonny Bairstow, Ian Bell and Matt Prior, plus Broad, Swann and Anderson.
Those three bowlers plus extras were surely good for another 31 between them, so only ten was needed from each of the four remaining batsmen. In pushing beyond 200, Ian Bell made 74, Jonny Bairstow 20 and Prior was one not out when the long overdue declaration came.
We can safely, and somewhat generously, cap Root’s meaningful contribution to the team cause at 80, with the 100 he scored beyond that benefitting his personal statistics much more than the actual team cause.
Fourth innings
In Adelaide in late January 1996, if Sri Lankan opener Sanath Jayasuriya was ever actively chasing the 401 target they had been set in this dead-rubber third Test, he forgot to tell the rest of his batting cohort.
In order to win, they needed to maintain a strike rate of 57 runs per 100 balls off the bat, and Jayasuriya managed 59.6 in scoring 112, third out at 195.
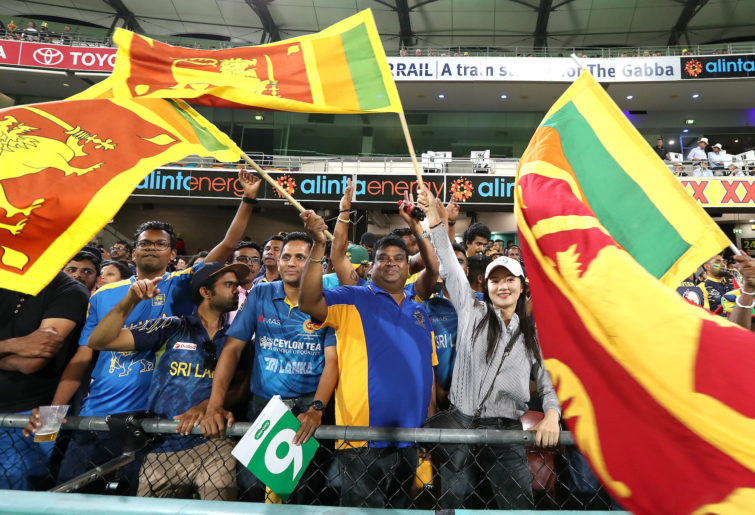
(Photo by Jono Searle – CA/Cricket Australia via Getty Images)
However, the first of anyone else in the line-up to strike at even higher than 33 was the number nine, Chaminda Vaas, who made 26 off 32 coming in at 7-216.
Sri Lanka were bowled out still 148 runs in the red and Australia achieved this task with around an hour to spare. My gut feeling is that Jayasuriya would have served his team better if he had absorbed another 50-100 potential wicket-taking deliveries in order to secure his team a possible honourable draw to avoid the 3-0 clean sweep by the opposition.
Australia in South Africa 1997
There is one particular Roarer who would no doubt fondly say, ‘Look, we only use averages as a guide, but you simply can’t argue with 77.8 against 54.2 against 41.8’.
I am talking, of course, about the overall raw, undissected averages for this particular series for Steve Waugh, Greg Blewett and Mark Waugh.
Greg Blewett averaged 54.2 by scoring 214 in the first Test, and then a combined 57 across four innings in Tests 2 and 3.
Steve averaged 77.8 by scoring 160 in the first Test innings and 196-run mauling, then eight and 18 in the mere two-wicket win to seal the series in the second Test, and then 67 and 60 not out in the third Test dead-rubber defeat, which obviously had no bearing on the series result.
Mark averaged 41.8 by playing the lone-hand 116 in the narrow two-wicket win to seal the series in the second Test in addition to 93 combined in his other four innings.
But what was the true impact of all three of these batsmen in securing this series triumph?
In the first Test, Steve went in upon Mark’s dismissal for 26 with the score 3-169 and was then joined by Blewett with the score at 4-174. In reply to 302, such a scoreline is certainly not completely devoid of any sort of pressure.
However, with Matthew Elliott already paving the way with a hard-hit 85 from only 113 balls, and the pitch playing well, it was surely a reasonable expectation that the rest of the batting line-up could at the very least double the team total from that point, which puts the match into even-game territory.
(Photo by Daniel Pockett – CA/Cricket Australia via Getty Images )
Batting outstandingly in good batting conditions, when Steve and Blewett reached their respectively tons, Australia were then more than 80 in front.
And it was surely a given that thereafter, Michael Bevan, Ian Healy, and the three bowlers Jason Gillespie, Shane Warne and Glenn McGrath, plus a few more extras could increase that lead by another 70 or so, which already put South Africa into lost-cause territory, more than 150 behind when they started their second innings, the third of the match.
As it turned out, Bevan made 37 and was not dismissed, while Healy and Warne made another 20 between them with the other two bowlers not even batting.
Capping the innings of Steve and Blewett at 100 under the circumstances, surely that gives a more realistic impression on the impact the two had, along with Mark Waugh, in sealing the series after Mark’s phenomenal lone hand in the second match.
Adjusted statistics, after wrapping up the series in the second of three Tests, of Steve’s 126 meaningful runs at 42, Blewett’s 120 at 40 and Mark’s 162 at 54 is a lot more accurate in accounting for Mark’s lone hand, in a match where he scored 136 runs against 187 by his seven batting colleagues combined, counting wicketkeeper Ian Healy.
His strike rate of 51 (runs per 100 balls) was also nearly twice as high as the combined 28 from those same seven batting colleagues. This was a match in which only one batsman came even close to mastering the conditions that were extremely lopsided in favour of the bowlers on both sides.
The dark horse
Coming in at 1-33 in reply to 302 in the first Test of that series, Matthew Elliott dominated the scoring in making 85 of the next 141 runs, even in among Mark Waugh scoring 26 off only 34 balls. Elliott’s strike rate was 48 per cent higher than Blewett’s and 72 per cent higher than Steve’s.
Elliott’s innings was played when South Africa’s bowlers were really gunning for Australia’s batsmen with a competitive 302 already posted, while Steve and Blewett’s innings were played after Elliott had stunned the South African bowlers.
Elliott’s 85 at a much faster scoring rate to seize the momentum Australia’s way was also 85 per cent of the capped meaningful value of Blewett and Steve’s runs.
(Brendan Monks/EMPICS via Getty Images)
Then in the second Test, Elliott top scored with 23 in Australia’s ill-fated first innings, three more than Mark, albeit at a much slower strike rate compared to the first Test.
In the second innings in Port Elizabeth, Elliott was the only batsman to hang around for a decent partnership with Mark (of 83) in their historic run chase. His 44 was easily the second highest score of the match for Australia, and only three South Africans made higher scores (55, 49 and 47).
Therefore, we can say that Matthew Elliott was the only Australian batsman to exert any genuine impact in both Tests that Australia won to take that series. His 152 at 50.7 in those key two Tests is actually higher than Steve and Blewett’s figures after legitimate capping of their first Test tons.
I have taken the trouble to explain the totally legitimate rationale behind capping to prepare Roarers for the Ashes comparisons between Mark and Steve Waugh as the next instalment in the series.
I can give a sneak preview and reveal that Steve will marginally outperform Mark, although the two will not stand out from the pack in anywhere near the same manner as with the West Indies, South Africa and Pakistan.
In those upcoming Ashes comparisons, there is a humungous amount of legitimate capping to be done on account of the ridiculously humungous scoring in 1989, 1993 and to a lesser extent 2001.
Rowdy
Roar Rookie
I think you said you were an October Scorpio once. Or maybe it’s your obsessive, forensic devotion to your mathematical reimagining of player ratings. Many deep researchers are Scorpio. Especially in the study of crime and medical fields leading to become such professions as psychological profilers, detectives and medical specialists. ——- Good work, l don’t agree with a lot of it but it’s good to be challenged. I believe words do better justice than numbers.
Once Upon a Time on the Roar
Roar Guru
How did you know?
Rowdy
Roar Rookie
It was in relation to the Sheek's post about it.
Rowdy
Roar Rookie
I knew it was around about now.
Once Upon a Time on the Roar
Roar Guru
The capping is not designed to rewrite scorebooks. What's in the scorebook stays, including a 7th ball carelessly allowed by an umpire in an over, or part of an 11th over carelessly allowed by scorers in a limited overs match of 50 overs a side. It is merely an excellent technique of separating valuable runs from not so valuable runs.
Once Upon a Time on the Roar
Roar Guru
My birthday was six days ago.
Once Upon a Time on the Roar
Roar Guru
And MW averaged 61 in 18 successive deciding tests in a 6 year period between 1993 and 1999, with 17 50+ scores in those 18 tests, 6 of them tons against the top four teams of West Indies, South Africa, Pakistan and England. What point was you making Rowdy my good mate?
Once Upon a Time on the Roar
Roar Guru
Yes I did address it. You claimed that runs scored in a 4th innings when a side is not chasing an out of reach target actually increase your chance of hanging on for a draw and decrease your opposition’s chance of winning it. They don’t. Only the balls that get used up that don’t get you in that situation matter. Why on Earth do u dispute this? _______________________________ 3rd innings deficits are a different kettle of fish as I pointed out.
Rowdy
Roar Rookie
Happy Birthday Rider of the Pale Horse!
Rowdy
Roar Rookie
51 as captain, and not just any captain, the best Australia has ever had. Chapps had a difficult start and the 2nd half of his career was with a wet sail. MW was mediocre all the way with the occasional career saving events.
Rowdy
Roar Rookie
51 as captain.
Rowdy
Roar Rookie
..... or whose running in the 6th at Dapto.
DaveJ
Roar Rookie
To try one last time and give you an example: this is what you described as codswallop: “runs scored are not only measuring contribution to a result but also success rate in scoring against bowlers who are trying to get you out.” Your response didn’t address that at all. In fact, it’s almost impossible to contradict this statement. It’s not saying it’s the only or most important measurement. Saying the only thing that has meaning in ball in such a situation in batting for a draw is an extreme black-and-white view and highly contestable - I’m being polite here - and it’s hardly codswallop to say it’s possible to draw other significance from those runs.
Once Upon a Time on the Roar
Roar Guru
Australia declared at 6 for 500 and had about 30 runs to chase in 4th innings after enforcing the follow on. Do you really think Australia needed Mark to make any more than 61 that day against that particular minnow on our own home soil from that 2 for 219 position?
Once Upon a Time on the Roar
Roar Guru
Yeah I mostly get away with it too, but the first, the west Indies leg of the waugh story, got rejected until i culled it back to 2300, after they said 2000.
All day Roseville all day
Roar Guru
Hi PR, I work to a 3,000-word limit, and always get published intact.
Ball Burster
Roar Rookie
Your "capping" technique comes with a conceptual difficulty. It applies zero value beyond a certain point (which is an aspect of Expected Value theory). But we know that no runs are equal: runs against the new ball are not not same as runs against a tired attack at the end of the day, etc, etc. My other observation is that abstractions about averages are well taken, but they are unlikely to enlighten or help the common and garden supporter.
Renato CARINI
Roar Rookie
Definitely
Once Upon a Time on the Roar
Roar Guru
We sure have been brainwashed regarding Bradman and shallow statistics haven't we.
Once Upon a Time on the Roar
Roar Guru
Sometimes a 4th innings can fall between the two stools because the team starts out chasing, or at least keeping half an eye on the target, but then get to a point where it is no longer feasible, either having fallen too far behind the required run rate or lost too many wickets or even both at the same time. An example of this was the 3rd test of the 2005 Ashes series. It looked like they had not given up the possibility of chasing down the target up until Michael Clarke got out for 39 off 63 balls with the team score upon his dismissal 6 for 263, 160 from a possible, if unlikely victory. Ponting’s score at the time was in the 110-115 range. So a proper statistical analysis would regard those first 115 runs as priceless under the circumstances, but the last 41 completely numerically meaningless having given up the chase and turning entirely to a focus on survival. Thereafter, while further runs meant absolutely nothing, the 80 odd further balls he absorbed to take the team to a mere 4 overs from time being called retained their absolute pricelessness.