A weird phenomenon occurred before the Panthers vs Raiders match. On social media I saw both sides supporters claim that referee Henry Perenara was biased against their team.
‘Surely that can’t be’, I thought. The ex-Warriors, Storm, Dragons, Eels and Sharks player has courted some controversy as a referee, but how could he be biased against both sides? And if he was, how would that possibly be demonstrated?
What this situation really brought home to me was that supporters frequently claim that certain referees are biased against their side and that their claims are most probably based on very little.
With thanks to my great friends at The Rugby League Project, I crunched the numbers.
To be included the referee had to have controlled, either as lead or assistant referee, at least ten games for the club in question.
I’ve also included the referees with the all-time best and worst winning percentages for each side as well – and each sides winning percentage over the last decade for reference.
Before we start, let me stress that I am firmly of the opinion that every statistical set as a matter of course must have outliers. The existence of outliers is not by any stretch proof of referee bias.
Our officials are hardworking and dedicated. They take great pride in getting decisions right. That is their aim. Any suggestion of bias on the part of referees I believe to be spurious.
But I also enjoy looking at the numbers.
Let’s look at the sides in current ladder order.
St George Illawarra Dragons
| Ten year winning percentage | Best referee and winning percentage | Worst referee and winning percentage | Best referee and winning percentage (historical) | Worst referee and winning percentage (historical) |
| 52.8% | Henry Perenara (64.3%) | Chris Sutton 27.3% | Jason Robinson (76.2%) | Gavin Morris (26.7%) |
And straight up we see Henry Perenara as the current whistleblower who the Dragons most routinely win under, with a winning percentage well above their average over the last ten seasons. Conversely, when Bernie Sutton’s little brother Chris controls the Dragons they lose three-quarters of the time.
Penrith Panthers
| Ten year winning percentage | Best referee and winning percentage | Worst referee and winning percentage | Best referee and winning percentage (historical) | Worst referee and winning percentage (historical) |
| 50.2% | Gavin Reynolds (76.2%) | Adam Gee (30.8%) | Gavin Reynolds (76.2%) | Kevin Roberts (23.1%) |
The Panthers faithful should be very happy to see Gavin ‘Funky’ Reynolds rolling up to their games as they win 75 per cent of their games he is controlling. Gee is their best referee of all time percentage-wise. However, when Adam Gee turns up they would feel great trepidation as they win less than a third of the games he controls.

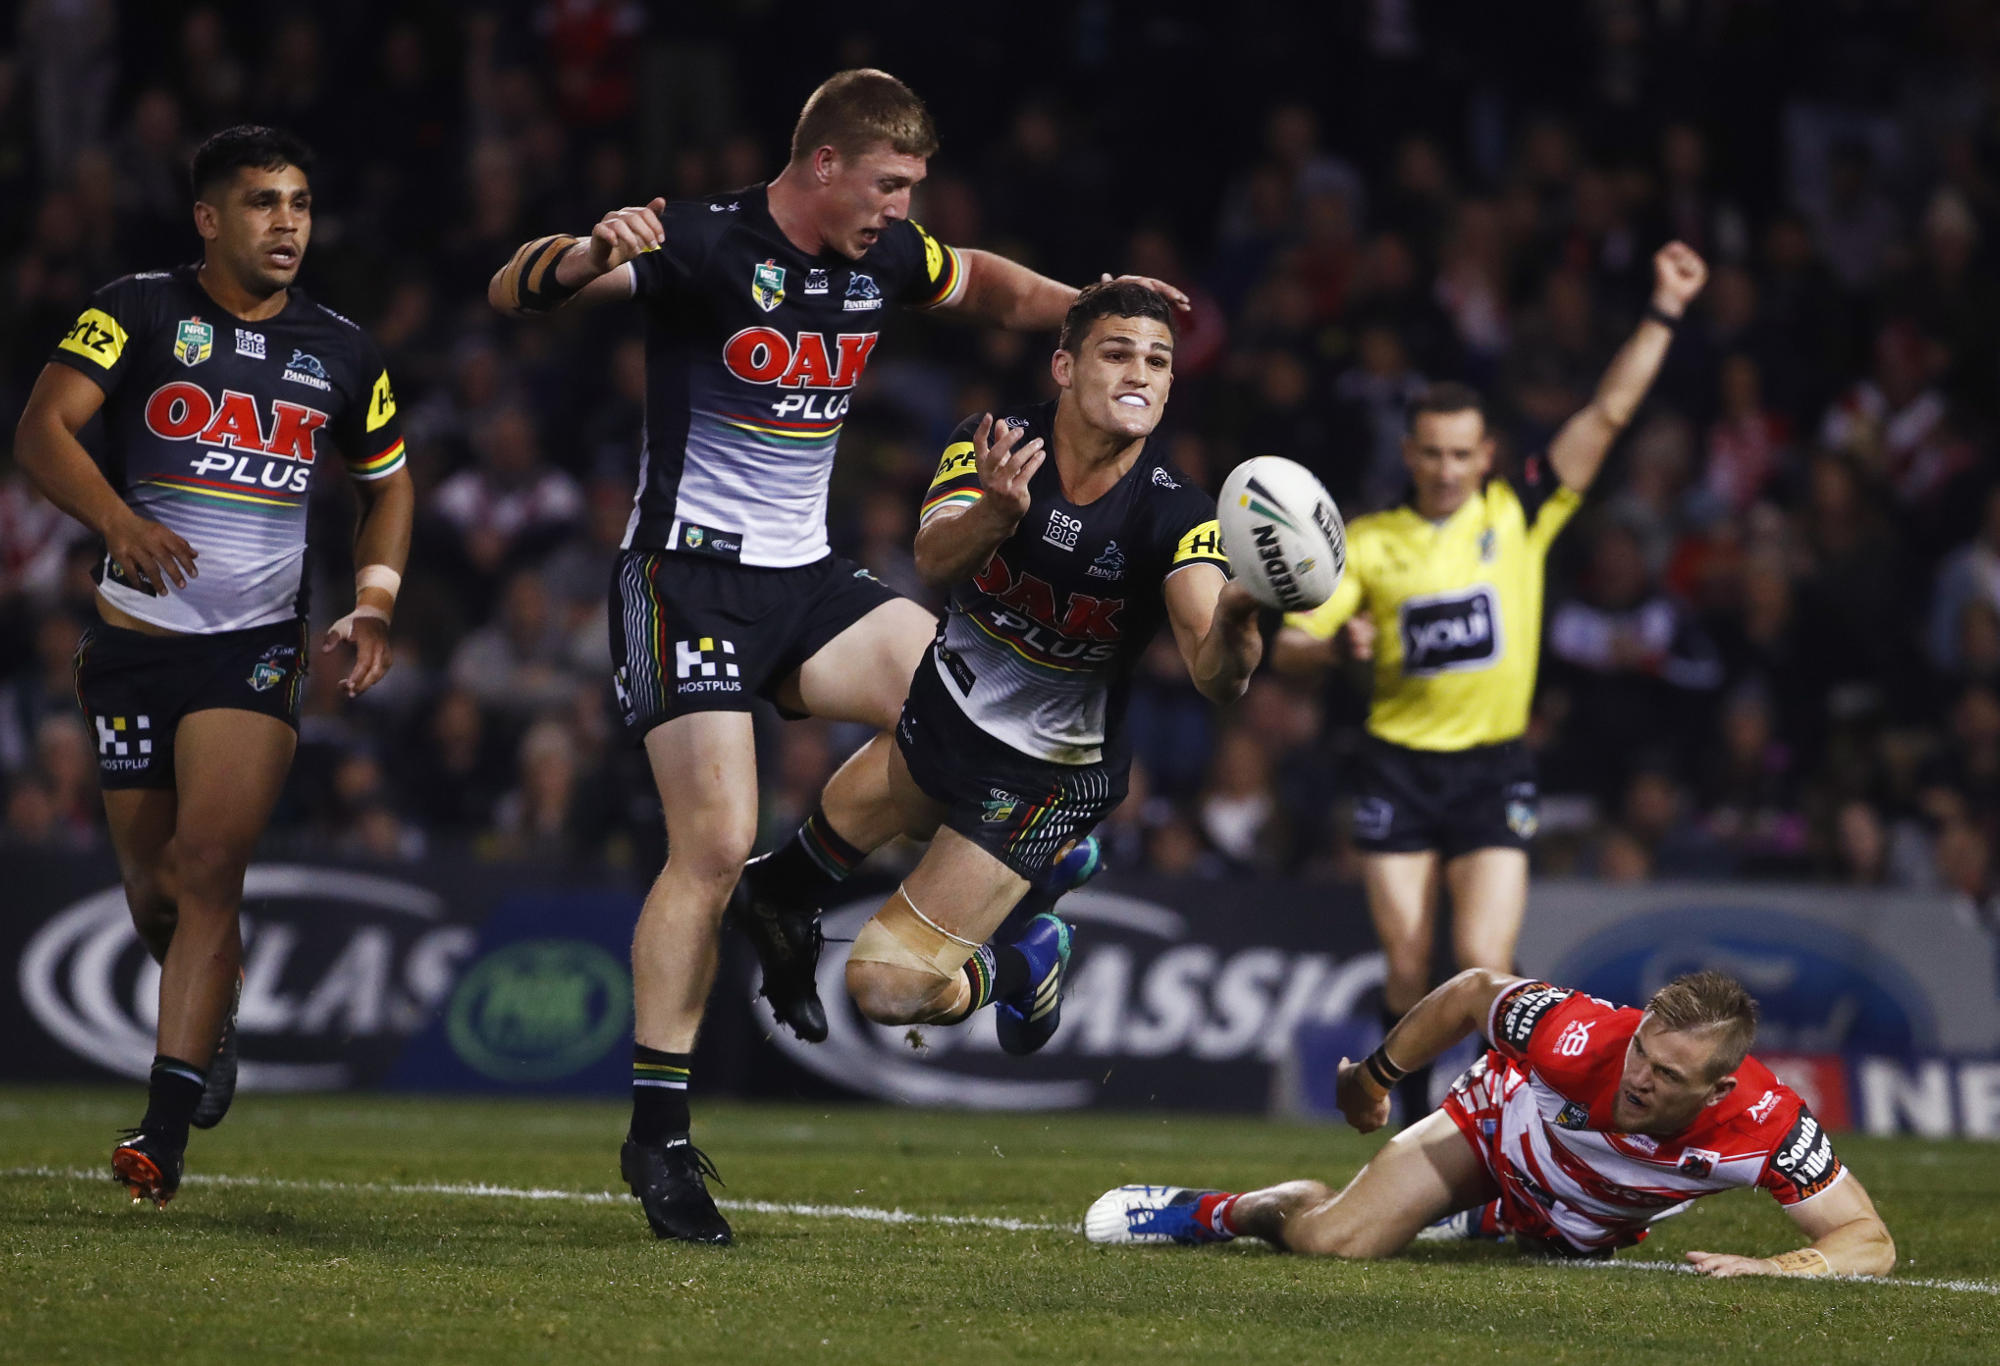
(AAP Image/Daniel Munoz)
South Sydney Rabbitohs
| Ten year winning percentage | Best referee and winning percentage | Worst referee and winning percentage | Best referee and winning percentage (historical) | Worst referee and winning percentage (historical) |
| 53.5% | Henry Perenara (68.4%) | Gavin Badger (41.3%) | Joe Murray (92.3%) 1921-1930 | Tim Mander (25%) |
And look at who the referee is that the Rabbitohs have the best winning percentage under. That’s right: its Henry! The Cardinal and Myrtle win over two-thirds of their games under the Auckland born Perenara. However, his record pales to that of referee Joe Murray who controlled the Rabbitohs in the 1920s: 92.3 per cent!
New Zealand Warriors
| Ten year winning percentage | Best referee and winning percentage | Worst referee and winning percentage | Best referee and winning percentage (historical) | Worst referee and winning percentage (historical) |
| 44.2% | Gerard Sutton (63.2%) | Chris Sutton (14.3%) | Brett Suttor (64.7%) | Chris Sutton (14.3%) |
Well here is a tale of two Suttons. On one hand the Warriors do quite nicely indeed under the oldest Coonabarabran Sutton sibling. However, under little bro Chris they barely win one match in ten. The Warriors would have been the side most disappointed when Brett Suttor had his whistle confiscated and replaced with a flag as he was the referee they have got their very best results under.
Melbourne Storm
| Ten year winning percentage | Best referee and winning percentage | Worst referee and winning percentage | Best referee and winning percentage (historical) | Worst referee and winning percentage (historical) |
| 68.4% | Gavin Reynolds (100%) | Henry Perenara (58.8%) | Gavin Reynolds (100%) | BIll Harrigan (35.7%) |
The key stat you need to know about the referees in regard to the Melbourne Storm is that only one of the whistleblowers who has controlled ten or more of their games had them with a winning percentage in the red: Bill Harrigan. However, when a side has a 68.4 per cent win ratio over the last decade, that is hardly surprising. The rest all have the Purple Horde on the happy side of the equation.
However, they are never so happy as when Gavin ‘Funky’ Reynolds turns up. They’ve never lost when he has controlled one of their games. Henry is the current referee under whom they have the worst results, with just a 58.8 per cent win rate.
Sydney Roosters
| Ten year winning percentage | Best referee and winning percentage | Worst referee and winning percentage | Best referee and winning percentage (historical) | Worst referee and winning percentage (historical) |
| 52.6% | Matt Cecchin (65.9%) | Gavin Badger (41%) | Mark Oaten (90%) | Tony De Las Heras (23.5%) |
Leading referee Matt Cecchin finally makes an appearance. The Roosters have won two-thirds of the matches he has controlled. That’s way better than their winning percentage. The perfectly manscaped Gavin Badger is the current ref whom the Bondi Boys do the worst under. The now retired Tony De Las Heras is the man under whom the Roosters historically have had their worst results under.
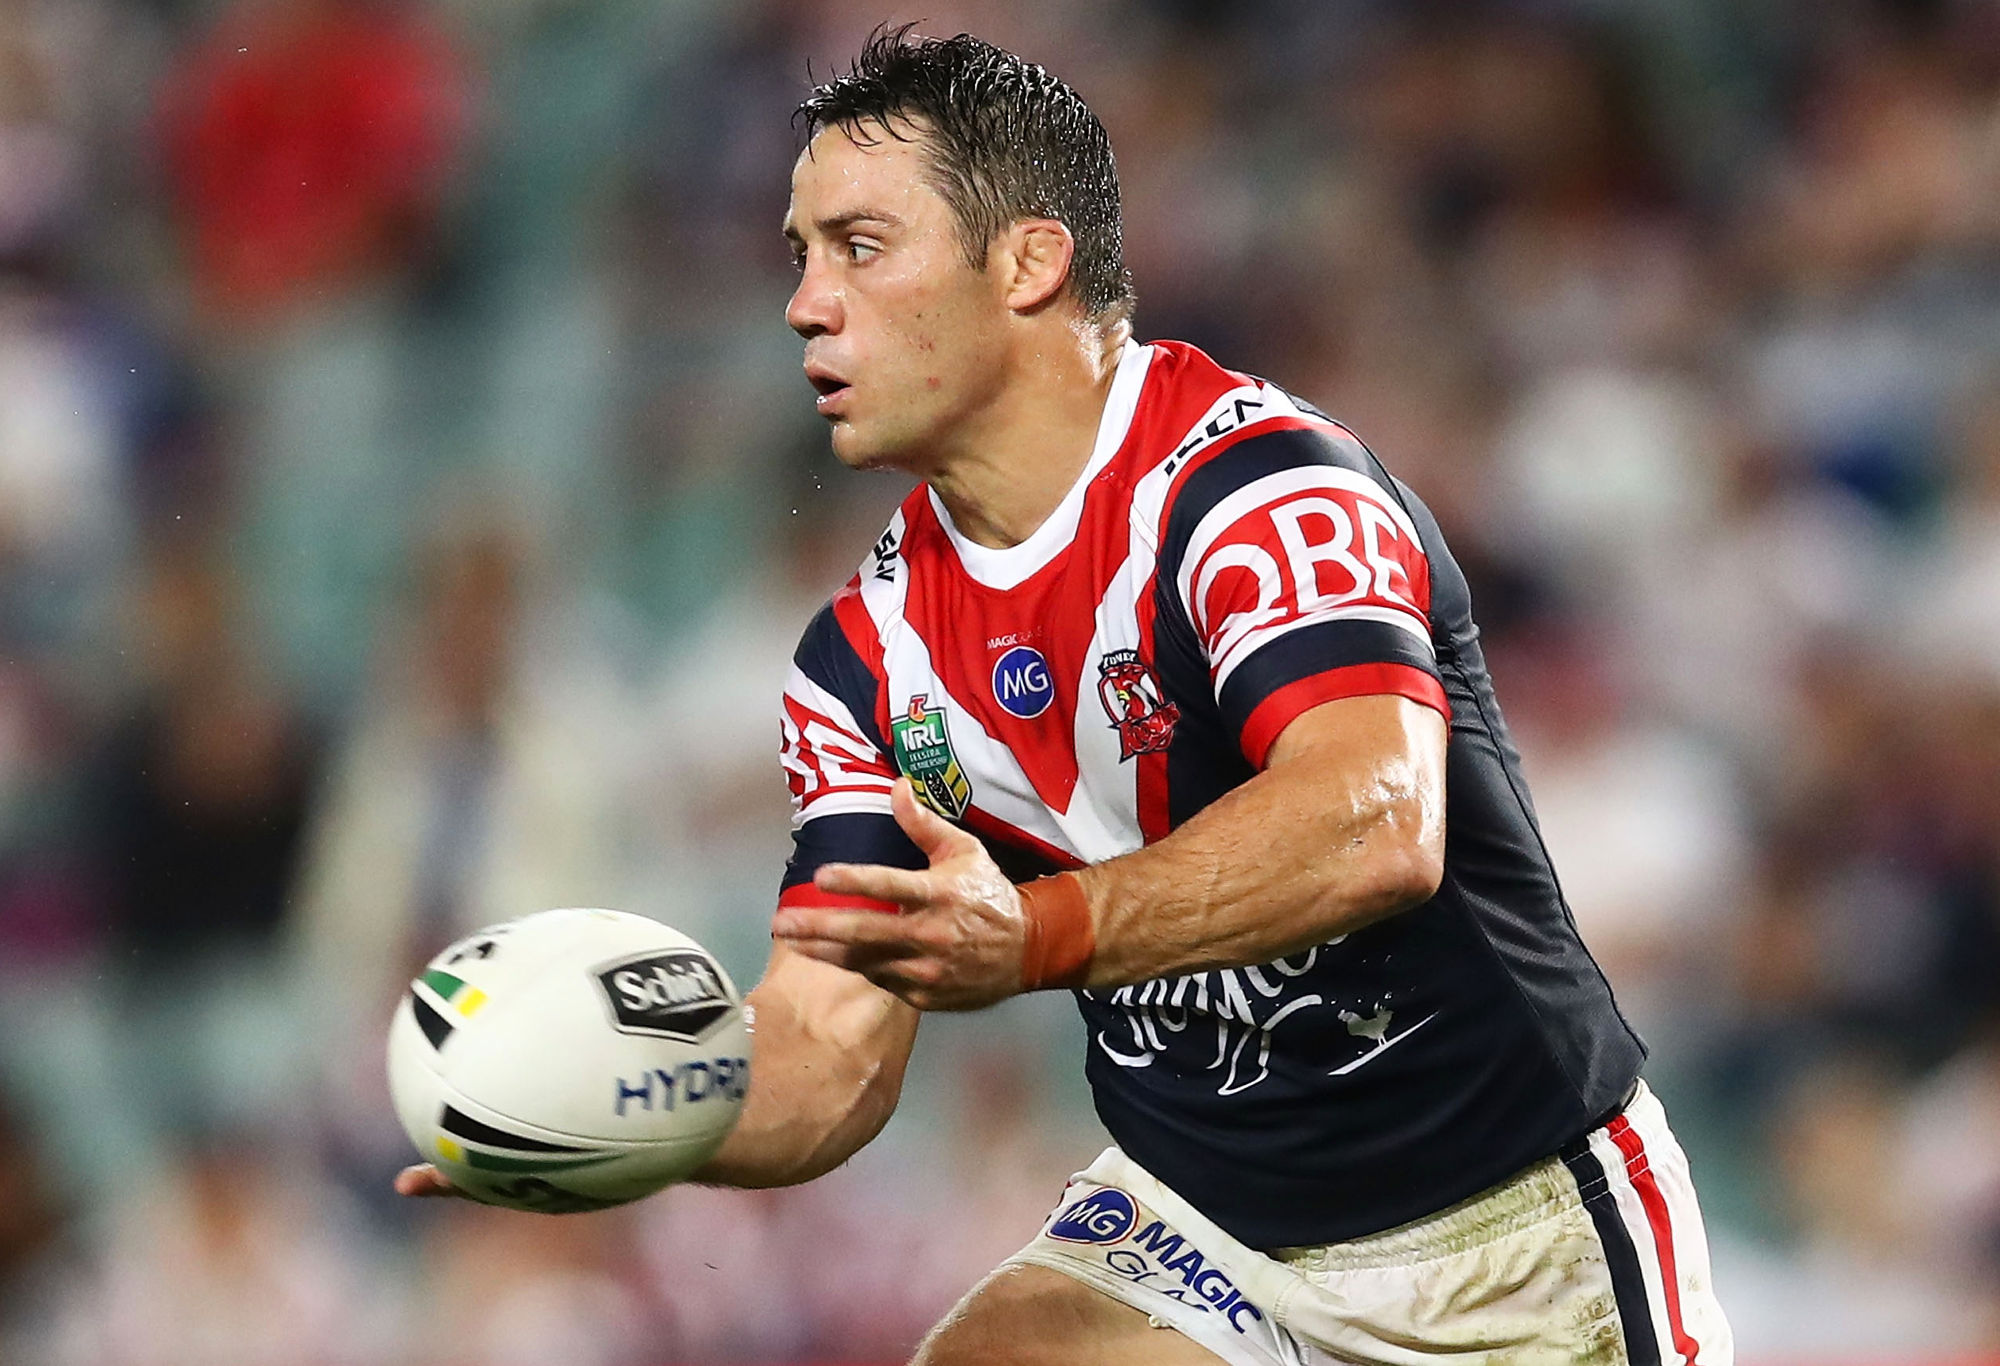
(Brendon Thorne/Getty Images)
Cronulla Sharks
| Ten year winning percentage | Best referee and winning percentage | Worst referee and winning percentage | Best referee and winning percentage (historical) | Worst referee and winning percentage (historical) |
| 46% | Matt Noyen (70%) | Gavin Badger (39.5%) | Brian Grant (75%) | Barry Barnes (27.3%) |
Once more we see Gavin Badger pop up as the referee under which a side has their worst results, the Sharks in this instance. When Matt Noyen controls the Sharks games there is a 70 per cent chance you’ll hear that stupid trumpet playing Roll out the Barrel incessantly so that it gets stuck in your head all the bloody way home. Can someone please ‘deal’ with that trumpet?
Brisbane Broncos
| Ten year winning percentage | Best referee and winning percentage | Worst referee and winning percentage | Best referee and winning percentage (historical) | Worst referee and winning percentage (historical) |
| 58% | Chris Sutton (72.7%) | Matt Cecchin (50%) | Kelvin Jeffes (85.7%) | Tony Archer (45.2%) |
Wouldn’t it be nice if the referee under which your team gets the worst results still saw you win 50 per cent of the time? That’s the story for the Broncos with Matt Cecchin. And contrary to popular belief, it isn’t Gerry Sutton who is the Broncos most favourable ref, it is his little brother Chris. The Broncos have a 56.8 per cent win rate under Gerry. However, Kelvin Jeffes’ 85.7 per cent may never be bettered.
Wests Tigers
| Ten year winning percentage | Best referee and winning percentage | Worst referee and winning percentage | Best referee and winning percentage (historical) | Worst referee and winning percentage (historical) |
| 45.8% | Gerard Sutton (53.8%) | Henry Perenara (33.3%) | Adam Devcich (58.3%) | Tim Mander (27.8%) |
Finally a side that has a case to claim that Henry Perenara is out to get them. The Wests Tigers have won only a third of their games under Perenara. Gerry Sutton is the current referee they do the best under. However, that benefit is marginal at best. Have a look at how the merged club fared under Tim Mander too.
Canberra Raiders
| Ten year winning percentage | Best referee and winning percentage | Worst referee and winning percentage | Best referee and winning percentage (historical) | Worst referee and winning percentage (historical) |
| 45.3% | Matt Noyen (66.7%) | Chris Butler (30%) | Graeme West (66.7%) | Tony Archer (30%) |
Chris Butler is the tallest of the referees. The Canberra Raiders win less than a third of the games he controls. Conversely, they win two-thirds of the games that Matt Noyen controls. Historically Tony Archer is the referee they did the worst under. Graeme West controlled matches during the Raiders heydays so his percentage is unsurprising.
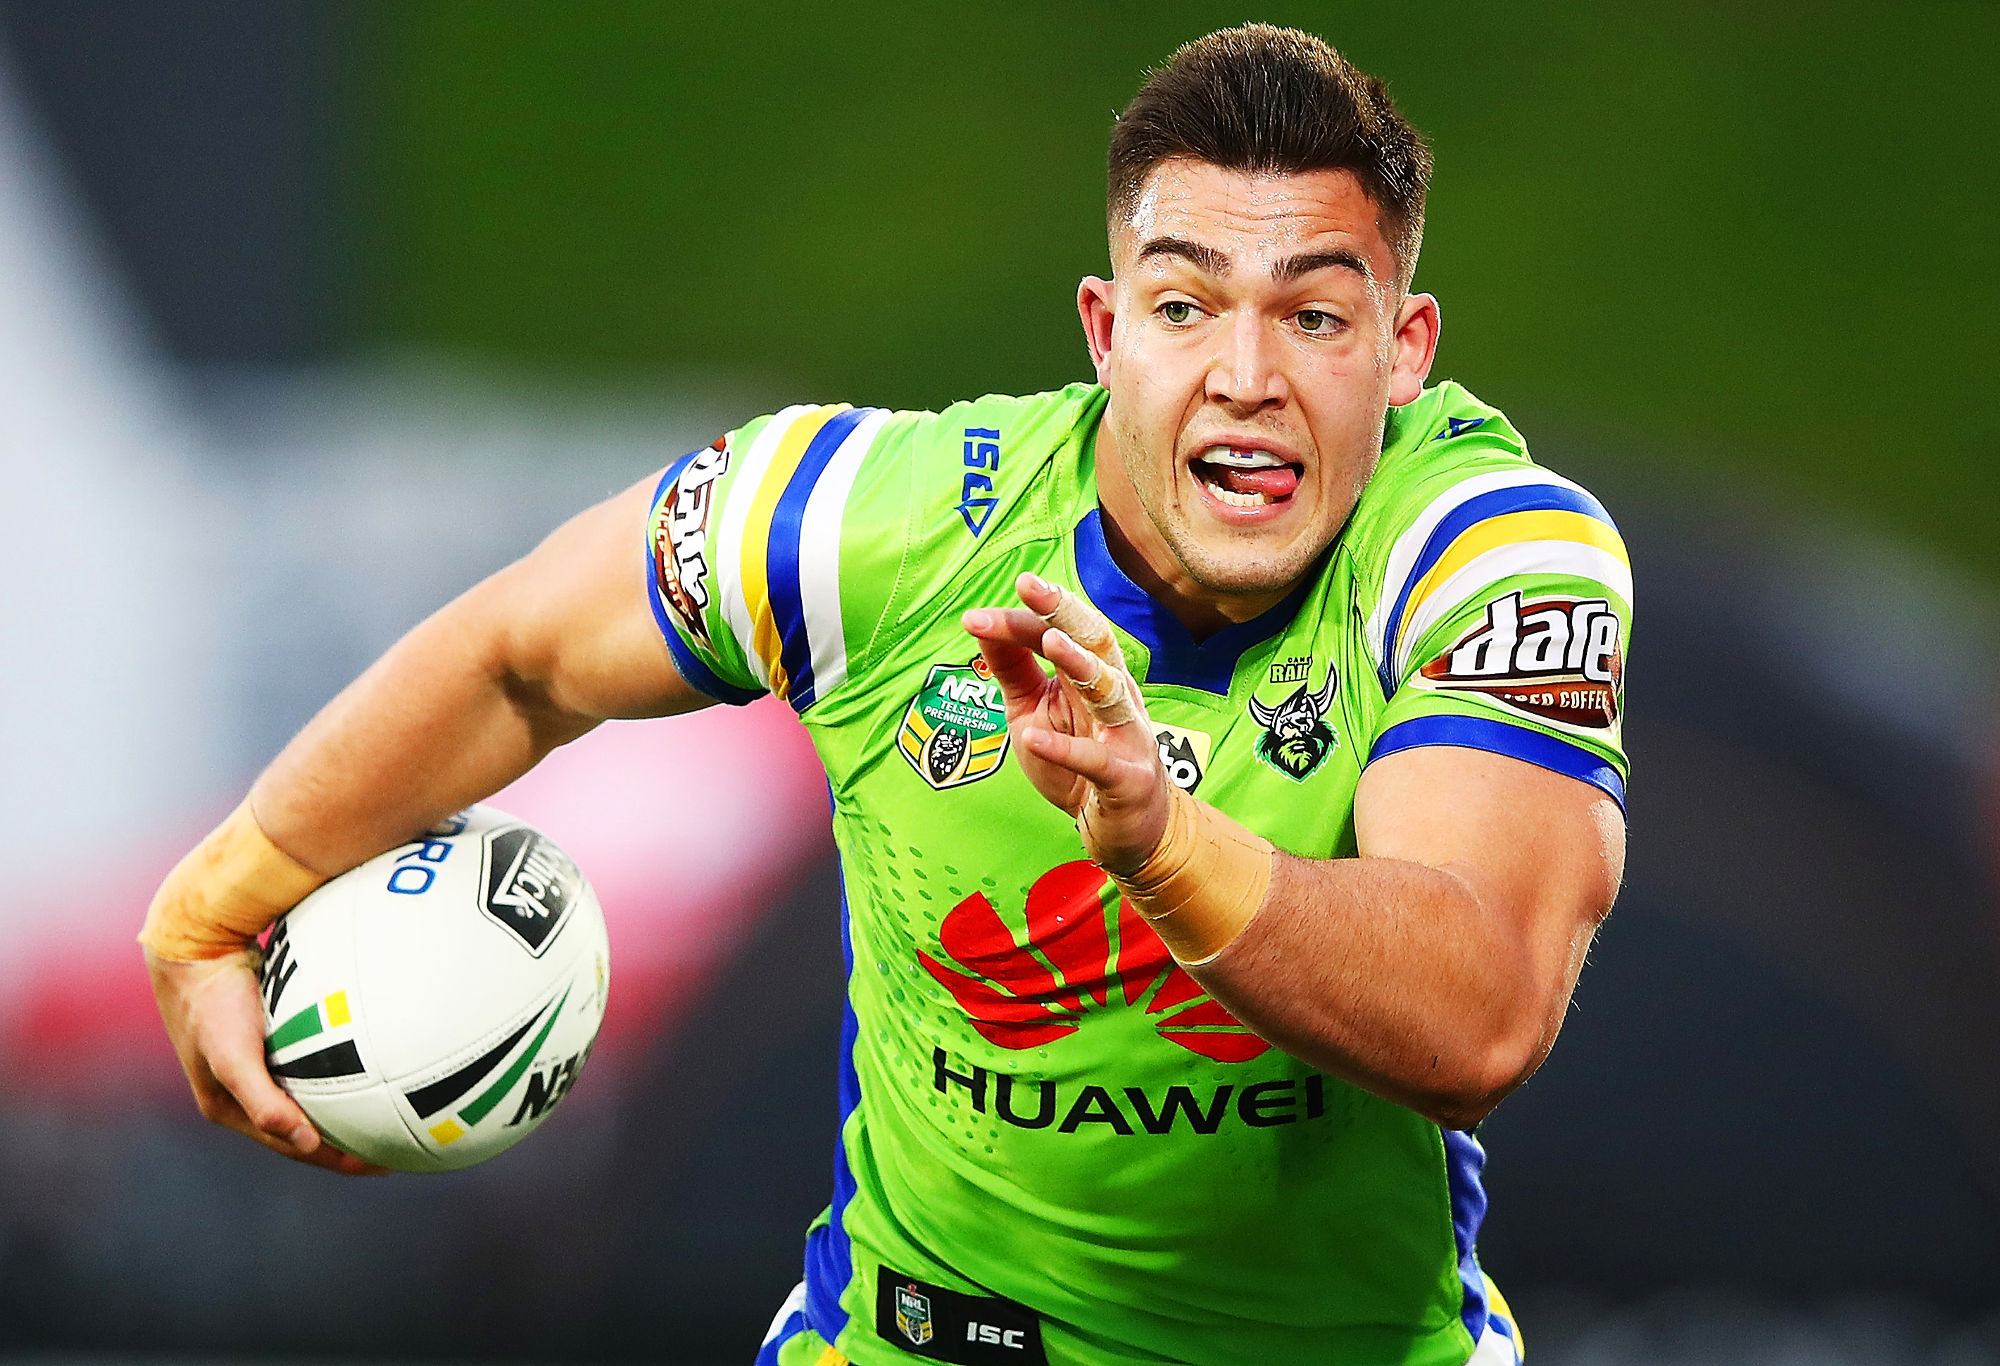
(Hannah Peters/Getty Images)
Newcastle Knights
| Ten year winning percentage | Best referee and winning percentage | Worst referee and winning percentage | Best referee and winning percentage (historical) | Worst referee and winning percentage (historical) |
| 38.6% | Gavin Badger (60%) | Gavin Reynolds (21.4%) | Paul McBlane (72%) | David Munro (11.8%) |
Gee, look at that ten-year winning percentage. It’s the worst of all the clubs by quite a way. However, Gavin Badger has bucked that percentage as they win six out of ten games under him. The Novocastrian faithful would sincerely wish they could get the same sort of results under Funky Reynolds under whom they only win one in five. David Munro finished up at the end of last season and I’m guessing the Knights fans aren’t missing him.
Gold Coast Titans
| Ten year winning percentage | Best referee and winning percentage | Worst referee and winning percentage | Best referee and winning percentage (historical) | Worst referee and winning percentage (historical) |
| 43.5% | Henry Perenara (52.4%) | Gavin Reynolds (36.8%) | Tony Archer (64.7%) | Phil Haines (25%) |
For the third time Perenara – although only marginally – is the official under whom a side gets their best results, the Titans in this instance. On the other end is Reynolds. The Titans have won just over a third of their games under him. Referees supremo Tony Archer is the referee under whom the Titans experienced their best results.
Manly Warringah Sea Eagles
| Ten year winning percentage | Best referee and winning percentage | Worst referee and winning percentage | Best referee and winning percentage (historical) | Worst referee and winning percentage (historical) |
| 56.6% | Gerard Sutton (60%) | Adam Gee (30%) | Graeme West (80%) | Adam Gee (30%) |
Despite their poor season to date, the Sea Eagles over the last decade have a good winning percentage. When Gerry Sutton has controlled their games they have won 60 per cent of the time. While it isn’t as good as how they went under Graeme West back in the day, the Brookvale Boys would vastly prefer it to what has happened under Adam Gee.
North Queensland Cowboys
| Ten year winning percentage | Best referee and winning percentage | Worst referee and winning percentage | Best referee and winning percentage (historical) | Worst referee and winning percentage (historical) |
| 53.1% | Chris Sutton (64.7%) | Grant Atkins (40%) | Chris James (82.4%) | Mark Oaten (30.8%) |
Once more Chris Sutton is on the extreme edge of a side’s results. In this instance the Cowboys win two-thirds of the games he controls. Chris James finished up without warning at the conclusion of last season. However, when he controlled Cowboys games they won four times out of five.
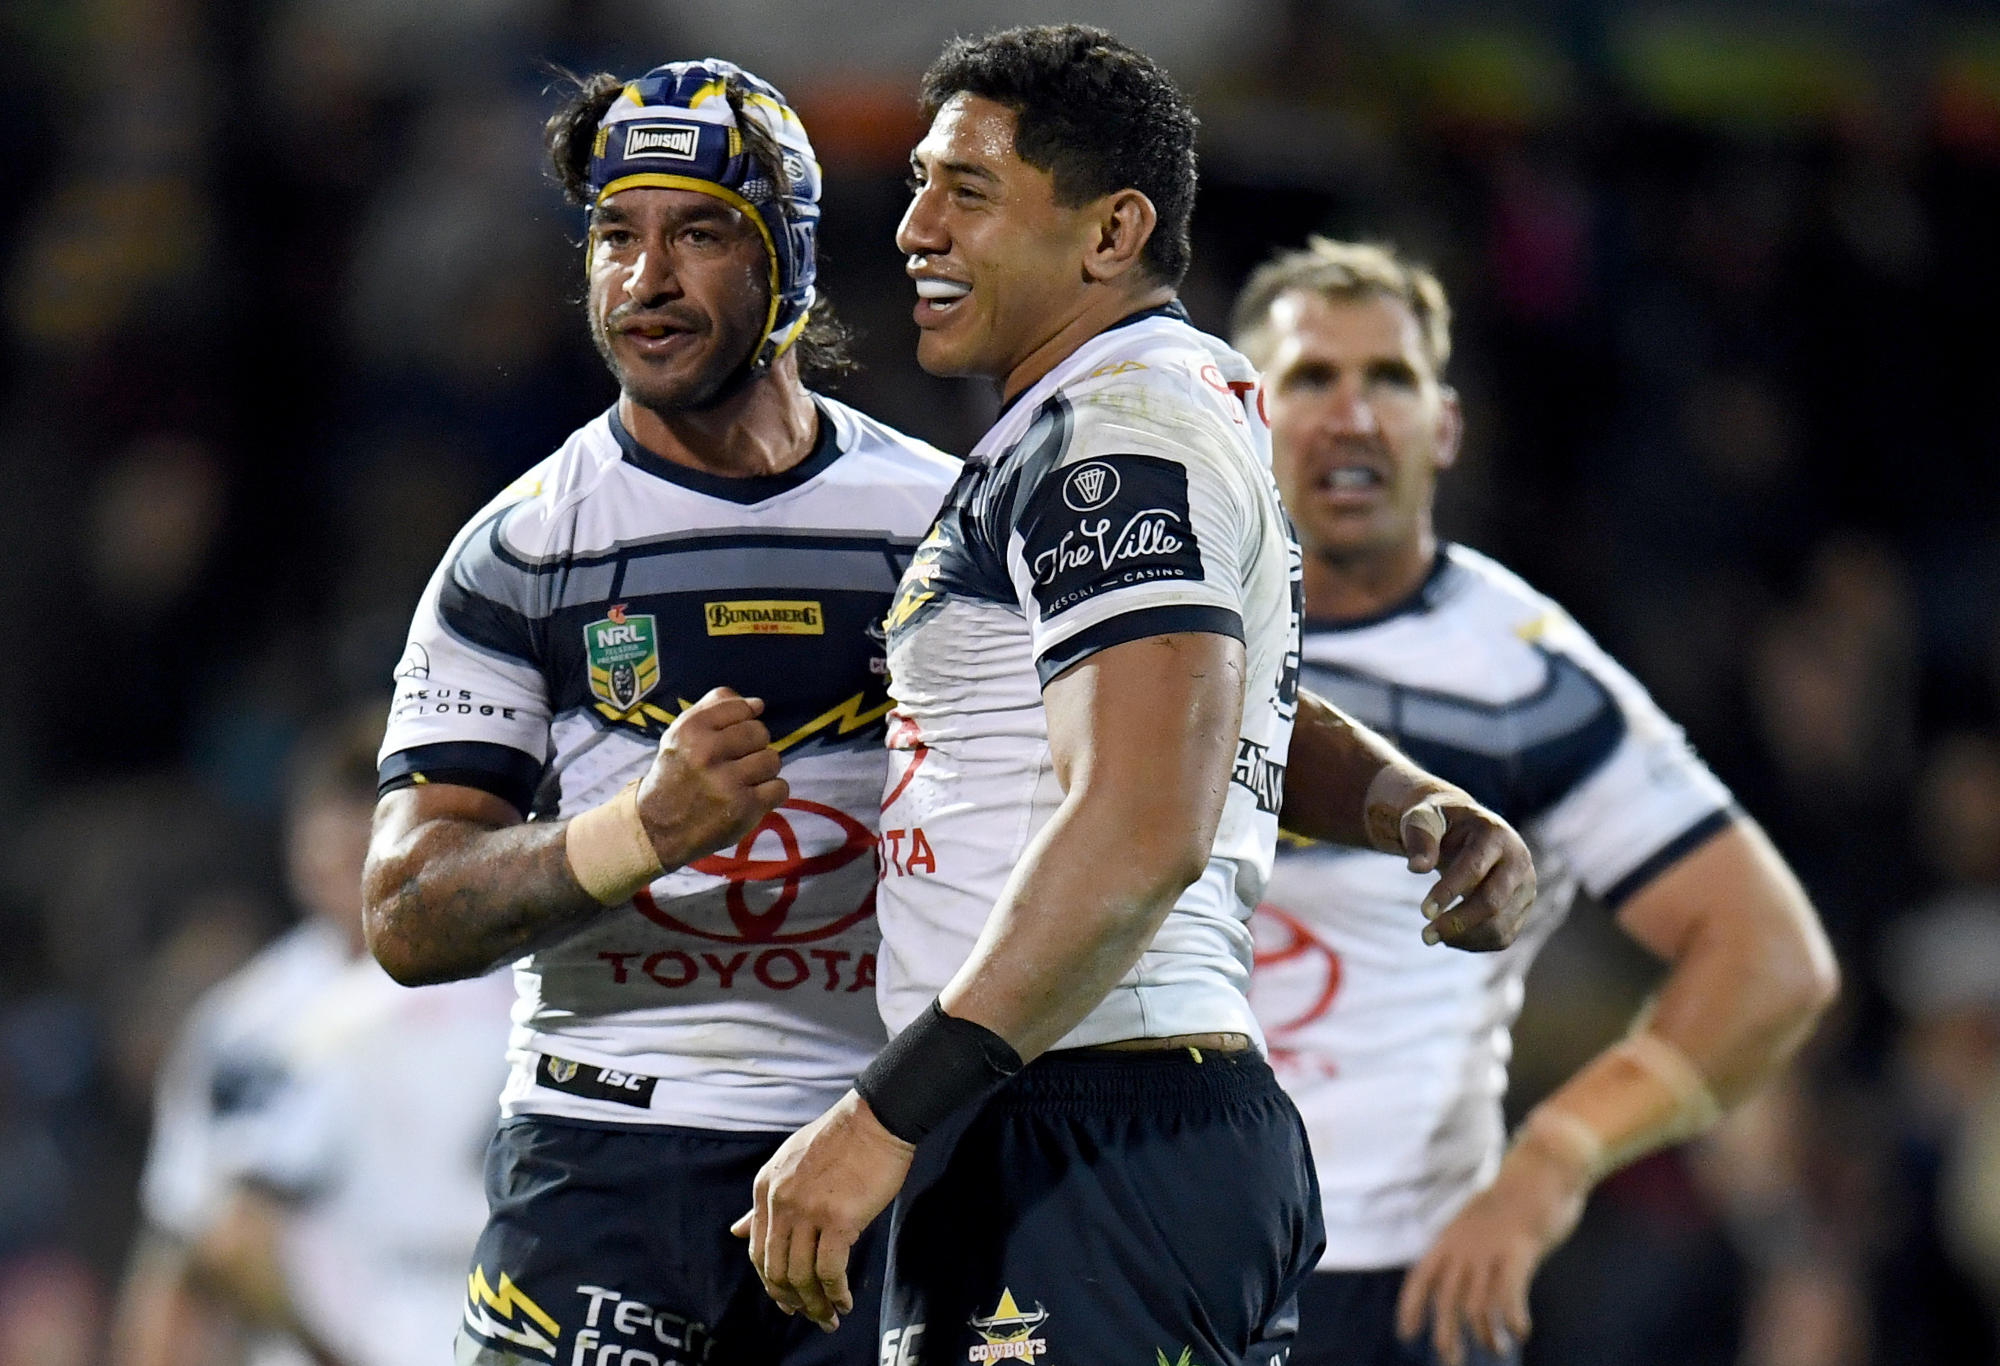
(AAP Image/Dean Lewins)
Canterbury Bankstown Bulldogs
| Ten year winning percentage | Best referee and winning percentage | Worst referee and winning percentage | Best referee and winning percentage (historical) | Worst referee and winning percentage (historical) |
| 54.8% | Ash Klein (67.6%) | Ben Cummins (44.9%) | Barry Barnes (84%) | Steve Lyons (30%) |
The Belmore faithful must love seeing Ash Klein rock up as they win two-thirds of the time he controls their games. However, under Ben Cummins they only have a 45 per cent win rate. Back in the day the Doggies got a lot of wins under Barry Barnes, losing only 16 per cent of the time.
Paramatta Eels
| Ten year winning percentage | Best referee and winning percentage | Worst referee and winning percentage | Best referee and winning percentage (historical) | Worst referee and winning percentage (historical) |
| 40.4% | Adam Gee (60%) | Gerard Sutton (28.6%) | Matt Hewitt (81.8%) | Col Pearce (13.6%) |
Col Pearce’s record of having the Eels lose 86.4 per cent of their games under him is the biggest losing outlier I found. Gerry Sutton controlled a lot of the Eels games in 2011, 2012 and 2013, which helps explain their poor win ratio under him.
[latest_videos_strip category=”league” name=”League”]
As stated above, I am firmly of the belief that none of the referees are biased for or against any sides. These are dedicated professionals who take pride in their impartiality and proficiency. These statistics only demonstrate that every statistical set has outliers, nothing more.
While it could be argued that some referees are responsible for more than their fair share of the outliers, that is probably drawing a long bow too.
So next time you hear someone say that this ref is biased against their side, refer them to the statistics.
Gwen Leaver
Guest
he's hopeless for most teams, the most inconsistent ref in the NRL
Gwen Leaver
Guest
Even when the Storm does the wrong thing they will still get the penalties, that team is so favoured by the refs, I've seen them allow tries from a pass that is metres forward, another team would get pulled up for the same thing, so inconsistent
Gwen Leaver
Guest
If Henry Perenara doesn't hate Parramatta then he's just a terrible ref, because when something is done to us we never get a penalty but the following week another team will have the exact same thing done to them & he will give them a penalty, he needs to be gone for good, absolutely hopeless & we also know when he is the ref we will not win that game
bazza200
Roar Rookie
Remember storm cheated a few yrs those shouldn't count as wins
bazza200
Roar Rookie
End of game stats don't actually tell the full story. The bias actually comes from discretional calls during a game. It also misses the fact of what they let go as in penalise one team for no directional penalties such as offside and holding down of players. In penalty counts high tackles or crushers or chicken wings should be really ignored in penalty analysis.
KnuckleSandwich
Guest
Matt Noyen is almost exclusively a pocket ref. Why include pocket refs?
Craig
Guest
These statistics are completely meaningless without any analysis done.
Chris n
Guest
Thanks tim, Very interesting im a newcastle supporter .A few weeks ago we played penrith and i said the refering in that game was bordering on match fixing it was that one way against us. Guess who the ref was Gaving renyolds thanks for the stats to confirm my suspicions.
Rob
Guest
The games with Checchin as Ref! Stats on the phone, so apologies the missing game (28). From 2012 the Broncos are 1-1 playing the Sharks. Storm are 2 -4 against Sharks. The Cowboys are 0-2. 10 games against those 3 clubs winning 7 out of 10. That’s still significant when you consider the success those clubs during that period. Cowboys are 47% under Checchin overall. The Broncos and Storm win % are all down compared to their overall %during this time I believe. Like I said hard to do stats researching on the phone screen at this time. With regards to the 9-14 NSW victories the Cowboys achieved how many were against top 8 teams at that time?
ken gargett
Guest
congrats on the piece, tim. really interesting stuff. of course, now that you have exposed this, every time a club's least preferred ref is appointed to their games, they will scream bias in the administrators.
Matt
Guest
Video refs would be an interesting one too
3 recalcitrant monkeys
Guest
Adam Voges vs The Don
DiscoDave
Roar Rookie
Spot on Matt H In my experience, 80% of League supporters think the ref is biased against their team, 15% know for certain the ref is biased against their team and 5% are sure there is a conspiracy at the NRL against their team. I also read somewhere that 76% of statistics were just made up and the other 24% were bull$#@t.
a
Guest
I thought Shayne Hayne hates the Cowboys
Rob
Guest
It’s interesting that Tim has named Noy as the Shark’s best Ref at 70%. Noy has done 10 Sharks games total starting in 2013? Checchin has done 24 Sharks games since 2013 and have they have won 17 of those fixtures. That’s 70.83% which is marginally higher but on a much larger sample size. Why Tim?
BA Sports
Roar Guru
The Sharks specifically (since 2012) - by my quick count v Brisbane; a win away and a loss at home v the Cows; the Sharks had two home wins (the Cows stink on the road in general so hardly news worthy) v the Storm; the Sharks have had 3 wins and 2 losses. I fail to see any numbers there that show any bias what so ever..
Stuart McLennan
Expert
Very interesting data Tim. Thanks for putting this together. I like many other Tigers supporters would have pointed to Gavin Badger for our highest percentage of losses. He seems to penalise the hell out of us! Facts dispel this gut feeling and we can point the finger at Henry! Haha. Other interesting stats might be penalty counts according to position on the ladder, most penalising refs and second half penalty turnarounds that provide a balanced count at the end of the game?
BA Sports
Roar Guru
Why since 2012? Because it gave 25 games which is a reasonable sample size and it is fair to say his ability as an official has improved since he started in the early 2000's. Which six clubs? Don't know what you mean -if you are refering to the non Sydney based teams, the Cows have won 9 of the 14 games Chechin as ref'd where the Cowboys have played NSW teams (11 of 16 if you threw in the Gold Coast) . But yeah, lucky charm of the teams south of the boarder...
Rob
Guest
Ok Since 2012 with Checchin the Sharks have won 18 of 27 games 66.66%. The Sharks have played a combined total of 10 games against Storm, Cowboys, Broncos with Checchin in charge during tis time for a 80% win ratio. The Storm are the only successfull team winning 2 of 6 games during this period. Your right on the Cowboys. They have a good record against the Knights, Titans, Broncos, Warriors during this time with Checchin in Charge. They can’t beat the Storm? Crap that record is pathetic under an Ref thou.
RandyM
Guest
68% is incredible for the Storm. I would love to see a comparison of winning % between teams in different codes. I would hazard a guess and say the Storm has the highest winning % of any team in any football code in the country over the last 10 years. Only other teams I would think come close are Sydney FC, Hawthorn or Geelong in the AFL? but i really have no idea.