To win rugby games, some swear by playing error-free footy. Others by having a strong set piece. I have heard Rod Kafer talk of the importance of getting over the advantage line.
I had a look through the team stats for the Super Rugby season to see what areas lined up with how the teams finished on the table i.e. would having the most run metres give you a better chance of finishing near the top of the table?
I used a statistical technique called ‘Spearman’s Rank Correlation Coefficient’. Using the technique, the areas are scored from -1 to 1. With closer to one being a positive correlation, closer to 0 being random, and closer to -1 being a negative correlation.
The results are plotted on a graph to see if the results are significant enough not to be down to chance. Out of all the factors, only the top three showed a significant correlation (at a 95 per cent level).
That means there is a 95 per cent chance that these three factors show a strong correlation with how the teams finished on the table. The other factors did not make the cut off and aren’t statistically significant.
But enough of the nerdy stuff, here are the results:
Significant
0.75 – No. of tries scored
0.69 – Total number of kicks
0.63 – No. of pilfers and ruck and maul penalties won
Not significant
0.55 – Kick metres
0.46 – Line Breaks
0.43 – Run metres
0.33 – Tackle per cent
0.16 – No. of 7+ phases
0.09 – Penalties goals kicked
0.08 – Set piece win per cent
-0.16 – Advantage line success
-0.29 – Handling errors
-0.29 – Penalties Conceded
At first glance the results are puzzling. But if you take a look closer, the results make sense.
Tries scored seems like an obvious one doesn’t it? Four of the top five teams (Crusaders, Brumbies, Hurricanes, and Jaguares) were in the top four of tries scored. The Bulls (the fifth ranked team) deciding to get their points from kicking lots of penalties (they were ranked first in penalty goals kicked).

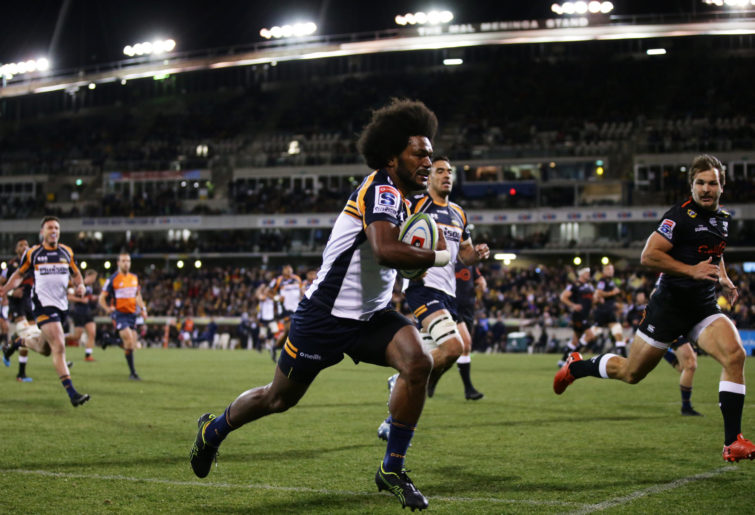
Henry Speight heads in for a try. (Photo by Matt King/Getty Images)
Interestingly, the more teams kicked the better their chances of finishing on top of the table. The Jaguares, Hurricanes, Crusaders and the Bulls put in the most kicks. The key point is that it wasn’t all kicking for distance but short kicks too.
The Crusaders had the lowest average metres per kick which showed that they kicked short to regather often. It makes sense that teams that kick often gain territory and have a more varied style of attack.
With several pilfers and forced ruck and maul penalties it is the same story. The Jaguares, Hurricanes, Bulls and the Crusaders all were in the top four. If you pressure the ruck, you win penalties, slow down opposition ball and get precious opportunities for counterattack.
There have been countless articles on here about the importance of ruck dominance so I won’t harp on anymore.
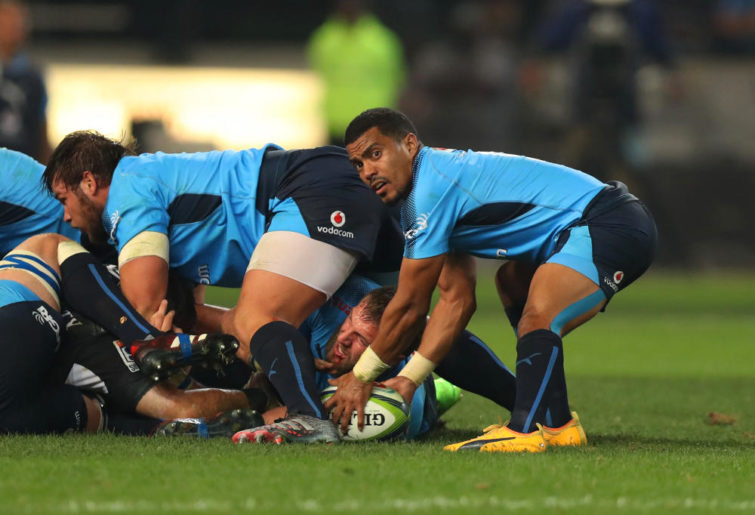
Rudy Paige of the Bulls takes the ball from the ruck. (Photo by Steve Haag/Gallo Images).
One interesting anomaly is the Brumbies. They were the only team in the top five that didn’t kick the ball often (ranked 12th) or win much ball at the ruck (eighth). Yet they scored a lot of tries (ranked second).
I think this all comes down to their brilliant rolling mall. Never have I seen a team so dominant in one aspect of rugby. I’m not sure about the exact figures but at one point late in the season I remember Greg Clarke saying they had scored around 15 tries from the rolling maul and second place was the Highlanders on only 6!
They kicked the least penalties (only four all season) of all teams. They instead kicked to the corner and worked the maul. As the season was so close, if the Brumbies had lost two more games, they would have finished middle of the table. It would be fair to say that the rolling maul might have won them two games for the season. Why haven’t the Wallabies tried to incorporate this?
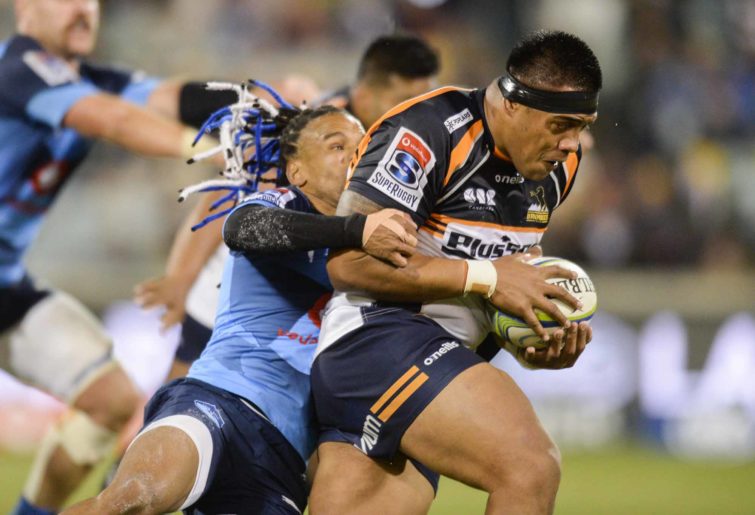
Allan Alaalatoa of the Brumbies is tackled by Rosko Specman of the Bulls. (AAP Image/Rohan Thomson)
Let’s look at the other end of the scale. I will use the Blues as an example. They have a lot of talent in their team; Ma’a Nonu, Rieko and Akira Ioane, Sonny Bill Williams, Patrick Tuipulotu and Melani Nanai. However, they finished 13th overall.
I felt from the matches I watched they seemed to play quite well and were a bit unlucky to finish that low. If you look at some of their overall numbers they were ranked:
third in metres gained
fourth in line breaks
first for getting over the advantage line
first in number of 7+ phases
first in tackle completion per cent
This seems like a great team. They hold the ball, make metres and breaks, and make their tackles. Yet with all those ‘good’ stats and all that talent they finished only 12th in overall tries scored. Here is where else they fell down:
15th Pilfers/Ruck and Maul Penalties won
15th Metres gained from kicks
15th Total number of kicks
Yep, they had the worst kicking game and defensive ruck game. As a result, they had few opportunities for counterattack from ruck turnovers (the most efficient situation to score tries). Once the opposition got the ball instead of forcing turnovers they just tackled and tackled and were reliant on a mistake to get it back.

Harry Plummer of the Blues (Photo by Anthony Au-Yeung/Getty Images)
They also rarely kicked for territory. Hence, whenever they made all those line breaks they were most likely far from the try line and the line breaks were rarely converted into tries. They also liked to hold onto the ball and did not put in attacking kicks so their attack was more predictable.
Sadly, it looks like the Wallabies have a very similar game plan to the Blues:
1. Possession orientated
2. Large emphasis on getting over the advantage line
3. Few kicks (even less attacking kicks)
4. Little attempts at rucks to force turnovers
Over the course of a season the Blues had some great games but a possession strategy relies on almost perfect execution (just like the Wallabies did in Perth). Unfortunately, this strategy does not provide results in the long run because no one team can sustain that level week in, week out (especially when it is bucketing down rain).
The 2019 Super Rugby season has shown teams that score tries, kick often (both attacking and for territory) and are aggressive at the ruck have had the best chance of finishing top of the table.
Bentnuc
Roar Pro
Cheers chucked :rugby:
Chucked
Guest
Bit late to comment, but really good article
Ryan
Roar Rookie
OJ - every live game I’ve been to with Hooper playing, he’s often loitering on the wing. A 7’s primary role is to be in the rucks and mauls, ask the GOAT Iceman Michael Jones.
Ryan
Roar Rookie
Harsh
Smiggle Jiggle
Roar Guru
"If the pigs don't want to put the heads in the trough, the piglets won't get the milk" - Smiggle 2019
ethan
Guest
I wonder if its a case of NZ teams playing winning rugby according to statistically proven tactics, or if they are statistically proven tactics because thats the way NZ teams play, who are most successful. To that extent, it would be fascinating to see which stats prove most important in Northern Hemisphere rugby. Perofeta and Barrett has enormous attacking potential. Be interesting to see who plays 10 and 15.
Bobby
Roar Rookie
AND Jack Gibson - you just have to score more points than the other team
Bentnuc
Roar Pro
Cheers bobby :rugby:
Malotru
Roar Rookie
Tokyo in October, cool 18c average, 150mm of rain and 4 hours of sunshine a day. Not really hot and sticky (holiday-weather.com).
pm
Roar Rookie
Definitely. I too look forward to more of your writing Bentnuc
Rand Curtis
Roar Rookie
Give it a rest Chivas. We've got it already.
SandBox
Roar Guru
The only thing that stands out as a possible exception to the stats is the Campese expression “you can’t learn running rugby in the last 10min of a game” We’ve done the ball in hand way long enough now. My wish for this RWC is we develop more of a strategy that includes these stats, than a Cheika one. A backup plan wouldn’t hurt either As the kid from the cult movie ‘Shogun Assasin’ would say...“a wish is only a wish”
Chivas
Roar Rookie
And please make sure there is a next time. You have picked a large and interesting area inmho to drill into.
Chivas
Roar Rookie
Also… of course you are biased, you are a rugby fan are you not :happy: . My bias is everything Waikato, North Island and New Zealand in that order :happy:
Chivas
Roar Rookie
Sorry, about the Hurricanes, for some reason I missed you mentioning them on my first read. For some unknown reason I seem to have an uncanny ability at times to completely miss what is in black and white :happy: But that aside, I am definitely not suggesting you came at this with any particular bias, rather you have interpreted the results but your interpretation is only useful as far as the data set you are looking at. In order for your analysis to have real meaning as a potential tool to apply to rugby to gain insight into even next years SR or other competitions, you would need to develop a hypothesis and then prove it. To do that you would need to identify your samples and variables and establish why they are important and either serve as a reasonable proxy for ones you have not included other than them simply not being available. By noting the unavailability of data, then you are at least acknowledging potential short comings in the analysis and provide you with a basis to establish their importance in respect of your outcomes or otherwise. You have at best established a hypothesis as a result f the work you have put in to date, but I would be fascinated to know how this applies over different periods and different competitions. I commented on this article, because I appreciate the work that goes into doing the work and then writing it up and am genuinely interested in such analysis. For example on kicking alone, this can be broken into attacking kicks, defensive kick and shots at goal. Take the Force for example when they were playing, they seemed to kick an awful lot, competed well at the ruck and maul but really struggled to win many games. The kicking game has definitely evolved over the past 30 plus years to the point where as Harry says you need at least your 9, 10 and 15 able to kick well. Look at the Grant Fox era, lots of kicking and effective 10 man rugby to today’s game which is a lot more diverse. I assume the data is not easy to get hold of, because it would be really insightful to get a read not just on what is effective on last years SR, but the upcoming RWC and other competitions. It would make it interesting to use to identify teams most likely to succeed. For example, I think the Bok will do well in the upcoming RWC and where I worry they will have an advantage over the ABs is the lineout. I think the ABs are better at utilising space, especially when you include Dane Coles and Beaudy Barrett into the equation. Can a super boot like Pollard mitigate this will be interesting. As for the mauls, Australia has proven not only capable of dominating this aspect of the game but effectively sacking opposition mauls through their tall timber. However in saying that the ABs were able to completely kill that threat off in Eden park and in fact dominated this aspect of the game. Whether the ABs can do it again and against various opposition still remains a big question for me. But please don’t take my comments as anything but what I hope is constructive criticism, because as I stated I would be very interested in seeing this done over a broader set of data and see how effective a model (which requires applying weighting’s to the variables) could be built and seeing how effectively it can be used to determine likely outcomes in other competitions both past and forecasting results into the future. No doubt as the game evolves I expect the variables may change but I suspect not drastic changes unless there are drastic changes to the rules. Be also interesting to see what effect rule changes and new strategies have had on the model. But a very good start... hopefully if data is available we may get to see model which can be used to other sample sets. And thanks for the time and effort you put into this.
Bentnuc
Roar Pro
Cheers Ethan :happy: yeh it's all blacks rugby 101 isn't it. I found it interesting that the Jaguares and Bulls play a similar style when you look at it too. The Blues as a great case. I was thinking the same as you as why they have struggled so much compared to the other kiwi teams. At least they are getting Barrett next year which will help their kicking game. But brilliant as he is he is just one man and cant fix their lack of ruck skills!
Bentnuc
Roar Pro
Thanks wingman :stoked:
Bentnuc
Roar Pro
Cheers Rand. Had a look there. Just pilfered on their own was 0.66. So slightly more correlated than combined. I just added them to show ruck dominance as a whole. You are right, it's good to look at this aspect because of the counterattack. Thanks again :stoked:
Bentnuc
Roar Pro
Cheers Tony :happy: it would be good to look at. I would love to see how many tries scored off counter attack or the set piece etc. The data I got was only off the fox sports website. Not sure where you could get more in depth info???
Bentnuc
Roar Pro
True commando would be interesting. Nick is brilliant. Every article he does just opens your eyes more into the game.