In recent weeks, The Roar ran a great series on the best-ever Sheffield Shield dream teams by Matth, based on performances in the Shield itself.
This article extends that theme to the global level, but takes a different angle by asking the question: which first-class provinces states from all around the world have bred or nurtured the best cricketers, based on their records in Tests?
Here we define players’ provinces on a State of Origin basis – i.e., by the province they represented first, rather than the one they ended up playing for most often. In the vast majority of cases, this turns out to be the place they grew up and learned their cricket.
Using this criterion Don Bradman, Adam Gilchrist and Allan Border come from New South Wales; Simon Katich and Stuart MacGill are Sandgropers; English Test players Kevin Pietersen and Robin Smith count towards KwaZulu Natal, South Africa, not Hampshire; Clarrie Grimmett is from Wellington, New Zealand, not South Australia.
We use players’ averages as a uniform statistical measure in order to compare the collective historical strengths of the various provinces.
Firstly, we find the best batsmen, wicket keepers and bowlers with the best averages from each province who have played Test cricket. We add together the total batting averages of the XI to give a projected average innings score by the fantasy team.
From the batting total we deduct the average opposition batting total (excluding extras) by extrapolating from the combined averages of the frontline bowlers.
The method used and other criteria for selection are set out at the end of the article.* The bigger this ‘average differential’ – average score for minus average score against – the better the dream team.
The period covered starts from immediately after the First World War, i.e. 1920, in order to use reasonably comparable statistics. The magnitude of total scores and averages in Tests has stayed pretty similar over the last hundred years, whereas prior to WWI, they were much lower.
Moreover, only three countries played Tests before 1914.
But we have included the few pre-1914 batsmen, such as Clem Hill of South Australia and Stanley Jackson of Yorkshire, whose numbers were good enough to make their all-time provincial team.
Career averages clearly don’t tell the full story when comparing individuals. In particular, they may not reflect what how they played in their peak years, or other measures like how they performed in the clutch, against the best teams on all tracks around the world.
Raw averages also don’t capture other things, e.g. a wicketkeeper’s glovework, or the impact that a batting allrounder might have on a team. Nevertheless, averages seem as good a measure as any to rate the collective strength of the best all-time players from a province.
The top five provinces worldwide came out as follows. Batting or bowling averages (rounded) are shown for each player depending on his specialty, with both averages shown for all-rounders.
1. New South Wales
Batsmen: Arthur Morris (46), Bob Simpson (47), Don Bradman (100), Steve Smith (64), Allan Border (51), Steve Waugh (51). Keeper: Adam Gilchrist (47)
Bowlers: Alan Davidson (21), Pat Cummins (21), Bill O’Reilly (23), Glenn McGrath (22).
Average Differential: 471-219 = 252
The NSW dream team, according to this method, would run up a hypothetical average lead of 252 in each innings, playing against a full range of the teams its members encountered – a winning margin over 500 per match!
Bradman’s stratospheric average contributes over half of their margin above the next best province.
But few provinces can match the rest of NSW’s top order, led by Steve Smith, while its bowlers own three of the top eight averages among all quicks who have played at least twenty Tests since 1920 (Glenn McGrath, Pat Cummins and Alan Davidson) plus one of the three most miserly spinners (Bill O’Reilly).

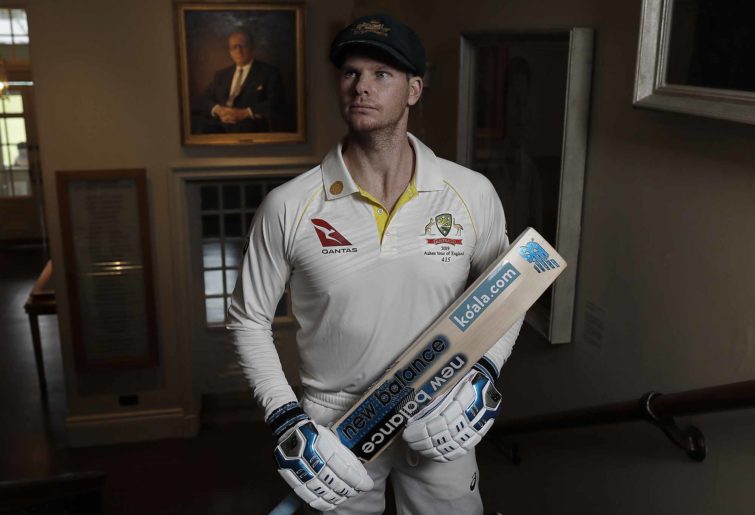
A couple of NSW old boys (Photo by Ryan Pierse/Getty Images)
In fact, the strength in depth of NSW is shown by the fact that a NSW Second XI would rank seventh on this table (see below) with greats such as Lindwall, Benaud and McCabe, and would have a better average differential than the best-ever national teams of New Zealand or Sri Lanka.
A NSW Third XI (ranked 22nd) rates better on paper than any of the Indian and Sri Lankan provincial dream sides and most English, Pakistani and New Zealand ones.
And there is no question about origins – every member of the top two NSW teams was born and bred in the state, roughly half in Sydney and half in country areas, though all came through the Sydney grade competition at some point.
2. KwaZulu Natal
Batsmen: Barry Richards (60?), Jackie McGlew (42), Hashim Amla (47), Dudley Nourse (54), Kevin Pietersen (47), Robin Smith (44), Keeper: Billy Wade (28)
Bowlers: Shaun Pollock (23 – 32 bat), Trevor Goddard (26 – 35 bat), Mike Procter (21?), Hugh Tayfield (26).
Average Difference: 431-241 = 191
I should confess at the outset to a little sleight-of-hand here in including two Natal players, Barry Richards and Mike Procter, whose Test careers ended prematurely with South Africa’s isolation from 1970. It would seem unfair to Natal’s credentials as a breeding ground to exclude them for playing so few Tests, but also unsound to use the extraordinary figures they put up in that brief period (Richards’s batting average of 74 in four Tests, Procter’s bowling average of 15 in seven, all against Australia).
On the basis of their subsequent first class careers and performances in World Series Cricket in 1977-79 (where Richards led all batsmen) it is hard not to envisage them ending up near the top of the all-time averages if they had played on.
So we have given Richards a proxy batting average of 60 and Procter a bowling figure of 21. But even if we omitted Richards and Procter, or ascribed less generous figures to them, Natal would have stayed in second place.
A possible explanation for Natal’s prominence on the list is that for a long time South African cricket was dominated by white English speakers rather than Afrikaners, and Natal and Durban was the most British part of the country.
It has been less dominant in producing top Test cricketers since 1994, but still accounts for the likes of Shaun Pollock, Hashim Amla and Pietersen.
Other South African provinces figure well in the rankings, with Gauteng/Transvaal in 10th place, Northerns and its predecessors 12th, and Western Cape/Western Province 14th.

Kevin Pietersen. (AP Photo/Theron Kirkman, file)
3. Barbados
Batsmen: Gordon Greenidge (45), Desmond Haynes (42), Everton Weekes (59), Seymour Nurse (49), Gary Sobers (58 – bowl 34), Frank Worrell (49) Keeper: Clyde Walcott (57)
Bowlers: Malcolm Marshall (21) Wes Hall (26) Joel Garner (21) Kemar Roach (27).
Ave Difference: 423-262 = 165
Barbados has been the outstanding province (and nation) worldwide relative to population size. Numbering only some 300,000 people today, Barbados is a lot smaller than the other main Caribbean cricketing nations – Jamaica, Trinidad and Guyana.
Yet it would arguably provide at least half the all time West-Indian team in the guise of Sobers, Weekes, Walcott, Marshall, Garner and possibly Worrell or Greenidge.
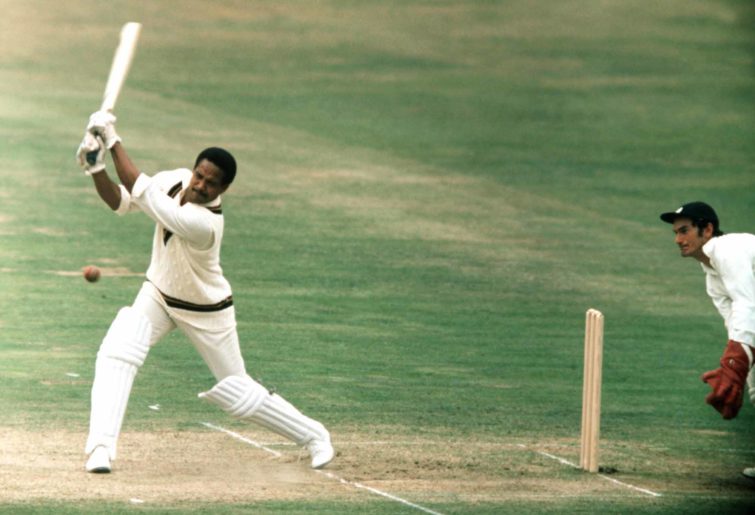
Gary Sobers (l) batting (Photo by S&G/PA Images via Getty Images)
Barbados ranks way ahead of the next best Caribbean province – Jamaica at 17th.
Equally striking is that nearly all the top Barbados players emerged during a thirty year period from the late ‘40s to the late ‘70s. The story behind that would require another article, and author!
4. Yorkshire
Batsmen: Geoff Boycott (48), Herbert Sutcliffe (61), Len Hutton (57), Joe Root (48), Maurice Leyland (46), Stanley Jackson (49) Keeper: Jonny Bairstow (35)
Bowlers: Johnny Wardle (20), Fred Trueman (22), Darren Gough (28), Bill Bowes (22).
Average Difference: 395-231 = 164
Yorkshire has produced some of the greatest England players, plus a couple who had fantastic averages without being so well known – notably Bowes and Wardle, both of whom had relatively short careers.
Left-armer Johnny Wardle has the best average of all Test spinners since 1920 appearing in a minimum 20 Tests, but he only played four Tests against Australia in his span from 1948-57: he was never a certain selection when competing with the likes of Jim Laker and Tony Lock for an English spin spot.
Historically Yorkshire was the county in English cricket that put the greatest weight on local origin: you had to be born in Yorkshire to play for the county until 1992, when the rule was relaxed to select Michael Vaughan, who had moved there when only six.
Yorkshire has also amassed by far the most County Championship titles.
5. Victoria
Bats: Bill Lawry (47), Bill Ponsford (48), Neil Harvey (48), Lindsay Hassett (47), Bob Cowper (47) Jack Ryder (52). Keeper: Jack Blackham (16)
Bowlers: Keith Miller (23. – bat 37), Shane Warne (25), Damien Fleming (27), Bill Johnston (24).
Average Difference: 141
It is not so surprising that a second Australian state makes the top five given that Australia is the only country with a positive win-loss record against all other Test nations, each by a decent margin.
Victoria has some great players in this list, including Ponsford, Miller and Warne, but didn’t have as many batsmen averaging in the 50s as NSW, and the bowling averages were a couple of notches higher than their NSW counterparts.
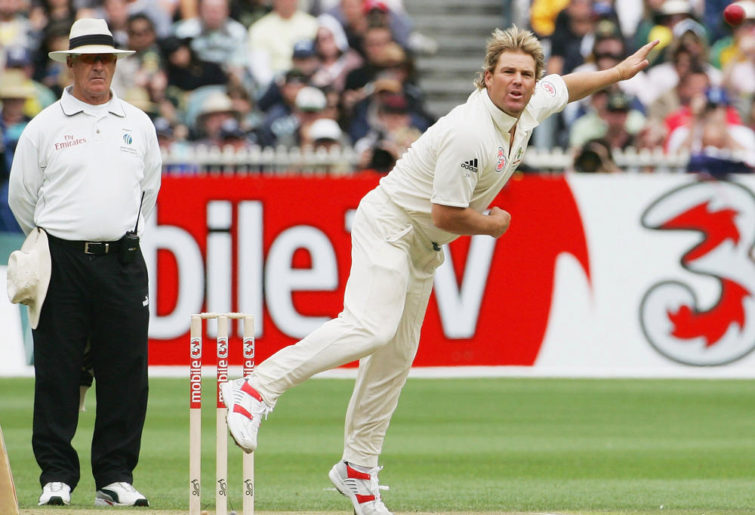
Shane Warne, the king of spin (Hamish Blair/Getty Images)
The Victorian second XI is also very handy, with the likes of Bill Woodfull, Dean Jones and Merv Hughes. It ranks 14th, ahead of the best-ever sides from Western Province (SA), Jamaica or Middlesex.
There is a rough correlation overall between the population size of states in Australia and the quality of the best cricketers they have produced, except for Queensland – our third biggest state – which at 25th ranks well behind Western Australia (ninth) and South Australia (13th).
Best of the rest: 6. Surrey (139) 7. NSW 2 (136) 8. Lahore (107) 9. Western Australia (102) 10. Gauteng/Transvaal (90)
The line-ups of the above fifth to tenth placed dream teams are shown below, followed by the teams placed 11-20th.
Surrey at sixth is very close on the heels of Victoria. It is a little tricky judging the English counties other than Yorkshire in the same way as first class provinces elsewhere.
There are eighteen cricketing counties, a lot more provinces than in Australia, South Africa, the West Indies or New Zealand – although England has had a lot bigger population base to draw on.
Those Championship counties account for less than half the more than forty “historic” counties in England and Wales and thus quite a few players in the main county teams originate from the other “Minor” Counties.
This is particularly true of the counties covering parts of Greater London- Surrey, Middlesex, Essex and Kent – which have acted as a magnet for players in Southern England – a bit like Sydney for country NSW.
In the case of Surrey, two of its greatest batsmen came from Minor Counties – Jack Hobbs, from Cambridge and Ken Barrington, who grew up in Reading, Berkshire, next door to Surrey.
But most of the best Surrey players were local products, and the same was true of the next best English counties, Lancashire and Middlesex.
The top four English counties were also the biggest in terms of population, although not in the same order (Lancashire shading Yorkshire and Surrey).
Lahore at no.8 is easily the best ranked Asian province, with greats like Imran Khan and Wasim Akram.
In rating Pakistan teams we’ve made some assumptions: their first class competition has changed a lot over the years, sometimes featuring two or more teams from both Lahore and Karachi (with names like Blues, Whites and Greens) and non-geographical teams like Railways or National Bank.
The main assumption here has been to treat all players who started with a Lahore or Karachi team as coming from that city/province.
Mumbai is the next best South Asian province, coming in at 23, followed by Karnataka (Bangalore’s state) at 24 and Karachi at 26th.
Mumbai boasts Tendulkar, Gavaskar and Rohit Sharma, but no bowlers averaging under 30, which blows out the average opposition score.
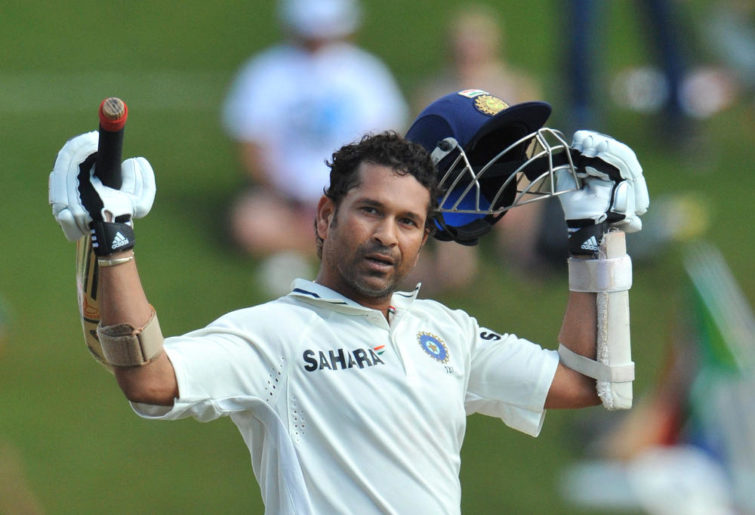
Sachin Tendulkar. (Photo by Duif du Toit / Gallo Images/Getty Images)
India is at something of a disadvantage in this exercise, having a total of 37 first class teams, mostly representing the Indian states.
While India has a big population, like Pakistan and Sri Lanka it came into Test cricket later than others, and it was later still that it had the resources and depth to produce significant numbers of elite Test players.
In fact, Lahore, Mumbai, Karnataka (Bangalore’s state) and Karachi are the only South Asian teams to break even – that is, their best ever batting line-up would average as much as or better than the projected opposition total projected from their bowling averages.
As with Mumbai, a dearth of leading Test bowlers is the Achilles heel for most of these teams. The top Sri Lankan first class team here is Nondescripts, with Kumar Sangakkara, and Aravinda da Silva.
The top Kiwi province is Canterbury at 16th, powered by Richard Hadlee’s bowling, with Auckland and Wellington the only others to “break even”.
Five West Indian teams broke even: Barbados, Jamaica, Guyana and Trinidad made it to the top 20, and the Leeward Islands (Viv Richards, Curley Ambrose et al) came in at 26th – not bad for a population under 300,000, if not quite at Barbados’s stratospheric level in punching above its weight.
…
This analysis doesn’t pretend to any ironclad proof of who is the best or better, but hopefully it sheds some light on which provinces have been the most fertile breeding grounds of elite Test players.
Another angle could have been to ignore the criteria used here, and just look at the sheer number of players from each province who achieved a certain average or other figure, rather than specifying a “dream team” makeup of batsmen, bowlers and keepers.
My gut feeling is that many of the same teams would feature near the top, although some Indian states might be higher and Barbados would rank lower as its depth drops away sharply after the dream team listed above.
One alternative to applying averages would have been to use the official ICC player rating numbers. The latter assess the top sustained performance of players in their peak years, and have been calculated retrospectively back to 1877.
However, they only capture a peak few years and undersell a player’s output over a longer career. Even so, doing a quick run through using the ICC ratings, I ended up with a similar ranking at the top: NSW well in front, followed by Barbados, Natal, Surrey, Yorkshire and Victoria.
Places 6-10
6. Surrey: Jack Hobbs, Douglas Jardine, Ken Barrington, Peter May, Graham Thorpe, John Edrich, Alec Stewart (wk), Alec Bedser, Jim Laker, Bob Willis, Geoff Arnold. Diff: 139
7. New South Wales 2: David Warner, Herbie Collins, Michael Clarke, Stan McCabe, Norm O’Neill, Doug Walters, Brad Haddin (wk), Richie Benaud, Ray Lindwall, Josh Hazlewood, Stuart Clark. Difference: 136
8. Lahore: Majid Khan, Wasim Raja, Azhar Ali, Saleem Malik, Ahmed Shahzad, Saeed Ahmed, Imran Khan, Kamran Akmal (wk), Wasim Akram, Abdul Qadir, Fazal Mahmood. Diff: 107
9. Western Australia: Justin Langer, Chris Rogers, Simon Katich, Mike Hussey, Damien Martyn, Adam Voges, Rod Marsh (wk), Dennis Lillee, Terry Alderman, Stuart MacGill, Bruce Reid. Diff: 92
10. Gauteng/Transvaal: Graeme Smith, Eric Rowan, Eddie Barlow, Bruce Mitchell, Aubrey Faulkner, Brian McMillan, Quentin de Kock (wk), Andrew Hall, Cyril Vincent, Kagiso Rabada, Neil Adcock. Diff: 90
Places 11-20
11. Lancashire (Diff: 89) 12. Northerns/Northern Transvaal (77) 13. South Australia (76)
14. Victoria 2 (74) 15. Western/Cape Province (73) 16. Canterbury, New Zealand (72)
17. Jamaica (72) 18. Middlesex (66) 19. Guyana (60) 20. Trinidad (58).
*Method and Criteria
The average differential = the difference between the hypothetical average innings score when batting, excluding Extras, and the average runs scored by opponents in reply, excluding Extras.
It is calculated as follows:= Sum of the batting averages of all eleven players in each dream team.
= Sum of the bowling averages of the four (or five) front line bowlers
= B divided by 4 [if four bowlers, or by 5 if five) = ave. runs per wicket in each innings
= C x 10 = ave opposition runs conceded by bowlers [e.g. if each bowler’s average is 25, the average total conceded per innings is 250.
Average differential = A – D.Eligibility: A minimum of twenty Tests was used for eligibility, or fifteen for teams other than Australia and England prior to 1970 given the relative infrequency of Test series. If there weren’t enough players from the province fulfilling those criteria, then players with fewer Tests were used.
In identifying the six best batsmen from each province, we included the two best opening batsmen, unless they were none who managed a respectable average, defined as over 35.
The bowlers comprise the three pacemen with the lowest averages and one spinner, or two spinners for South Asian teams if their averages are better.
If one of the top six batsmen qualifies as the only spinner (eg Garfield Sobers for Barbados) or one of the best four bowlers, then the averages of five bowlers are used.
JGK
Roar Guru
Only just saw this article. What a cracker. The Barbados phenomenon is one of the great outliers in world sport I reckon. Sobers and likely Marshall make an All Time Test XI - probably only NSW (with 25 times the population) would match that. That said, I wonder if the Barbados team you have is even strong if you include Hunte rather than Haynes?
Chris Kettlewell
Roar Guru
Except, with Tendulkar's 15,921 runs the most in tests, and Murali's 800 wickets the most. Having about 20 times makes them reasonably equivalent. If it was 30 times, then that would suggest a batsman would have to score 24,000 test runs to be relatively equivalent to Murali's 800 wickets. Hence 20x I think probably balances it out a bit more.
Chris Kettlewell
Roar Guru
Birth place isn't necessarily a better indicator. If someone was born in one place and moved to somewhere else while still a small child, I wouldn't call the place of birth the "cricket nursery" for them either. So you either go for something simple like "team of first class debut" or you do in depth analysis of the history of every test player ever to discover where they spent most of their formative cricketing years, which isn't viable for anyone!
JamesH
Roar Guru
Yeah Coxy always had a reputation of being very approachable. I was using a threadbare old set of batting gloves when he first met me and he just shook his head when he saw them and handed be one of his spare pairs! Pretty sure I still have them tucked away somewhere.
qwetzen
Roar Rookie
"Also worth mentioning that Lyon and Haddin much of their youth in NSW towns.". Idly curious... Do you know where the Haddins relocated from to live in unlovely Queanbeyan?
matth
Roar Guru
Thanks Jon, I wouldn’t change anything about the keepers. More that the provinces who can boast a top batting keeper can move up the rankings. The MacGill example is not about an error or anything, more that Australia’s variety of pitches gives their states an advantage. It’s a good discussion
Jon Richardson
Roar Pro
Hi Qwetzen. I used Cricket Archive which lists players’ first class and other representative games. They show 7 FC games for Vic by Grimmett 1919-24, including the two Shield games you mentioned (others were against visiting MCC, Tasmania, et al). Hard to believe he had such trouble breaking into a Shield side in his early 30s! No Lyon, Bevan and Haddin (another ACT rep) get counted towards the first FC teams they played for. Haddin goes into NSW 2 thanks to his batting average. Lyon would be in SA 2 (behind Ashley Mallett). Bevan wouldn’t be in the top 6 or 7 NSW teams on the basis of his batting, but his bowling average would have put him in the second team if we hadn’t used the 20 match eligibility criterion (perhaps a good example as to why). As mentioned elsewhere, the idea was to get a consistent criterion for an origin rule that would shed some light on collective strength. In the overwhelming majority of cases, the state a player represented first was the one where spent most time growing up. (Also worth mentioning that Lyon and Haddin much of their youth in NSW towns.)
Jon Richardson
Roar Pro
McGill defines as WA under the state of origin rule used here. Mallett for SA as he made his debut there, although he had been selected as 12th man for WA the year before. As mentioned at the end of the article the idea was to have a consistent criterion to measure collective strength rather than claim to pick the best team from each state. It would take a lot longer to dig into the past of everyone around the world to subjectively decide where they were “really” from, although I did have a good idea for Australian teams - in the vast majority of cases (over 90%) players first represented the state where they grew up.
Jon Richardson
Roar Pro
Actually Grimmett belongs to Wellington on this exercise because they are treated as a first class province going back to 1905. Surely better than counting towards the Vics? But Mallett is the SA spinner as his first class debut is counted for the, and his average is better than Lyon’s, who also counts as SA.
Jon Richardson
Roar Pro
Sounds promising. My impression in gathering the data was that the better teams on this list also had greater depth, except as mentioned in the case of Barbados, no doubt a reflection of its smaller population. The Australian teams would definitely stay in the same order.
Jon Richardson
Roar Pro
Interesting Rafiqul. Bangladeshi teams were at a disadvantage in this kind of comparison that covers a long history seeing it came to Test cricket late and has only recently getting some good results.
Jon Richardson
Roar Pro
Hi Matth - some pertinent comments here. Theoretically all batsmen’s scores would contribute to the hypothetical total runs scored but intuitively, you’re right - in picking your best bowlers for an individual game you wouldn’t worry too much about their batting average. Natal was really boosted by having all rounder bowlers like Pollock, Goddard and Procter. And a very fair point about Clyde Walcott- I think his average as keeper was only about 37, so Barbados would have dropped down to fourth behind Yorkshire. Or bring in a weaker batting keeper Hard to drop one of the three W’s - the obvious one to drop would be Desi Haynes but that would have broken my rule about 2 openers in each team I’d Hi Matth - some pertinent comments here. Theoretically all batsmen’s scores would contribute to the hypothetical total runs scored but intuitively, you’re right - in picking your best bowlers for an individual game you wouldn’t worry too much about their batting average. Natal was really boosted by having all rounder bowlers like Pollock, Goddard and Procter. And a very fair point about Clyde Walcott- I think his average as keeper was only about 37, so Barbados would have dropped down to fourth behind Yorkshire. Or bring in a weaker batting keeper Hard to drop one of the three W’s - the obvious one to drop would be Desi Haynes but that would have broken my rule about 2 openers in each team I’d Hi Matth - some pertinent comments here. Theoretically all batsmen’s scores would contribute to the hypothetical total runs scored but intuitively, you’re right - in picking your best bowlers for an individual game you wouldn’t worry too much about their batting average. Natal was really boosted by having all rounder bowlers like Pollock, Goddard and Procter. The equivalence in this exercise for a four bowler team is: 4 runs in bowling average = 10 runs batting. And a very fair point about Clyde Walcott- I think his average as keeper was only about 37, so Barbados would have dropped down to fourth behind Yorkshire. Or bring in a weaker batting keeper. But hard to drop one of the three W’s - the obvious one to drop would be Desi Haynes but that would have broken my rule about 2 openers in each team unless there is none with a respectable record. McGill case shows you can’t attribute everything to a player’s success to their state of origin. But these figures need to be looked at in a general way rather than showing precise differences between provinces. Eg If you took out McGill and replaced him with WA’s next best spinner, Bruce Yardley, the average differential would drop by 10, and they would drop a couple of places on the rankings below Transvaal and Lancashire. But I wouldn’t have claimed that the one or two runs margin that WA has over these teams on the table is terribly meaningful anyway. But margins of 20-30 runs do look somewhat meaningful.
Rowdy
Roar Rookie
Ah, so. Well, if l recall they did a play a few for the Gropers. And, dang, SA lose Grum to Victoria. But we do get Greg n the GOAT.
matth
Roar Guru
The way to compare wickets to run is to Times each wicket by 30, which is pretty much the historical mean batting average since WWI
matth
Roar Guru
Never go shorter Jon, just split into more articles. I did one in the league section that turned into 28 articles!
matth
Roar Guru
When you are putting in around 240 stats per article, I think you can be forgiven one transposition error :happy:
matth
Roar Guru
Well I am glad you gave it to the Roar, Jon. Given my experience with these types of articles, I can believe the couple of years.
matth
Roar Guru
Yep, Cricinfo has birth place where known, but it’s not easily searchable, so hard to use as a filter. So you’d end up having to search every single test player individually.
matth
Roar Guru
Rowdy, Jon’s criteria is different to the Shield articles. I did the ‘most games ‘ criteria. Jon’s is ‘first representative ‘ I. E State of Origin.
matth
Roar Guru
Great analysis and great fun Jon. I haven’t read the comments yet so I may be repeating others. Some things that stood out for me, apart from intuitively agreeing that NSW was always going to win this. 1. On a per capita basis, Barbados wins hands down. 2. I might have only used batting averages of the top 6 or maybe too 8. Teams can get too big of a ‘bang for their buck’ but selecting bowling all rounders under your criteria. Particularly before say 1980, you’d get plenty of bowlers whose batting was irrelevant and they averaged single figures. Under your system a bowler who averages say 20 with the bat and 30 with the ball is more valuable to the team than one who averages 10 and 25. 3. Having a batting keeper, as opposed to the best keeper makes a huge difference. Using Walcott as a keeper pushes Barbados into third, but his average as a keeper was lower than his career average. 4. I think Australian teams may have an advantage due to the traditional diversity of pitches here. Take Western Australia. They are a strong pace bowling state, but rarely have spinners with top line stats. But Stuart MacGill moves to NSW where the pitches generally favor spin, hones his craft with more opportunities, has a batter state record and forces his way into the test team. Given the ‘state of origin’ criteria he boosts WA’s score. It’s an interesting effect I wouldn’t have thought of. Again, top notch article with lots of food for thought.