Let’s download the offload culture of Super Rugby this year, by comparing it to last season.
In 2018, the eight most frequent offloading teams were not Australian. The Waratahs came in at No.9 – above them were all five Kiwi teams, two South African outfits, and the Japanese franchise.
Perhaps surprisingly, the most offload-happy team was the Sharks, but they do have the Brothers du Preez plus Lukhanyo ‘Lucky’ Am, who likes to make things happen in his outside channel.
The 2018 Sharks offloaded on 12.5 per cent of their carries, which translated to 12.63 completed offloads per match.
Next were the Chiefs and Highlanders, who had the same rate of offloading – 10.8 per cent of carries ended in a successful offload.
But due to the Chiefs creating more carries in the first place – they are a higher possession team, and kick far less than the Highlanders – that translated to 11.81 and 10.44 offloads per match, respectively.
The Blues also offload more than a tenth of their carries, and as long as they have Sonny Bill Williams, can bank on being a ‘chicken wing’ team.

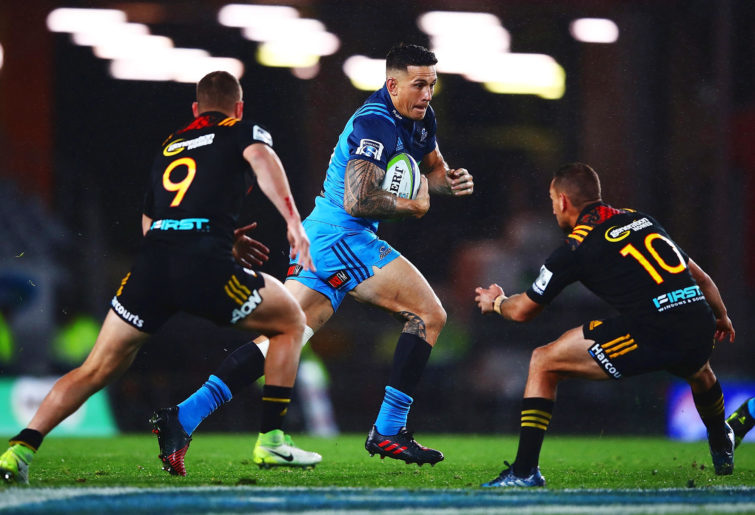
Sonny Bill Williams is a prolific offloader. (Photo by Hannah Peters/Getty Images)
The Hurricanes, Bulls, Sunwolves, Crusaders and Waratahs were in the next group, roughly at one offload for every nine carries, and about nine-and-a-half offloads per match in 2018.
From there, the rate fell precipitously until the bottom team – a grand finalist, the Lions, at 7.4 a game.
Thus, the high-scoring Lions averaged about half the rate of offloads as the Sharks (6.6 per cent versus 12.5 per cent), and this resulted in 5.23 fewer offloads per match.
Ironically, in the grand final, the Lions became prolific offloaders (12) and it did not look like it suited their style.
Here is the 2018 order of offloads per carry, with offloads per game in parentheses.
1. Sharks 12.5% of carries ended in an offload (12.63 offloads per game)
2. Chiefs 10.8% (11.81)
3. Highlanders 10.8% (10.44)
4. Blues 10.1% (11.94)
5. Hurricanes 9.2% (9.56)
6. Bulls 9.1% (9.43)
7. Sunwolves 9.1% (9.19)
8. Crusaders 9% (9.63)
9. Waratahs 8.9% (9.94)
10. Brumbies 8.5% (9.43)
11. Reds 8% (8.25)
12. Stormers 7.8% (8.5)
13. Rebels 7.5% (8.5)
14. Jaguares 7.2% (8.7)
15. Lions 6.6% (7.4)
This year, after seven rounds, it seems there has been less offloading in Super Rugby.
Two more teams than in 2018 are offloading on less than eight per cent of carries. Only two teams – the Chiefs and Waratahs – are offloading ten or more times a game.
The Chiefs, however, have upped their output of 11.81 a game in 2018 to a whopping 14.61 times a game in 2019.
The average is down, but who has increased?
The Chiefs, for one, offloading on almost 12 per cent of their carries.
The Brumbies are up almost 25 per cent up, from 8.5 per cent to 10.5 per cent of carries end in an offload this year.
The Waratahs are completing about 1.5 more offloads per game, including the top offloader in the tournament, Israel Folau.

Israel Folau is the Super Rugby’s top offloader. (Photo by Tony Feder/Getty Images)
The Jaguares are passing less and offloading more, and the Lions are also ending more carries with an offload.
We cannot draw conclusions from the composition of that group, except to postulate that rapid increases in high-skill additions with decreased decision-making time may not be a good idea.
The Chiefs’ Anton Lienert-Brown leads the way for his team, but 25 of his team-mates have completed an offload so far, with their big Canadian No.8 Tyler Ardron and Brodie Retallick particularly difficult to tackle.
To put the number 25 in context, the Rebels – who were skeptical of offloads in 2018 and are even more so this year – only have 13 offloading players thus far.
On the other hand, the teams that have decreased are headlined by the Sharks, who don’t have key offloader Jean-Luc du Preez.
The Hurricanes are down from 9.2 per cent of carries to 4.7 per cent, and almost half the number per game, with only 5.57 completed offloads per game.
The Rebels only complete five per match, the lowest in the competition, and the Reds have also dropped.
Then there’s the Bulls – mostly because of injuries to Bok locks RG Snyman and Lood de Jager – and the Highlanders – three less per game, even though they are kicking less.
The Canes do pass a lot, but they are simply not passing inside incomplete tackles. The Rebels don’t pass or offload much.
Who has stayed about the same? The Crusaders, with their perfectly calibrated 9.42 offloads per game, compared with the 2018 average of 9.63.
1. Chiefs 11.9% (14.61)
2. Brumbies 10.5% (9)
3. Waratahs 10.4% (10.5)
4. Crusaders 9.7% (9.42)
5. Sharks 8.8% (8.83)
6. Sunwolves 8.3% (8.28)
7. Jaguares 8.1% (8.17)
8. Blues 8% (8.28)
9. Highlanders 8% (7.17)
10. Bulls 7.8% (6.83)
11. Lions 7.7% (9)
12. Stormers 7.5% (8.5)
13. Reds 6.6% (6.83)
14. Rebels 5.6% (5)
15. Hurricanes 4.7% (5.57)
The overall picture is that in 2018, Super Rugby teams averaged 9.69 offloads per match, and this year, they are averaging 8.42 per match, after seven rounds.
RobC
Roar Guru
yes, the rules are finally starting not to change
Harry Jones
Expert
The non-changers winning.
RobC
Roar Guru
thanks Haaaazaaaa! Rebs are not offloading. But winning games!
RobC
Roar Guru
The Shorks backrow offloaded their Lions counterparts
Harry Jones
Expert
Offloads won both matches so far in Round 8.
CUW
Roar Rookie
@ Geoff Parkes i think the best illustration of these stats is the fact that CRusaders have a balance in their game that continues over seasons. l commented about the BLUES inability to keep hold of the ball after so many breaks - which rarely happens with Crusaders. it looks so fly - the offloads - but it is far better for end result to keep hold of the ball . of course the HIghlanders used to let the opposition have the ball and defend like crazy a couple of seasons ago. seems that is not the case this year.
CUW
Roar Rookie
@ Harry Jones i wonder if the lesser number indicated that teams are adjusting to the Ruck / breakdown law interpretation and implementation ? could it be teams are trying to hold on more - thus making opponent comit more to the breakdown ? and then create overlaps? I think the CHIEFS early season offload mania was partly due to DMAC at 10. one of his weakneses i think is his desire to offload all the time, rather than take a tackle and regroup. this was very evident in that Saffa test NZ lost - besides BB kicking.
MitchO
Guest
A mate of mine got tired of all the dropped ball around him and said "Guys. If you can't pass DONT!"
Brett McKay
Expert
Really interesting read, Harry, though like others, my perception was that there had been more offloading this season. It is additionally interesting to note the teams offloading more this year though, new styles finally kicking into gear...
Carlos the Argie
Roar Guru
Obviously, as a "lover" of all proper statistical issues, my comment was fully tongue in cheek. In the case of Harry I will not use the Russian expression used by Reagan: Trust but verify. I feel lazy today.
Harry Jones
Expert
Yes! So good to work in a few facts. My impression is this year, stung by last year’s offload bonanza, defensive coaches have adjusted. Also, it’s a risky thing to change too suddenly, particularly UP (adding too many offload attempts, too quickly). Crusaders’ stability looks about right.
Tuc Du Nard
Roar Rookie
Thanks Harry. So thorough. I could have sworn there was more offloading this year... oh well. Maybe the rush defence is lessening the opportunities. All sides seem to be rushing as much as they can.
Geoff Parkes
Expert
"I hate it when statistics corrects my subjective opinions or impressions!" Yes Carlos, there's no fun to be found in letting facts get in the way of pre-conception, bias and ignorance. :) Harry, my impression would be that a big factor in the Chiefs' poor start to the season was that there were too many offloads, too much play behind the adv line, too many million dollar plays, and not enough winning the hard yards first. In the last three weeks they've found a better balance, picked their moments better, and it was a tasty offload by Taleni Seu that won them the match last Sunday against the Jags.
Carlos the Argie
Roar Guru
So the Pumas offload more than the Jaguares? I also had the (false) impression that the Jaguares did offload a lot last year. Must be all the Creevy mentions. I hate it when statistics corrects my subjective opinions or impressions! Well done HJ. Once more. I missed some lyricism in this article.
Harry Jones
Expert
For context, in the 2018 Rugby Championship: teams averaged 9.1 offloads per match.