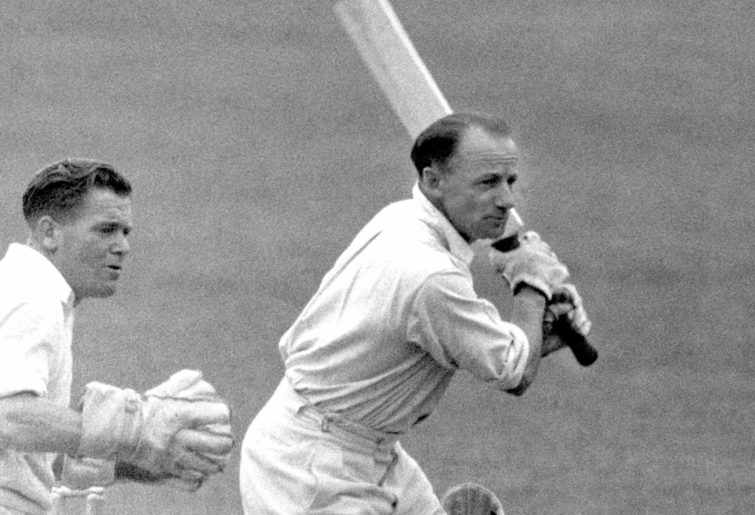
A common, reoccurring fascination with Don Bradman is how much he would or wouldn’t have averaged were he playing today.
Given that this question has come up frequently over the near 40 years I have been following the international game, it is now not so much a question of were he playing today but rather had he played in any subsequent era post his own.
For example, his average had he played in the 1960s, while likely different to his actual average in his actual era, may well also be different to what his average might have been had he played in the 1970s and ’80s or after the turn of the 21st century.
An idea for a new angle dawned on me. Rather than merely regurgitate the familiar and pertinent premises about stronger bowling attacks and pitches less conducive for productive batting, a light bulb suddenly went off in my head along the lines of the average length of time Bradman actually spent at the crease and the different amount of balls he would have faced had he played in different eras of different every day over rates?
It was in the Bradman albums, which I acquired nearly 30 years ago, where I read that he scored at an average rate of 50 runs per hour in all first-class cricket, which spanned 338 innings, 28,067 runs at an average of 95.14 with 117 centuries.
His Test component consisted of 80 innings, 6996 runs at an average of 99.94 with 29 centuries. Based on over rates of the day – approximately 120 balls bowled per hour – studies have been done to accurately estimate his strike rate at around 70 runs per 100 balls faced in all first-class cricket, and around 61-62 in Test cricket.
Based on these things, if Bradman scored at 50 runs per hour in all first-class cricket, and averaged 95.14, then this means that the average length of a Bradman first-class innings was about 115 minutes. During this time, based on 120 balls bowled per hour – whether 20 six-ball overs in England or 15 eight-ball overs in Australia – then 230 balls would be bowled, of which Bradman would face approximately 136 of them.
This amounts to 59 per cent of the strike. I am going to make the assumption that he commanded the same percentage of strike, on average, over the course of his Test innings.

(PA Images via Getty Images)
Striking at somewhere between 61 and 62 runs per 100 balls faced in Test cricket with his 99.94 average sees him facing around 162 balls per Test innings. That’s about 275 balls bowled by the opposition on average over the course of a Bradman Test innings.
With over rates remaining the same, then this means that Bradman on average spent 2.29 hours at the crease per Test innings, which amounts to 137 minutes and 30 seconds. Now, I am going to assume that this level of concentration would remain the same no matter what era he would have played in, in anyone’s alternative fantasy. I am basing this assumption on two things.
1. The ferocious West Indian pace attacks from the late 1970s until the early to mid-1990s were not only grounded in unrelenting pace, but also in slowing the game down by bowling considerably fewer overs per hour. This method had particular benefits on the rare days when conditions for batting were so good that even these ferocious attacks found wickets hard to come by.
For example, on a flat pitch, if the opposition managed to score three runs per over – a very good rate in the 1980s – and pass 200 with only three wickets down by bowling only 12 overs an hour rather than the expected 15, then come stumps on Day 1, their opposition would only have reached 3-216, rather than 3-270.
This tactic put an opposition batting line-up behind the clock and made a day of potential rare domination against these attacks a grind. Then, the bowlers could come out fresh the next day and bundle them out for under 300, rather than see them push on beyond 400, and this was a form of mental disintegration.
I don’t want to get too long winded, but my point is that there is only so long, time wise, that a human being can maintain concentration levels, and Bradman would not have been an exception to this.
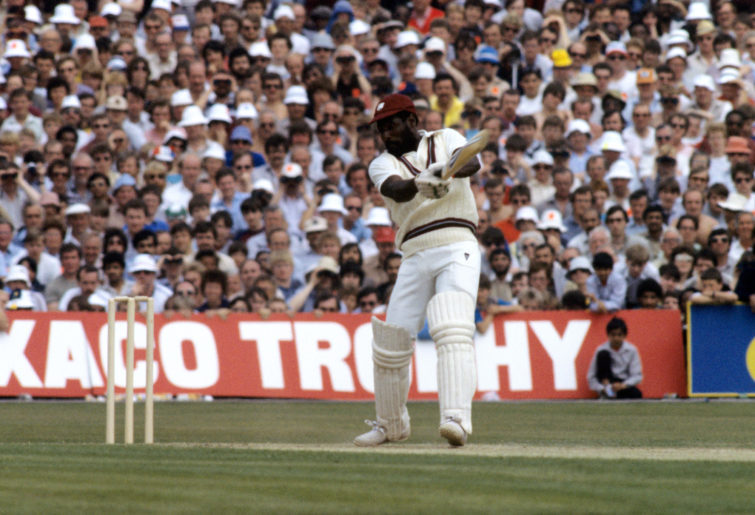
2. Anyone unconvinced by the previous part, allow me to perform a comparison between Bradman and Viv Richards. The Master Blaster averaged 50 in Test cricket at a strike rate of 67, which means he faced on average only 75 balls per innings (compared with Bradman’s aforementioned 162).
If we apply the 59 per cent of the strike as a standard average for all legitimate stroke players, this sees only 127 balls bowled by the opposition during an average Richards innings. King Viv played in an era where 90 overs a day was the expected norm, and only his own team really took the mickey out of this in the manner described in the previous part.
The teams the West Indies faced at least had regular spinners, so deliberately slowing the game down was somewhat more difficult. If we conservatively estimate that the Windies’ opposition teams averaged 14 overs per hour during the 1970s and 80s, then this means that an average Richards innings spanned approximately 90 minutes and 40 seconds – almost 48 minutes (or more than 50 per cent) less than Bradman’s average innings time wise.
(S&G/PA Images via Getty Images)
This last sentence is less a reflection of over rates across different eras, but more the concentration powers, time wise, of different batsmen. My mathematical premises still leave plenty of room for Bradman to sharpen his skills by hitting a golf ball against a circular tank for hours and hours on end in order to achieve superiority over all other batsmen.
Now to cut to the chase. If Bradman had played in the 1970s and ’80s, then over rates of the time might give him a base average in Test cricket of around 70 or 71. Bear in mind, only three batsman averaged more than 50 during the 1970s and they were Viv Richards, Greg Chappell and Sunil Gavaskar.
What may well take Bradman’s average slightly down on this estimate is the higher number of world-class bowlers across a bigger variety of opponents compared to his own era, as well as some somewhat more bowler-friendly pitches served up during this particular era.
Also, I wonder given his health problems in the mid-1930s how Bradman would have handled tours to India and Pakistan at a time when practically no Australian players wanted to go to those countries?
Playing from say the early or mid 1980s to the end of the 1990s would have seen the same constant with a high percentage of world-class bowlers in the opposition teams, although pitches were on the improve, slowly but surely, and administrators were gradually getting stricter with over rates.
However, the strictness came not with magically ensuring that teams bowled their mandatory 90 overs in six hours, but rather were made to stay out there beyond the six hours until they had done so. Therefore, Bradman’s average innings time wise stays at around 137 minutes.
However, during the 1990s, conditions greatly improved in terms of player comfort when touring the arduous sub-continent. I’ll stick with the base 70-ish average and assume less of a drop taking into account the various factors outlined.
In either case, he would have faced off in a sizeable percentage of his Tests against those aforementioned ferocious West Indian attacks, who also tended to stretch gamesmanship to its absolute limits through diabolically slow over rates before administrators wised up.
Fast forward to the most recent decade up to the present time and we have seen a shift from 90-over days that stretch beyond seven hours to a maximum of six and a half. However, over rates today put even those four-pronged West Indian attacks in the shade.
A standard day of Test cricket these days sees about 80 overs bowled in the standard scheduled six hours of play, and perhaps a further six in the maximum extra half hour. This equates to barely 13 overs per hour, so based on Bradman’s average length of stay at the crease, time wise, through no fault of his own, I can’t see Bradman averaging more than about 66 or 67.
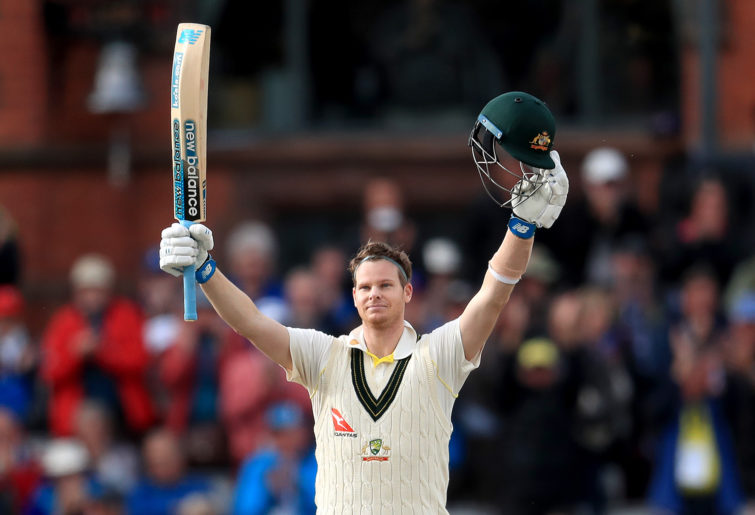
This does not mean that I consider Steve Smith to be as good a batsman as Bradman, or even the second best after him in Test history because my estimate for Bradman’s average playing today is a finishing career average, whereas Smith’s (average) will almost certainly start to decline within another year or two at the latest.
By the same token, there is no reason whatsoever, given normal career trends for great batsmen, why Smith’s average should not still be well and truly above 50 at career’s end. I do not necessarily consider Smith to be a superior batsman to Ricky Ponting or Greg Chappell, but only a fool would deny he is certainly just as good.
(Mike Egerton/PA Images via Getty Images)
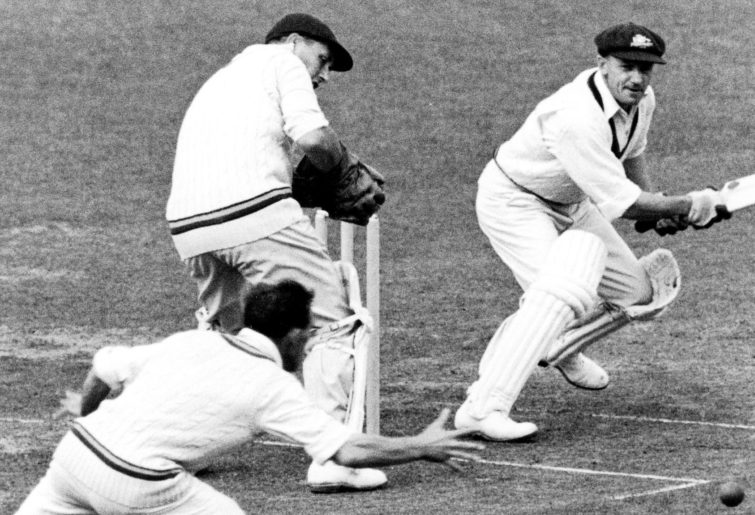
Back tracking to the 1950s and ’60s, these two decades would see Bradman averaging closer to his near 100 average than any subsequent decade or era simply because of standards. There were minnows aplenty who were still a long way off being genuine forces, such as India, Pakistan and New Zealand.
There were also less world-class bowlers per team even among the genuine powers, such as England and by now the West Indies, although there were certainly some genuine world-class bowlers about, such as Fred Trueman and Wes Hall.
I don’t know what over rates were like in the 1950s and 60s but I would assume they were not quite as good as in the 1930s, but more than likely still better than the 1970s and beyond. This would perhaps see Bradman averaging somewhere in the vicinity of 80-85 in Test cricket, if I take a wild guess that maybe the equivalent of 100 six-ball overs were regularly bowled in a strictly adhered-to six-hour day of playing time?
But what about one-day cricket? I am going to imagine that Bradman would have struck at around 80 runs per 100 balls faced playing between the end of World Series Cricket and the turn of the new century, and possibly as high as 99.94 runs per 100 balls faced playing today.
In the period 1979-2000, 80 was an exceptionally high strike rate in one-day cricket, which very few players achieved, whereas today, I am certain Bradman would be every bit as expert as AB de Villiers in adapting his game to take in the 360 degrees offered by the playing area in order to manipulate the field.
In the contemporary era, compared to the 1980s and ’90s, playing conditions in one-day cricket are also far more lopsided in favour of batsmen, not least of which is the consistently flatter and truer pitches.
It gets back to the powers of concentration. Making the same assumption that Bradman’s would last for, on average, 137 and a half minutes per innings, which equates to 65.5 per cent of a team’s available 50 overs in the format where over rates have always been far more strictly controlled by administrators.
This amounts to 32.4 overs, or 196 deliveries, of which based on the earlier notion of 59 per cent of the strike, Bradman would face 116 of them. I suppose there is also room for argument that strike might well be more evenly shared between batsmen at the crease in one-day cricket, though I have no reliable statistical analysis to either support or disprove such an assertion.
For the sake of argument, let’s imagine that Bradman, in theory, gets to face on average 100 balls per one-day innings.
(Photo by S&G/PA Images via Getty Images)
There is, however, one other very important definite variable in one-day cricket to consider and that is the compulsory closure after 50 overs. The thing is this: Bradman played in an era where all first-class games in Australia for the large majority of his career were timeless.
Even today, with five-day Tests, a batsman only has a one in four chance of going into bat with less time remaining than their average powers of concentration – in Bradman’s case 137 and a half minutes – remaining before time is called.
In one-day cricket, in principle, Bradman would have to be in no later than 17.2 overs into Australia’s innings to be afforded the opportunity to bat for his average time at the crease, irrespective of whether Australia is batting first or second.
There would be times he would be in well within this time frame, for sure, but in eras providing good opening combinations there would also be days when he would not be required to appear in the middle until well after the 30th over in the wake of an outstanding opening partnership of 150-plus.
Let’s imagine the first wicket fell at 33.2 overs, leaving precisely 100 balls remaining of which Bradman would face on average 59 of them, or perhaps only 50 (of the remaining deliveries in Australia’s innings). What would he do with those 50-odd deliveries he got to face?
Would he just plod along for an unbeaten run-a-ball half century while big hitters exploded all around him – with the Don perhaps feeding them the strike – or would he lift the tempo himself and perish for 70-odd in the 49th over?
It’s a tough one, and not easily reconciled. However, with my estimated 1980s and 1990s strike rate of 80 in one-day cricket he would also have a maximum average of around 80, whereas his near run-a-ball strike rate in this more recent time might see him average a maximum of around 99.94.
Whether either would be realistic in the abbreviated form of the game in is certainly debatable, given the overall nature of one-day cricket as a whole, and his average in either or both eras may well end up at least slightly downsized if for no other reason than the aforementioned variable unique to limited-overs cricket.
However, I none the less feel certain that Bradman would have been an absolute pyjama Picasso.
Once Upon a Time on the Roar
Roar Guru
Would be interesting to go back in time. Tests probably had a feel of bush cricket about them given that Melbourne and Sydney were little more than big country towns at the time. I think the entire population of Australia in 1900 was only around 3 million. Maybe a little bit more. Perhaps the standard was along the lines of state country XIs in contemporary times?
Ace
Roar Rookie
I can remember following the results of Australian tour of the West Indies in 1955 where the the 3 W's were in action. But it was Walcott who was the star of the series with 5 centuries. He scored a century in each innings of consecutive tests. Which is still unique I'm pretty sure. I'm not 100% now but Stan McCabe went out to bat in bad light in a test but wandered away from the pitch. The umpire was supposed to have told him it was over this way Stan and Stan said "keep talking , I'll find you"..I believe they could not appeal against the light. Not sure if thats correct or the humour. I also agree with All Day Roseville All Day that there was something romantic about Trumper's era
All day Roseville all day
Roar Guru
For me KS Ranjitsinhji, Victor Trumper, Frank Woolley and Charlie Macartney. The Golden Age !
All day Roseville all day
Roar Guru
I make it a strike-rate of between 48 and 52. We know that he averaged 56.94 with the bat, and Davis's tables indicate that on average he faced no more than 119 balls per dismissal. Which correlates with his average scoring-rate of 33 runs per hour, assuming an average hourly over-rate of between 21 and 23 (or slightly lower than that, if he got more than 50% of the strike, which is likely).
Once Upon a Time on the Roar
Roar Guru
Apart from Bradman the other batsmen from before my life time (born 1972) that I would love to see in action would be Walter Hammond, Stan McCabe, George Headley and Everton Weekes.
Ace
Roar Rookie
Good article. The one thing all of us would agree on is to have had the chance to see the Don in action. His powers of concentration must have been exceptional He excelled as a squash player and also snooker and was Australian Royal Tennis champion
Once Upon a Time on the Roar
Roar Guru
Actually I have erred with Hobbs … I seem to have made a big error in somehow accrediting him with facing every ball while out there!! 33 runs per hour with over rates in that era gives him a strike rate of 46 which was well above the norm for his time … Apologies for that little over sight.
Once Upon a Time on the Roar
Roar Guru
And also, if I am going to assume the constant of batting strike rates, then doing the same with bowling strike rates would see bowlers from the 1930s actually averaging more runs per wicket, because batsmen across the board score quicker these days so O’Reilly’s economy rate would be higher playing today. But that is quite ok because strike rates are the most important thing with bowlers as they have to take 20 opposition wickets within a limited time frame. Using 6 ball overs, O’Reilly’s economy rate was 1.94 per over with his strike rate of a wicket every 69.6, which is not terrible for a spinner, in fact it’s only 10 balls higher than Warne’s. O’Reilly playing today would still be a very classy test bowler for sure, but his economy rate would be higher, and therefore so would his average. His strike rate may come down, but not by a significant amount I wouldn’t imagine. Same for Grimmett who went for 2.16 runs per 6 ball over and struck with wicket every 67 balls.
Once Upon a Time on the Roar
Roar Guru
In fact, Ponting speeding up the overs in the final 40 odd minutes in Cardiff 2009 by bowling spinners was a major blunder and it was this that enabled England to wriggle free with a undeserved draw simply because more balls with less thought put in by the bowlers gave England a better opportunity to score enough runs to get past the innings defeat mark which in turn took 10 minutes out of the game from Australia’s perspective (change of innings had they then got that 10th wicket). They would have been better to bowl the faster bowlers – especially Hilfenhaus who had 4 wickets in the innings so far – and bowl less balls, thinking about things a bit more with England’s last pair knowing full well that one tiny mistake meant innings defeat as they weren’t going to get enough balls to score enough runs to make Australia bat again.
Once Upon a Time on the Roar
Roar Guru
“ … One could in fact argue that it would be harder to bat for 720 deliveries in a day, than for only 500. Far briefer gaps between balls and overs in which to switch off, take stock and re-set. … “ I disagree. Usually, it’s the team on top that wants the over rate sped up. When bowlers are getting smacked everywhere, generally the first thing they will do is slow the game down in order to disrupt the batsmen’s scoring momentum. Bowling 720 balls in a day instead of 540 also provides less opportunity for bowlers and captains to confer mid pitch and reset fields and even for bowlers to think deeply about what types of balls they are going to bowl and in what order to have a plan to dismiss batsmen. A batting side facing 540 balls in 6 hours is not mentally harder than facing 444 balls 6 hours, so why would 720 be necessarily harder than 540? Case in point: Allan Border told in his autobiography about the first day of the 2nd test in Georgetown 1991. They got to 6 hours, only 3 or 4 down but only 74 overs bowled. While annoyed that they’d been short changed 16 overs and therefore behind the clock with their total, they were also horrified when informed that the full 90 overs had to be bowled, which at the rate so far would take another 78 minutes. Border considered it most unfair that Geoff Marsh, who had batted through the 6 hours to that point, now had to somehow muster enough concentration to bat another hour and a quarter or more, which isn’t far less than an extra session. And then of course if Marsh did, he would be far more physically and mentally jaded the following day when he resumed his innings. As it turned out, Australia lost some key wickets during that over time. Adam Gilchrist is the fastest scorer of all, not Sehwag, and you can’t adjust Gilly’s down from Sehwag because Gilly started his career first and also retired first. Even David Warner, with nearly 73, one can’t claim that is normal even today, as the best batsmen Smith, Kohli, Root, Williamson and now Labuschagne all have test strike rates in the low to mid 50s, and players like Pujara and Cook have, or had in Cook’s case, strike rates only in the 40s, and Jacque’s Kallis, who only retired about 2014 and played 90% of his career since the turn of the new century, was in the low 40s, so Warner has damn near as much daylight with his contemporaries in terms of test match strike rate as any of Richards, Bradman or Trumper did. Interesting that now I have a reliable strike rate for Headley, using the same calculations gives him an estimated average of 46 (I tentatively had guessed 50) playing in the 1970s. 80s and 90s, which is in the Rohan Kanhai/Richie Richardson/Gordon Greendige/Clive Lloyd range, and still not far below Richards. 33 runs per hour for Hobbs, taking slightly more than 50% of the strike with 20 6 ball overs bowled per hour gives him a strike rate of only 25 or 26, slightly down on my educated guess of 30ish.
All day Roseville all day
Roar Guru
Hi Bernie, that's a lot to take in ! Like matth, I think that over-rates is just one of a huge number of variables that make it difficult to compare players across time. A champion in any era, would have had the talent to adapt and be a champion in any era. When Tests in Australia were timeless between 1882-83 and 1936-37, batsmen would have batted accordingly, except perhaps for Trumper and whenever an unprotected pitch was weather-affected. One could in fact argue that it would be harder to bat for 720 deliveries in a day, than for only 500. Far briefer gaps between balls and overs in which to switch off, take stock and re-set. Against a great bowler or in bowler-friendly conditions, the pressure on a batsman would literally be relentless. Perhaps Bradman would have averaged more, if over-rates to him had been lower ? Everything is relative. If contemporary over-rates would reduce Bradman's batting average from 99.94 to 71.00 solely on the basis of concentration levels, then surely it would also reduce his peer Bill O'Reilly's bowling average proportionately from 22.59 to 16.05, for exactly the same reason ? After all, a batsman facing him today would have 30% fewer run-scoring opportunities than one in the 1930s, before he lost concentration and got out. While grudgingly respecting the Windies' success in the 1980s, I hated its over-rates of 12 per hour, use of high bouncers to achieve dot-balls, and Gus Logie continually substituting for Desmond Haynes at 9-down to give Haynes more than 10 minutes to prepare for opening the batting. Such tactics are now rightly illegal. For anyone interested in over-rates and scoring-rates, statistician Charles Davis has done some amazing research and analysis- https://www.thecricketmonthly.com/story/1138684/who-are-the-fastest-scorers-in-test-history http://www.sportstats.com.au/hotscore.html He rates the four fastest scorers ever as (in order) Sehwag, Richards, Trumper and Warner. His many tables include fastest and slowest both per 100 balls and per hour, and both by raw figures and adjusted for historical changes in playing conditions. Sehwag scored at approximately 82 runs per 100 balls, Bradman at 61, Wally Hammond at 45, George Headley at 44, Allan Border at 41, Len Hutton at 38, Geoff Boycott at 35, and Glenn Turner at 32. But context and team requirements are everything, as Boycott and Turner demonstrated in one-day cricket, and Hutton did at The Gabba in 1950-51 on an unplayable pitch. Jack Hobbs is indisputably one of cricket's greatest batsmen. He averaged 33 runs per hour (Warner averages below 30), the 13th-fastest of all time, while playing until he was 47. In his era's over-rates and uncovered pitches, he found the perfect balance between risk and reward, and attack and defence. He scored more quickly or batted for longer periods, when his team required him to do so. And he played only timeless Tests in Australia, and predominantly 3-day Tests in England. He is impossible to compare to any 21st-century opener.
Once Upon a Time on the Roar
Roar Guru
Hey Paul, sorry for the late reply … happy father’s day …. Bradman could concentrate, for sure, and Smith also has his iconic fidgeting routines. Smith is one of the few players, using my calculations based on strike rates and over rates, whose average test innings is longer than Bradman’s – not by much mind you. Only 6 of Bradman’s 338 first class innings lasted longer than 6 hours and I don’t think there have been many players in any era before or after him who regularly batted longer than 6 hours in a test innings. Bradman actually nearly died of an attack of peritonitis soon after the 1934 Ashes series and missed the following Australian season as a result. After Kim Hughes resigned, on the eve of Border’s first test in charge, he invited Bradman to the pre test match dinner and Border wrote in his autobiography: “He chose not to coach us, but rather encourage us. He likened facing the West Indies four pronged pace attacks to what he and his team mates had been up against facing bodyline. While the West Indies were not aiming directly at the body, their ferocious pace was more relentless.” Bodyline fields were only employed about half the time during the 1932-33 series, and I clearly recall, in the 2nd test in Brisbane 1984-85, Border having no option but to fend a Joel Garner thunderbolt heading straight for his ribs into the waiting hands of short leg placed some 5-10 metres from the bat with a silly mid-on also in place. The thing about 6 close in on the leg side and two back on the fence is that there was much less chance that a fended shot would fall safely. Bodyline actually came about when Jardine viewed some footage of Bradman being very uncomfortable fending off some rearing Larwood deliveries late on a days play at the Oval in 1930 when he made 232 and otherwise smashed Larwood everywhere. When a ball sat up and said “hit me” then few if anyone possessed a more devastating pull shot than Bradman, but well directed bumpers could also cause him no end of discomfort. I have no doubt Bradman could have averaged 56.57 throughout the 1980s against those West Indian teams in test matches, but no one got anywhere near such an average against them over the whole decade. Border, for example, was one of the more successful batsmen against them and he averaged 39 against them. In one day cricket straight after world series cricket until 1984 Bradman would have found those ferocious Windies attacks more difficult than after that same year in which bouncers were banned and automatically no-balled. Roberts, Holding, Garner, Croft, Marshall and Walsh did not bowl bouncers that sat up and said “hit me”, not often anyway. But in any case, my projected maximum average of 80ish in one day cricket in the 1980s and 90s, would obviously have him cashing in against other teams if his average against the windies 1979-84 was cut back to say 47 … Nobody averaged anywhere near that against the west indies in them days – even after 1984 – and that was in fact Viv Richard’s career one day average and he finished in 1991. Bradman opening in one day cricket has merit, though keeping true as much as possible to every era it would not have happened until the mid-1990s which is when Mark Waugh started doing it. In this fantasy plain, we can certainly imagine Mark Waugh not existing, although I did actually mention in the article, which the roar edited out that from 1985 until the current day, Bradman would be batting behind various decent opening combos i.e. Boon and Marsh, MWaugh and Gilly, Gilly and Hayden and now Warner and Finch. I agree that the sub continental spinners, even the class ones such as Kumble, Harbajan, Mustaq Ahmed, Saqlain Mustaq and Abdul Qadir would not have had the wood on Bradman any more than Grimmet, pre 1935, and then O’Reilly thereafter, did in the Sheffield shield back then.
Once Upon a Time on the Roar
Roar Guru
Because a batsman can only concentrate for a certain amount of time. Bowl less balls the batsman scores less runs in the time that he maintains concentration. The West Indies tactics proved this theory during the 1980s.
Once Upon a Time on the Roar
Roar Guru
I’ve never said it’s 100% gospel truth. But it does have legitimate credibility for getting some idea about something we will never know for sure. And as I have said elsewhere it 100% supports the notion that Bradman was unquestionably the greatest.
DaveJ
Roar Rookie
Sorry Bernie, still don’t see how strike rates and over rates are a limiting factor on averages when comparing between different eras.
DaveJ
Roar Rookie
Think you’ve hit the nail on the head there Matth - the fact that the range of top averages and runs per wicket have stayed about the same for the last 100 years, and that Bradman was such a huge outlier. Another way of looking at it - no reason to think Hutton was anywhere close to Bradman, no reason to think Sobers was orders of magnitude better than Hutton, or that G Chappell better than Sobers or Richards orders of magnitude better than Chappell, etc etc. Somethings have changed or varied a lot, like scoring rates and strike rates for bowlers - thanks mainly to influence of white ball cricket- but what counts is how many runs scored. Just don’t see why number of balls bowled in a day would be a limiting factor on averages.
Once Upon a Time on the Roar
Roar Guru
Upon closer inspection, in line with what I said about Hammond under achieving, and in line with his stellar maiden tour out here in 1928-29, if you take out his 905 magnificent runs in 8 times dismissed on that maiden 1928-29 tour, (a record for the ages which Labuschange heartbreakingly missed breaking by 10 runs for an Aussie 5 test summer last year), and his 563 for once out in kiwiland right after bodyline, and New Zealand in that era were the equivalent of either Afghanistan or Ireland right now (at absolute best), then his test average drops from 58.5 in 85 tests, to 50.7 in 78 … that is a rather sizeable drop cutting out such a small portion of tests.
Pope Paul VII
Roar Rookie
Very interesting Bern. Thanks.
Once Upon a Time on the Roar
Roar Guru
— COMMENT DELETED —
Once Upon a Time on the Roar
Roar Guru
George Headley, Walter Hammond and Stan McCabe are a lot more difficult to do because I do not know their strike rates. I can only assume that their strike rates would have been considerably higher than Hobbs’s and more than likely less than Bradman’s. I’ll project Headley and McCabe into the 1970s, 80 and 90s, but all I can really do is a similar percentage of what turned out to be roughly 75% of his (Bradman’s) average for Bradman based on Bradman’s known strike rate and over rates for his time. However, there are some other variables that don’t exist for Bradman. None of Hammond, Headley or Bradman would have played in the 2nd half of the 1940s had there been no World War 2. Of the three, only Bradman was still anywhere near his pre-war peak. Therefore, for Headley and Hammond, I am going to give them an adjusted average based on either an actual, or estimated pre-war average. For Headley this was 66, although he only played 36 test innings for this average. 75% of this is a fraction under 50, which was Viv Richard’s finishing test average. I will leave Hammond until last because I intend to do a comparison with Richards. I will not do Hutton because I know neither his strike rate nor standard over rates for the 1950s during which Hutton played the majority of his tests. Stan McCabe averaged 48 in 39 tests with 6 centuries, including three of test cricket’s immortal innings: 187 not out off 233 balls in the first bodyline test in Sydney 1932-33 when he first announced himself as a player of true class more than two years after his debut, 189 not out in 185 minutes in Johannesburg 1935-36 when umpire’s called the test off for bad light within sight of an Aussie victory because they were genuinely worried for the safety of the fieldsmen, so hard was McCabe striking the ball in the rapidly fading light, and 232 at Trent Bridge in 230 minutes in 1938, scored out of a mere 300 added to the team total while he was at the wicket. Some things to note about McCabe: 1. In the aforementioned 187 not out and 232, large portions of each were batting with the tail and entailed 10th wicket partnerships of 55, McCabe’s share 51 and 77, McCabe’s share 69 respectively – both were real Stokes-Lynch type stuff of a year or so ago, with McCabe farming the strike almost completely as the last recognised batsmen in do in such situations. This means that in those innings, McCabe commandeered a considerably higher share of the strike than the generic 59% I have afforded to genuine stroke players for the purpose of this argumentation. 2. McCabe was only 28 when he played his last ever test series in 1938, and in the last 14 of his 39 tests, had scored 4 of his 6 tons. With only 2 of those 6 tons in his first 25 tests, then this indicates that McCabe had made a slow start to his test career, but that his star was now well and truly rising, and his average had reached 48. I think it’s a reasonable premise he might have gotten his average as high as 60 had there been no world war 2? This being the case, with no reliable career strike rate, if we also apply the same 75% that we applied to Headley as a result of the more reliable data for Bradman, then if McCabe had played in the 1970s, 80s or 90s and averaged around 41 or 42 then this would be the same average as Mark Waugh, who finished his career as Australia’s 3rd highest run scorer in test cricket. 3. For players such as McCabe, Doug Walters (who averaged 47) and Mark Waugh, averages are completely superfluous as they are almost wholly and solely impact players who did what was needed on the day … Walters and Mark Waugh, in their respective eras, would time and time again seal test series wins for Australia by playing their almost customary one meaningful innings each series at a pivotal time in the series. McCabe’s three aforementioned immortal innings were played when Australia were in deep trouble, with Bradman not playing on two occasions and having failed in the other. Kim Hughes came in at 3 for 10 in Melbourne on Boxing Day in 1981 against Roberts, Holding, Garner and Croft and made an unbeaten 100 off 200 balls in an all out team total of 198. In Hughes’s stead that day, I can imagine McCabe scoring an unbeaten 200 of 300 balls in a team total of 298. Finally Walter Hammond and Viv Richards … cricket historians believe that Walter Hammond, despite being the first and fastest to 7000 test runs in terms of innings until last December, and despite averaging 58 in doing so actually under achieved. They lay the blame at Bradman’s feet. Hammond’s first Ashes series, also Bradman’s first, in 1928 was almost as phenomenal as Bradman’s 1930 series: Hammond scored 905 runs at 113.13 with 4 tons, two of them doubles. He also broke Bradman’s record score of 334 with 336 not out in kiwi land in early 1933 right after the bodyline series, and an innings of 227 in the other test that series, saw him average 563 for the series. In that Bodyline series, with Bradman’s average cut down to 56.57, Hammond had two moderate tons of 112 and 102 as well as 85 in the spiteful Adelaide test. And yet, in 1930, he made 113 to save the Headingly test after the Don scored that 334, but did stuff all else in the series, in 1936-37 he played a majestic innings of 231 not out in Sydney but did next to nothing else that series, and then in 1938 he made a thunderous 240 at Lords and did little else all series. Hammond has been described as an emperor denied an empire and cricket historians blame it on the fact that he lived in Bradman’s shadow. Like Headley, for the reasons cited, I am only going to use Hammond’s pre-war average which would have been above 60. Projecting Hammond into the 21st Century with Bradman’s estimated 2/3 quotient for this era this gives Hammond a minimum starting average of 40 – remembering he under achieved, and without Bradman undermining his greatness, then he might actually fulfill his true potential. Another 7 runs on his average would see him with the same average as Kevin Pietersen, and I believe those two to be England’s greatest two batsmen ever. The other thing about Hammond, lesser known, is that he was a reputed womaniser, particularly on long tours – sometimes let his wrong blade do the talking etc, and this was quite likely an outlet for the personal frustration he felt with the Bradman phenomenon. Playing in the 21st century scrutiny and spot light, he would never get away with this kind of thing, so maybe would knuckle down and show the world what he could truly do? Finally, I am going to quickly project Viv Richards back to Bradman’s era. With an average Richards innings being around 90 minutes, that is 30 overs that in Bradman’s time, so Richards faces 106 balls at his strike rate of 67 for an estimated average of 71 compared to Hammond’s underachieving average of 58. Was Richards a greater performed player in his era, than Hammond was in his? Wisden seemed to think so, for they chose Richards as one of their five greatest cricketers of the 20th century, whereas Hammond missed out.