‘Test cricket is won by the number of runs, not by the speed of the scoring’.
Although a Roarer made this claim without a hint of prevarication it turns out our cricket community is rather divided on the matter.
Let me preface this discussion by stating that this article is not about individual situations, this particular match or the low-scoring World Test Championship game.
This debate revolves purely around the significance, or otherwise, of a career strike rate. Is scoring speed an important consideration in Test match cricket?
In my estimation, roughly 60 per cent of Roarers agree with the opening statement, 30 per cent are opposed, and the remainder lie somewhere in between. I would like to rekindle this discussion and perhaps add some carefully chosen fuel to the fire. Let me begin by disposing of the no-brainers.
A strike rate is meaningless if not accompanied by a respectable average. Specialist batsmen who strike at 80 are of little value in modern Test cricket if their average falls below 40. This is a given. The second obvious comment is that unless a player is representing a minnow nation, a minimum strike rate is mandatory.
You are justified in questioning the value of any middle-order batsman whose career strike rate sits below 40, and any opening bat whose number is below 35. An allowance should be made for those who go in first and are required to blunt a new ball attack.
One of the problems in the discussion that gave rise to the opening quote was the preoccupation with comparing individual batsmen, say one who averaged 50 while striking at 65 with another who averaged 65 while striking at 50. This type of comparison is not particularly enlightening, at least not to begin with.
Rather, let us examine the impact of slow and fast scoring across both innings. Most Test matches require the best part of 600 runs from the winning team. The next table identifies the time required to reach this total at a variety of strike rates, and the time left to seize 20 opposition scalps.
| Strike rate | Overs required | Overs remaining | Time remaining |
|---|---|---|---|
| 40 | 250 | 195 | Two days plus 15 overs |
| 50 | 200 | 245 | Two days plus 65 overs |
| 60 | 167 | 278 | Three days plus eight overs |
| 70 | 143 | 302 | Three days plus 32 overs |
| 80 | 125 | 320 | Three days plus 50 overs |
If we are realistic, on most decks, two days and 15 overs are insufficient to dismiss a decent batting side twice. Therefore, teams that score at 40 will only be able to win low-scoring games, with match totals below 500. The English team who toured down under in the season of 1970-71 provides an excellent case study. Anyone familiar with this series would know that England were the stronger team.
The Australians were going through a period of transition. Graham McKenzie, Alan Connolly and Bill Lawry played in their last series and Johnny Gleeson played in his penultimate series. Based on the flow of each game, England should have won four of the first five Tests but instead they could only point to a solitary win. Was it the weather? Did rain rob the Poms of their hard-earned spoils?
Not a bit of it! Every Test saw the delivery of at least 490 six-ball overs, 40 more than we could expect from a modern Test. It doesn’t take Sherlock Holmes to discover the cause. England’s scoring rate in the five games were 39, 37, 43, 35 and 43, which includes extras! As I said, you are not going to win too many Tests with a scoring rate of 40.
Suppose you are asked to choose between these scenarios:
A. End Day 1 with the total 405 all out
B. End Day 2 with the score 5-450

(Photo by Patrick Hamilton/AGP via Getty Images).
The first set-up depicts a team batting average of 50 scoring at 75 and the second an average of 90 scoring at 42. Based on the performances of the Englishmen in 1970-71 and personal observation, the second option will lead to stalemate in approximately four out of five Tests. On the other hand, with four full days remaining, the first match is still wide open. Here is an example of scenario A.
In December 1972, Australia declared their first innings just before lunch on the second day with the score 5-441 (having been 4-349 overnight). In reply, Pakistan made 8-574 after occupying the wicket for the best part of two days. Despite trailing by 133, Australia batted aggressively second time around (strike rate 61) to leave the visitors almost the entire last day to make 293. Thanks to Max Walker and three run outs, Australia finished with a 92-run advantage.
You could be forgiven for thinking that a first-innings score of 574 is an insurance against defeat. This goes to show the impact scoring rate has in determining the direction of a match. By scoring at 62 per 100 balls, the home side had severely reduced the possibility of a drawn contest. As a general tenet, a team strike rate above 65 almost eliminates the possibility of stalemate, even on the most lifeless of surfaces.
Are we any closer to answering the original question: does strike rate matter?
We can think of runs per wicket (average) and runs per ball (strike rate) as commodities. If time is abundant then the scoring rate becomes irrelevant and if runs are abundant, then the average becomes irrelevant.
This last claim may seem heretic but think about this idea in practice, is 5-500 much better than 500 all out? At a certain point, the value of those extra runs yields a diminishing return and, conversely, the importance of scoring rate escalates. All-out 500 after four sessions is much better than 5-500 after six.
(Photo by Ryan Pierse/Getty Images)
For what it is worth, these are my thoughts.
In low-scoring games, the scoring rate is irrelevant (this would mean in roughly 20 per cent of Tests). In medium- to high-scoring games, the scoring rate matters. Strong teams prefer high strike rates while weaker sides are partial to the reverse.
Translating this into individual career performances, a batsman who averages 50 and strikes at 70 is more valuable than one who averages 55 and strikes at 50. Those extra five runs in average are more than counterbalanced by the match winning potential of 4.2 runs per over.
Since the traditional batting average is typically used to compare the best players rather than those at the lower end, it can be assumed these batsmen represent strong teams or sides that will benefit from the elimination of drawn matches. With this in mind, I propose a fusion of the batting average and the strike rate with the following caveats.
Firstly, the batting average must be of a minimum standard.
In the 21st century, I would say above 45, between 1920 and 2000, above 40 and pre-1915, above 30.
Secondly, trade strike rate with batting average in this manner.
A batsman who averages 50 and strikes at 60 is equal to one who averages 55 and strikes at 50, who is on a par with one averaging 61.1 while striking at 40.
This assumes that the par strike rate is 50 per 100 balls. In the first example, the batsman is striking at 20 per cent above par and has their average elevated by half of this, i.e. 50 x 1.1 = 55.
And the third batsman has a strike rate 20 per cent below par and so their average is reduced by half this percentage: 61.1 x 0.9 = 55.
Originally, I had in mind to base the percentage increase or decrease on the average strike rate for that era but on second thought I cannot see why the era rate is meaningful, at least in terms of the outcome.
If Freddie strikes at 40 and normal for that era is 36, there is no reason to elevate his performance. All that matters is whether a scoring rate helps the team gain time to then capture the necessary wickets.
In the tables to follow, I have grouped players according to their era and the fusion averages only have relevance within that epoch. A fusion average of 40 in the golden age is very different to one of 40 in the modern era, with its higher averages and even higher strike rates. Therefore, I only recommend comparing players from the same era.
Here is a table with the fusion results for a number of celebrated players for a variety of eras.
Golden age
| Batsman | Era strike rate | Strike rate | Par rate | Average | Strike rate premium | Fusion average |
|---|---|---|---|---|---|---|
| VT Trumper | 43.2 | 68.0 | 50 | 39.05 | 1.18 | 46.1 |
| C Hill | 43.2 | 58.0 | 50 | 39.21 | 1.08 | 42.3 |
| RA Duff | 43.2 | 55.5 | 50 | 35.59 | 1.08 | 37.6 |
| WW Armstrong | 43.2 | 46.4 | 50 | 38.69 | 0.96 | 37.3 |
| T Hayward | 43.2 | 37.2 | 50 | 34.47 | 0.87 | 30.0 |
1950-69
| Batsman | Era strike rate | Strike rate | Par rate | Average | Strike rate premium | Fusion average |
|---|---|---|---|---|---|---|
| RG Pollock | 42.8 | 55.8 | 50 | 60.97 | 1.06 | 64.5 |
| GS Sobers | 42.8 | 57.4 | 50 | 57.78 | 1.07 | 62.1 |
| KF Barrington | 42.8 | 41.1 | 50 | 58.67 | 0.91 | 53.5 |
| RB Simpson | 42.8 | 47.2 | 50 | 46.81 | 0.97 | 45.5 |
1970-1999
| Batsman | Era strike rate | Strike rate | Par rate | Average | Strike rate premium | Fusion average |
|---|---|---|---|---|---|---|
| IVA Richards | 46.5 | 68.0 | 50 | 50.24 | 1.18 | 59.3 |
| GS Chappell | 46.5 | 46.5 | 50 | 53.86 | 0.97 | 52.0 |
| SR Waugh | 46.5 | 48.6 | 50 | 51.06 | 0.98 | 49.8 |
| AR Border | 46.5 | 41.0 | 50 | 50.56 | 0.91 | 46.0 |
| ME Waugh | 46.5 | 52.3 | 50 | 41.82 | 1.02 | 42.8 |
| G Boycott | 46.5 | 35.4 | 50 | 47.73 | 0.85 | 40.8 |
2000 onwards
| Batsman | Era strike rate | Strike rate | Par rate | Average | Strike rate premium | Fusion average |
|---|---|---|---|---|---|---|
| V Sehwag | 50.6 | 82.2 | 50 | 49.34 | 1.32 | 65.2 |
| SPD Smith | 50.6 | 55.1 | 50 | 61.80 | 1.05 | 65.0 |
| BC Lara | 50.6 | 60.5 | 50 | 52.89 | 1.11 | 58.4 |
| RT Ponting | 50.6 | 58.7 | 50 | 51.85 | 1.09 | 56.4 |
| SR Tendulkar | 50.6 | 54.0 | 50 | 53.78 | 1.04 | 55.9 |
| ML Hayden | 50.6 | 60.1 | 50 | 50.74 | 1.10 | 55.9 |
| J Kallis | 50.6 | 46.0 | 50 | 55.37 | 0.92 | 50.9 |
| R Dravid | 50.6 | 42.5 | 50 | 52.31 | 0.85 | 44.5 |
These are my thoughts on a few results.
Virender Sehwag is probably higher than he should be and I note that his average in Australia, New Zealand, South Africa and England is a mere 33.4, and this would bring his fusion average in those countries to a modest 44.
Brian Lara warrants a place near the top of his group because his impact was that much greater than players like Rahul Dravid and Jacques Kallis. The innings Lara played at Bridgetown to bring his side a most famous one-wicket victory could only have been delivered by a fast-scoring batsman.
Gut feel told me that Vivian Richards was a class above Greg Chappell and three classes above Geoff Boycott. According to the regular averages however, Boycott and Richards are close – wow! I can think of at least five innings that Richards played that gave his team a shot at victory purely because of his blistering scoring speed: 291 at a strike rate of 75.5, 208 at 84.9, 146 at 97.3, 123 at 72.3 and 110 not out at, wait for it, 190.
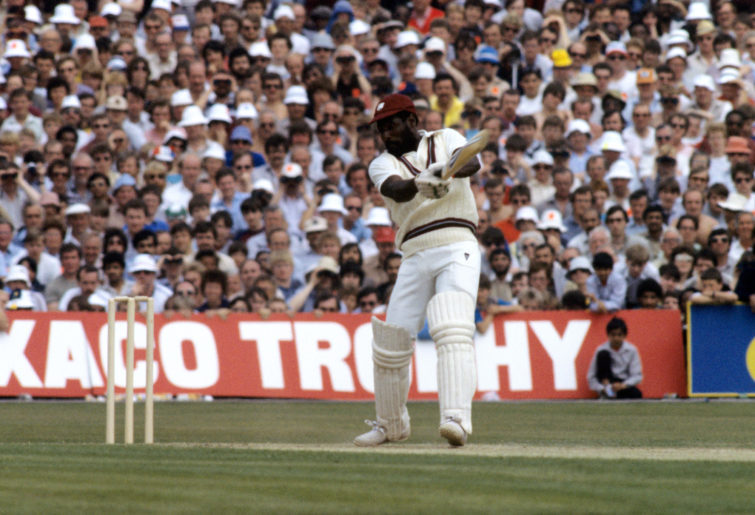
(S&G/PA Images via Getty Images)
The West Indies won three of these five games and had the opposition one and two wickets from defeat in the other two. All five matches finished in the last session of the last day, meaning that without Richards and his unbelievable strike rate, these games would have ended as tame draws. As I have said before, there is batting average and then there is match impact. Richards was a player of impact.
Another vindication of the fusion average is the position of Graeme Pollock and Garfield Sobers relative to the dour, ‘let’s avoid defeat at all costs’ Ken Barrington. All that is wrong with the traditional batting average is encapsulated in the career of Barrington.
After all, here is a player who in 23 Ashes Tests averaged a Herculean 64.0. In ten of these games, he made a score of 75 or more and you could be forgiven for thinking that England must have won at least half of these contests. I will leave the reader to guess how many of the ten games ended with an English victory.
Victor Trumper is the exact opposite of Ken Barrington. His average in Ashes cricket is only half that of the Englishman (32.8) and he surpassed 75 in seven of his 40 matches against the arch enemy. Nevertheless, as purely an impact player, his team won six of the seven (and would have won them all had he not been left stranded on 185 not out).
Of course, in Trumper’s time, matches in Australia were played to a finish and so scoring rate was practically irrelevant. However, matches in England were contested over three days and hence strike rate became a major consideration. His two centuries in England – 135 not out at 71 per 100 balls, and 104 at 99 – not only won both matches, but also the series and the Ashes. Substitute a scoring rate of 40 and both these games are drawn.
Of course, I am not suggesting that this is a perfect system but merely advocating for this fusion average to be used as a starting point when comparing the very best batsmen, not the also rans. I know that many Roarers are seduced by the player who averages 60 even if they score at miserly 40 per 100 balls. Nevertheless, it is worth bearing in mind that avoiding defeat frequently means also avoiding victory.
Once Upon a Time on the Roar
Roar Guru
Viv Richards missed the 1980 series in New Zealand.
Once Upon a Time on the Roar
Roar Guru
That’s cool. (I didn’t see this notification either) ____________ I shan’t be writing too many more articles for a while. You should at least write two more to get pro status. It just isn’t right that you only have rookie next to your name when you have far more cricket and general intelligence than just about all other roarers combined.
Once Upon a Time on the Roar
Roar Guru
Hey mate, it seems you’ve given up on the roar completely, which I totally understand. It would be great to see you drop in again sometime though. Or is work just way too busy still?
Renato CARINI
Roar Rookie
I won't be commenting anymore, PR, but I'll make an exception for your articles. Just give me a heads up when you post something.
Once Upon a Time on the Roar
Roar Guru
Have you given up on the roar completely? Or just still super hectic busy?
Not saying you are wrong Renato, maybe I am thinking of the 1980 series that NZ won 1 nil thanks for the correction assuming you are correct :happy:
Renato CARINI
Roar Rookie
Zozza, this was in 86-87 The series finished 1-1
Richards my all time favourite batsman. But, NZ ended up winning that Test Series. Hadlee lost the battle, but won the war.
DaveJ
Roar Rookie
Great article Renato, which I’ve come to belatedly. It’s definitely worth using this kind of metric in comparing players whose averages are in the same general ballpark. As you say, there is no self-evidently correct measure to use to factor in strike rate but yours seems a great start for discussion. One reservation I have is that, while strike rates can help you win matches, sometimes draws can be crucial to winning or not losing series. To take an example, the Test in 2012 where de Villiers and du Plessis scored at a snails pace to secure a draw that ultimately put them in a place to win the series. Also, as others point out, in teams that are doing it tough, not losing or just gusting it out is about the best you can hope for, and might lead to lower scoring rates for better batters than if they were in top teams. But it looks pretty impossible to add in a stat that would take account of where slow scoring helps a team and when it doesn’t. As you’ve noted, scoring rate was less relevant in timeless tests, which makes it hard to compare with other eras. Other reasons why it’s difficult to compare between eras include the fact that bigger bats and smaller boundaries have undoubtedly made scoring faster in the last couple of decades. So has the practice at shot making that comes with a lot of T20 cricket - but does that we should rate the modern player higher than someone with same average 30 years ago just because they have a higher strike rate? For instance, Langer and Martin Crowe had similar averages but Langer had a ten point better SR, but I’d be a bit wary of saying Langer was the superior player given the circumstances they were playing in. I’d be looking at other factors, including the average run totals of the era and on the pitches they played on, and how they performed away from home in particular. As well as affecting averages, the general batting conditions and strength of bowling attacks can also affect strike rates. Your man Victor would be a standout once we corrected the average for average runs/wicket in his era (15-20% lower than in later decades). But other contemporaries and maybe Victor himself probably had their scoring rates suppressed by playing in that era.
Renato CARINI
Roar Rookie
Agreed, JGK. Hutton could afford to take a few chances, especially once past 50. But his average would drop a little, too. Which underscores the theme highlighted in this piece.
Renato CARINI
Roar Rookie
Cheers, Pope. I did say early on that the study was focused on CAREER strike rates. Naturally, circumstances change from match to match.
JGK
Roar Guru
I can forgive Hutton as that was the era they lived and Mayes in. Compton was seen as a dasher with a strike rate of around 50. I have little doubt that if you put a 25 year old Len Hutton into the current England side, he’d dominate.
Pope Paul VII
Roar Rookie
Good bowling, defensive field placings, defensive bowling and deliberate slow over rates are all things that will put a halt on fast scoring. The West Indies of the great era 76-93 certainly used defence to slow opponents down if they looked like getting away. And in the olden days there were longer boundaries and less chunky bats.
Paul
Roar Guru
" there is really no excuse for making a big hundred at a SR of 40 (unless you’re trying to save a game)." I'm not sure I agree with that Renato. Right now, Test cricket is not full of strong Test batsmen and that applies to Australia as much as it does to teams like South Africa, Sri Lanka, the West Indies and England. We only have to go back a decade or so and look at each country's batsmen to know what I mean. Remember too, most Tests are over inside 4 days and more than a few have barely lasted 3 days In this era, it makes sense for guys to make a big score and bat slowly if it means the team makes a match winning total in the first innings, leaving time to bowl out the opposition twice. The Black Caps have done this very successfully in recent years, as did Pujara for India.
Renato CARINI
Roar Rookie
Thanks, Paul. To your second paragraph, there is really no excuse for making a big hundred at a SR of 40 (unless you're trying to save a game). All the great players start to push the match along when they get to 60 or 70, hit the accelerator, as it were. It's fine to start slowly, even wise but 160 off 400 balls is sin.
Once Upon a Time on the Roar
Roar Guru
Far less needed for bowlers as the number of wickets to be taken in a test by your team is capped at 20, whereas there is no such cap for runs needed to be scored. Balls per wicket taken is the best indicator for a bowler because you also have, in theory, to take those 20 wickets in not too much more than 200 overs bowled by your team in total. A bowling average of runs conceded per wicket doesn’t tell us much, and the second thing to consider is economy rate, but it is a distant second to strike rate. Which is more valuable to a team: a bowler who concedes 30 runs per wicket, but strikes every 30 balls, and therefore having an economy rate of 6 RPO or one who strikes only every 60 balls but only whose economy rate is only 2 RPO thereby giving a bowling average of 20 runs conceded per wicket taken? For mine, a bowler’s average in his stats is nothing more than a red herring that simply appears as a result of the very important aforementioned strike rate and economy rate in the same way that mushrooms might appear after ongoing soaking rain.
Paul
Roar Guru
What a really interesting piece. Thanks for taking the time to work out this fusion as you call it Renato. I found your thinking both logical and sensible, while the whole article was a very good read. What really interested me was the initial sentence, which I assume brought on this piece; "Test cricket is won by the number of runs, not by the speed of the scoring". Test cricket is such a wonderfully tactical game and having a strong sense of the match situation is what IMO separates good players from great ones. This sentence to me sums up one type of one-dimensional batsman (lets just score runs), while the other is the reverse (lets score quickly). These players are good (let's face it, anyone good enough to play Tests for their country is good), but the great's can sum up the situation and bat accordingly. More to the point, they might change the way they bat through a day or even a session. I'm assuming a similar fusion could be done for bowlers, ie average & strike rate? It would be interesting to see who comes out on top if that exercise were attempted. I'd be curious to know how guys labelled "the greatest ever", because of the number of wickets they've taken, compare with guys who have played fewer Tests, hence taken fewer wickets. many thanks again Renato.
Renato CARINI
Roar Rookie
Just a tad. Sutcliffe at least played in timeless tests, here in Australia. And offered great value to his country. Hutton and Boycott, not so much.
All day Roseville all day
Roar Guru
What is it about Yorkshire opening batsmen ? Sutcliffe, Hutton, Boycott. Took the "no boundaries before lunch" thing too far ?
Once Upon a Time on the Roar
Roar Guru
Border’s prime years with the bat was from early 1980 to late 1988, with his most consistent period being early 1985 to late 1988, peaking in 1985 and 86. The Jan-Feb 1985 WSC also saw him achieve his personal highwater mark in one day cricket, scoring 590 at 59 in 13 matches that home summer in one day cricket and that same WSC also saw two of his three ODI tons, which was an Aussie record equal with Greg Chappell at that point in time.