In the wake of Australia’s World Cup win, Mohammed Kaif and others suggested that India still had the best team on paper, evoking fond memories of Stuart Broad’s claim that England took the Ashes with a moral victory.
I usually don’t pay too much attention to ODI stats, particularly as so many meaningless games have been played, with lots of players getting rested, a growing trend since T20 internationals have crowded the fixture list. Nevertheless, I thought the hiatus before the Test season brings a chance to delve into some fantasy cricket and look at who have been the best players on paper.
How to measure the best 50-over cricketers over the decades? Whose overall ODI record is better – Virat Kohli averaging 58 at 93 runs/100 balls, or AB de Villiers averaging 54 at 100?
Batting and Bowling Impact
ABC cricket statistician Ric Finlay has devised a metric that combines both batting and bowling averages on the one hand, and scoring rates or economy rates on the other. “Batting Impact”(BtI) is the geometric mean of a player’s average and career scoring rate – that is, the square root of [batting average multiplied by scoring rate]. “Bowling Impact” is measured in a similar way, and the same method can be applied to T20s.
This means that a player averaging 40 at a scoring rate of 90 (similar to Andrew Symonds) has the same Batting Impact as someone averaging 30 at 120 (close to Glenn Maxwell) or 45 at 80 (a bit above Kane Williamson). All would earn a BtI of 60, the square root of 3,600.

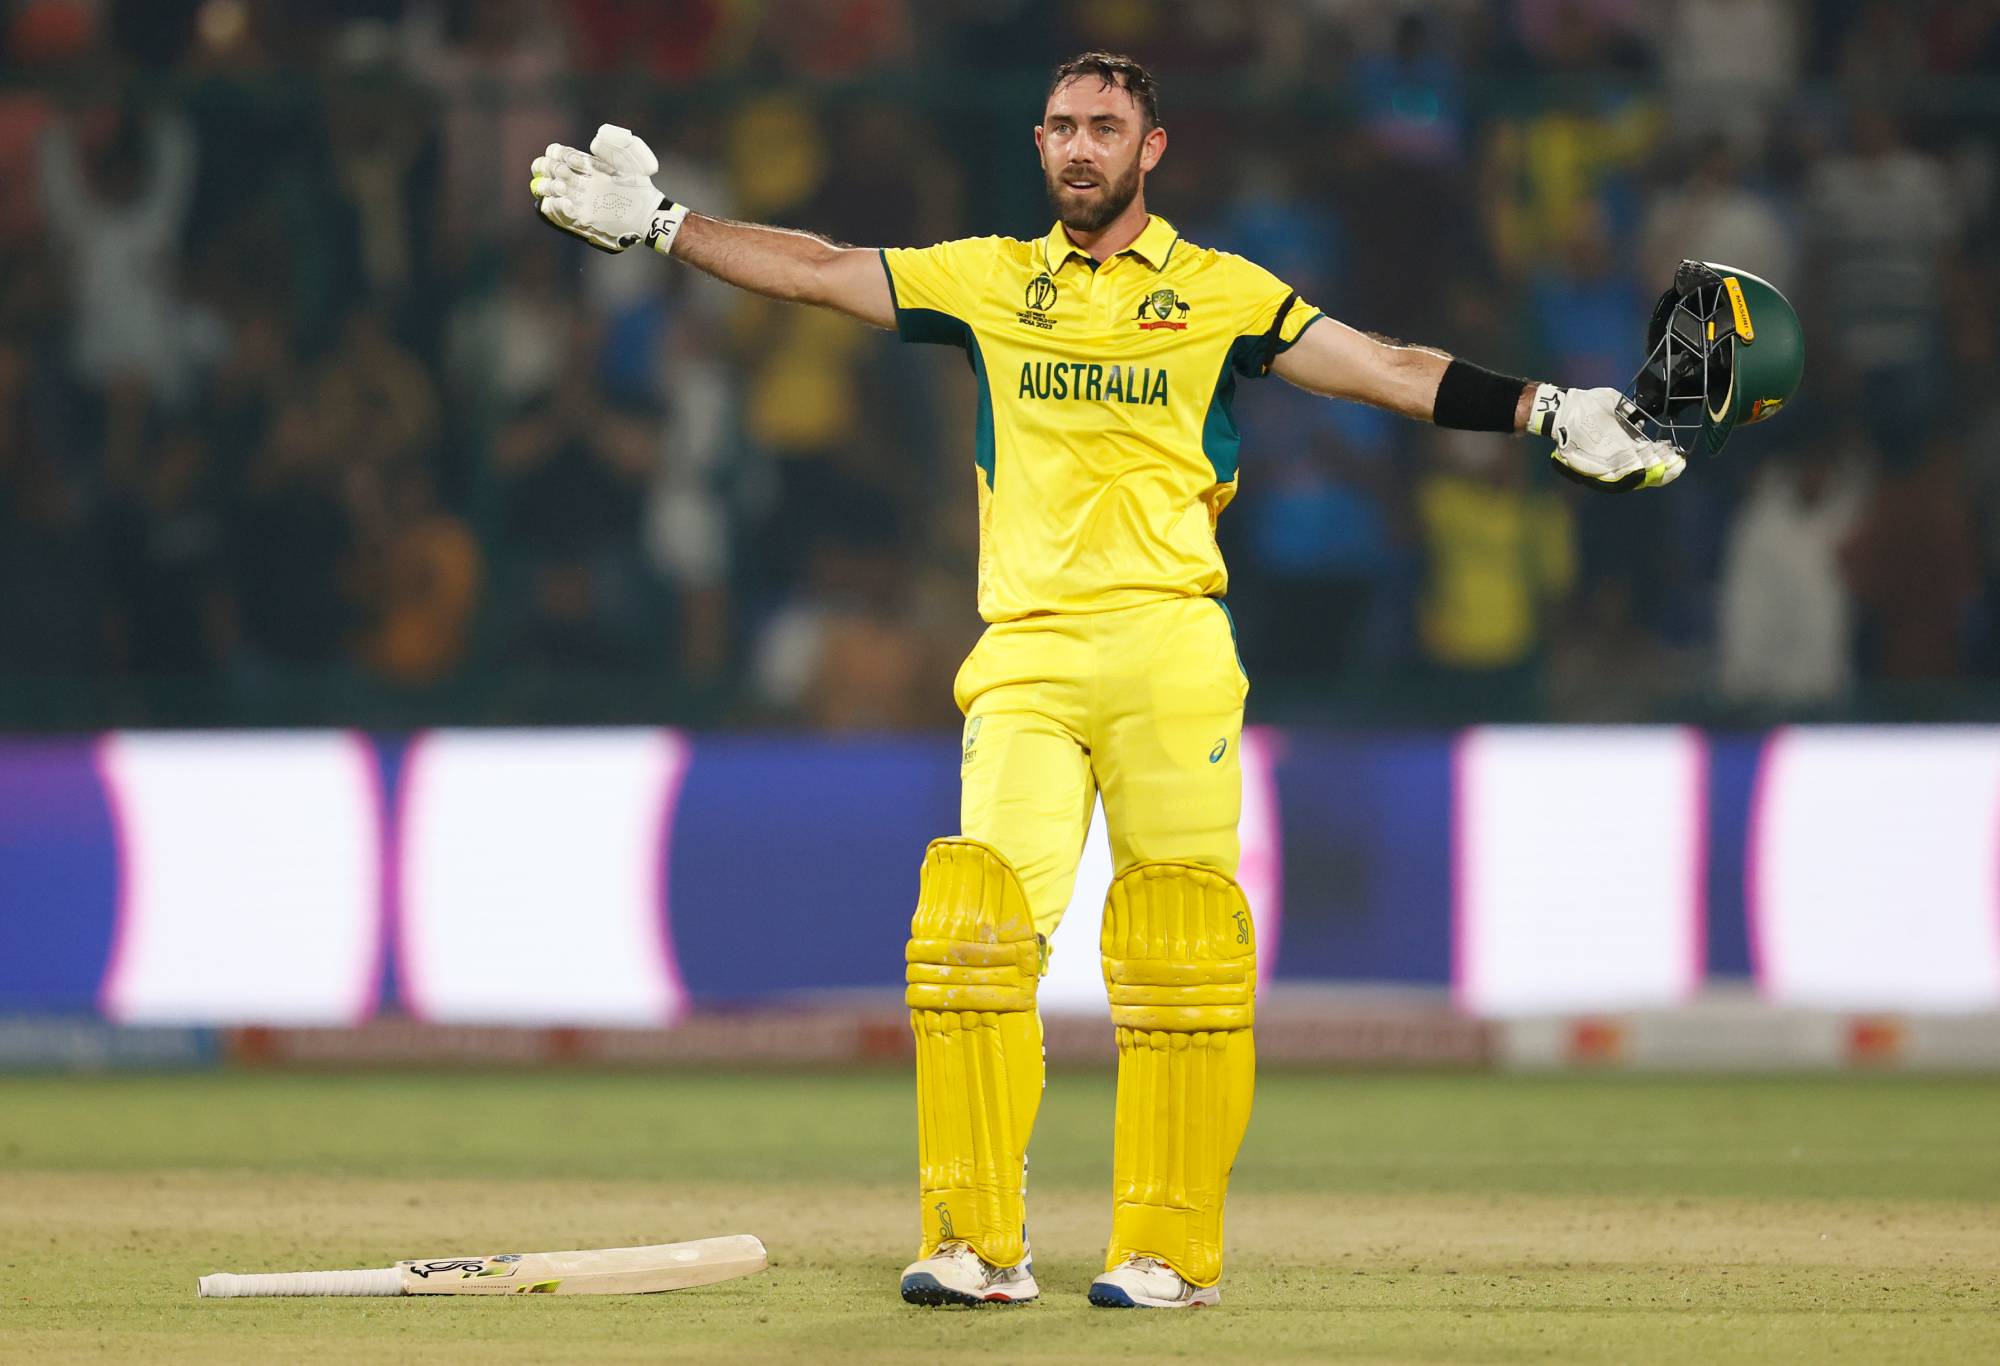
Glenn Maxwell of Australia celebrates their century during the ICC Men’s Cricket World Cup India 2023 between Australia and Netherlands at Arun Jaitley Stadium on October 25, 2023 in Delhi, India. (Photo by Darrian Traynor-ICC/ICC via Getty Images)
I don’t have the expertise to debate the pros and cons of this formula in detail, but it has gained a stamp of approval from Finlay’s fellow cricket statisticians after he showed them some modelling. It instinctively seems to do a good job of weighting both factors. It is hard to regularly score very quickly with a very low average: only West Indies’ Andre Russell – average 27 – has scored faster than Maxwell over a sustained period. Likewise if you scored really slowly – say at 60/100 – while averaging 60 or more, you would make it harder for your team to amass a big score and would probably get dropped.
Adjusting for Era
The other key question in comparing players from different eras is that, unlike Test cricket, ODI batting and bowling stats have changed in a big way since the first one-dayer in 1971, for three main reasons:
- much bigger bats with bigger sweet spots hitting the ball harder and further since the 2000s;
- smaller boundaries from the 90s; and
- the use of two new balls since 2011, which makes scoring at the end of an innings easier.
To illustrate, if we divide the history of ODI cricket into four periods, the average runs per wicket and the average scoring rates have gone up a lot:
| ODIs – Batting Impact adjusted for Era * | ||||||||
| Rank | Player | Span | Matches | Average | Average Era Adjusted | Scoring Rate | S/R Era Adjusted | Batting Impact |
| *Matches among 9 major nations only: Aus, Ban, Eng, Ind, NZ, Pak, SA, SL, WI | ||||||||
| 1 | Viv Richards (WI) | 1975-1991 | 185 | 47.2 | 50.8 | 90.1 | 99.3 | 71.0 |
| 2 | Zaheer Abbas (PAK) | 1974-1985 | 61 | 47.8 | 52.2 | 85.0 | 95.4 | 70.6 |
| 3 | AB de Villiers (SA) | 2005-2018 | 205 | 54.4 | 53.0 | 100.0 | 92.3 | 70.0 |
| 4 | Virat Kohli (IND) | 2008-2023 | 273 | 58.6 | 55.9 | 93.8 | 83.5 | 68.3 |
| 5 | Michael Bevan (AUS) | 1994-2004 | 208 | 53.8 | 55.6 | 73.7 | 75.3 | 64.7 |
| 6 | Mike Hussey (AUS) | 2004-2012 | 178 | 49.0 | 49.2 | 86.9 | 83.1 | 63.9 |
| 7 | Clive Lloyd (WI) | 1973-1985 | 85 | 39.5 | 43.3 | 81.2 | 91.3 | 62.9 |
| 8 | MS Dhoni (IND) | 2004-2019 | 334 | 49.9 | 48.4 | 87.4 | 80.5 | 62.4 |
| 9 | Greg Chappell (AUS) | 1971-1983 | 74 | 40.2 | 44.5 | 75.7 | 86.0 | 61.9 |
| 10 | Rohit Sharma (IND) | 2007-2023 | 243 | 48.7 | 46.6 | 91.8 | 82.1 | 61.9 |
| 11 | Sachin Tendulkar (IND) | 1989-2012 | 411 | 43.2 | 44.3 | 85.2 | 85.8 | 61.6 |
| 12 | Andrew Symonds (AUS) | 1998-2009 | 180 | 40.0 | 40.8 | 92.8 | 91.9 | 61.3 |
| 13 | Matthew Hayden (AUS) | 1993-2008 | 145 | 44.1 | 45.8 | 78.5 | 81.9 | 61.2 |
| 14 | Dean Jones (AUS) | 1984-1994 | 161 | 44.4 | 47.0 | 72.5 | 78.8 | 60.9 |
| 15 | Babar Azam (PAK) | 2015-2023 | 95 | 54.0 | 49.3 | 88.6 | 75.0 | 60.8 |
That is, batting averages have increased by about 15 percent and scoring rates by 25 percent since the 1970s and 80s. The average completed total has risen from under 220 in the early 1980s to about 270 since 2011.
Therefore, in calculating batting and bowling impact for top ODI players, I have adjusted the numbers to take account of these changes over time. I do this by finding the percentage difference between the numbers for the period in which the batter or bowler played and the median of the four eras above. I then and add or subtract or add that percentage from/to their average, scoring or bowling economy rate.
For example, Virat Kohli’s average of 58 is reduced by 5 percent to 55.7, which is the percentage. difference between average runs per wicket in the period since he debuted in 2008 (32.15) and the median average per wicket over the entire history of ODIs (30.74). His scoring rate is reduced 11 percent from 93.8 to 83.5. Batters from earlier eras like Viv Richards and Greg Chappell see their figures boosted a few notches.
Best Ever rankings
So here is my list of the leading ODI batters, measured by era-adjusted Batting Impact. I made a minimum qualification of 50 ODIs and a career of seven years to ensure a decent spread of opponents and conditions for each player. I have also confined the figures to matches between the nine countries that have ranked as serious Test teams over extended periods (see note to table): official ODI stats have become degraded by the inclusion of ODIs between all sorts of associate members.
For example, sitting on top of the all-time ODI batting averages with 67 is Ryan ten Doeschate of the Netherlands, who played only 8 of his 33 ODIs against tier one teams as opposed to minnows like Scotland, Bermuda, Ireland and Kenya. This also means Maxwell’s amazing centuries against Afghanistan and the Netherlands aren’t included. That might seem a bit unfair in the case of Afghanistan, but it would be inconsistent and time consuming to do otherwise.
| Averages and Scoring Rates in ODIs over time | |||
| Era | Average | Runs per over | Average complete innings |
| 1971-1990 | 28.4 | 4.3 | 217 |
| 1991-2000 | 29.4 | 4.6 | 230 |
| 2001-2010 | 30.3 | 5.0 | 248 |
| 2011-2023 | 32.5 | 5.4 | 272 |
The top four – Richards, Zaheer, De Villiers and Kohli – stand out as a cut above the rest. The ranking confirms my suspicion that Viv Richards’s record in the 70s and 80s is as good or better than Virat Kohli’s when adjusted for era. De Villiers just edging out Kohli isn’t such a surprise when you consider his fast scoring.
Pakistan’s Zaheer Abbas may be unfamiliar to some, but his average and strike rate stand out in the first decade of ODIs, only just behind Richards. Zaheer was a bit of a home track bully: his 59 batting average at home was 20 points higher than his away average – almost exactly the opposite of both Richards and Greg Chappell. But even if we doubled the weighting for home games, he’d still come third, between ABdV and Kohli. And he averaged 50 across 14 World Cup matches.
Greg Chappell’s presence in the top ten is a bit of a surprise as he was more renowned as a Test batsman and his ODI career best known for ordering his brother Trevor to bowl the final ball underarm against the Kiwis in 1981. West Indian great Clive Lloyd won fame for his 102 off 82 balls to help win the first World Cup final against Australia in 1975. While that was his only century in 87 ODIs, he did average 44 @ 85 in 11 World Cup innings.
The next fifteen batters making up the top 30 sit within such a narrow band on the Batting Impact scores – between Klusener at 60.7 and Root on 57.7 – that it’s hard to claim these are significant differences. They are in order:
16. Lance Klusener 17. Shreyas Iyer 18. Jos Buttler 19. Hashim Amla 20. Quinton de Kock 21. Virender Sehwag 22. Adam Gilchrist 23. David Warner 24. Faf du Plessis 25. Jonny Bairstow 26. David Miller 27. Ricky Ponting 28. Gordon Greenidge 29. Ross Taylor 30. Joe Root.
Many will be surprised that Tendulkar doesn’t rank in the top ten. It’s partly because eliminating games against minnows lowers his average and scoring rate a couple of points. Tendulkar made ten of his 59 ODI centuries against minnows – Zimbabwe, Kenya and Namibia.
Maxwell’s amazing strike rate of 121 against the better nations, which comes down to 105 after adjusting for era, helps put him at 37th with a Batting Impact of 56.6, fractionally behind Travis Head, Ben Stokes and Michael Clarke and just ahead of Steve Smith, Kumar Sangakkara and Kane Williamson.
If we removed the minimum qualification of seven years and 50 matches against top tier sides, some current players would feature near the top of the table: Shubman Gill (39 matches since 2019) would rank fifth, Heinrich Klaasen (43 matches since 2018) would be inserted at sixth, and Rassie van der Dussen (2019-) ninth ahead of Lloyd and Dhoni. That would give the current Indian team the batters ranked 4, 5, 13, 20th and 39th (KL Rahul) all time. If we leave out Klaasen and co, Australia’s World Cup winners are placed 23 (Warner), 33 (Head), 37 (Maxwell), 41 (Smith) and 48 (Marsh), with Marnus well out of the picture.
Conclusions
Rohit Sharma is the only opener in the top ten. In selecting a top six for an all-time team we might need to bring in another opener from outside the top ten, such as Tendulkar, or open with Kohli, e.g. a top order of Sharma, Kohli, Zaheer, Richards, de Villiers and Dhoni, assuming we need a keeper in the top 6. But maybe players with even higher adjusted scoring rates like Sehwag (102/100) or Gilchrist (97) should be considered at the top for the best mix, and maybe the likes of Lloyd (92) or Klusener (91) at no. 6.
Any thoughts on the method and the relevance to picking fantasy teams are most welcome. The only big answer for me was to support the idea that Viv Richards and AB de Villiers rank near the top. Quantity of runs and centuries shouldn’t trump quality, although it’s worth also looking of the performances of players like Kohli in steering their team to victory.
Another layer that could be explored is peak performance – focusing on a batter’s best ten consecutive years, for example, as those with very long careers can be disadvantaged. Richards would still comes out on top, as he had a significant downwards turn in his last few years. Sharma would jump up to 5th and Dhoni and Tendulkar to 7th and 8th if we only took their best ten years, while Tendulkar moves to 6th if we just count the 142 matches he opened the batting from 2001-11.
In a (hopefully briefer) Part 2, I’ll cover the Bowling Impact rankings, all-rounder ratings and look at a possible best-all-time Paper XI, and how the best World Cup sides compare. To which, some will say – “who cares, Australia won! Again!”
The Knightwatchmen who say Nii
Roar Rookie
G’day Shire The book I published back in June has 24 chapters altogether and the last of those is a token look at one day cricket, both Australia’s best batsmen in this shortened form of the game since its inception in early 1971 as well as a fairly top 10 of non-Australian batsmen. I use eight criteria and then a flattened-out percentage quotient above peers on the same list. The first criteria is to fuse together the average and strike rate, but the benefit of red ink is eliminated which inevitably means only considering the section of players’ career in which they batted in the top 4 in the order – a useful cameo of 9 off 5 balls coming in during the 48th over will inaccurately drive an average downwards as much as a cool 19 not out in similar circumstances will bloat it (the average). Michael Bevan is the exception, and he required an extensive, pain staking sifting through and eliminating all innings at 5 and 6 in which time remaining in the innings was insufficient for him to realistically hope to reach 50. Even for the 50s, the same had to be done regarding conversion to centuries. In order to arrive at the fusion for each player, a par strike rate specific for the time frame in which he played has to be worked out and in chronological order the Australian par strikes are: Greg Chappell 69.0, Dean Jones 70.0, Mark Waugh 71.4, Michael Bevan 74.7, Adam Gilchrist 77.0, Ricky Ponting 78.0, Matthew Hayden 79.0 and Steve Smith, David Warner and Aaron Finch all 80.0. The other criteria are innings per 50+ score, conversion %, innings per 100+ score, % of centuries overseas, number of countries (apart from own) centuries were scored in, % of centuries in successful run ‘chases’ and the average % above par target whenever such tons were scored. As with batting strike rates, par scores for teams batting first had to be personally individualised according to the specific time frame each player was active, and those same 10 Australian players are as follows: Greg Chappell 200, Dean Jones 210, Mark Waugh 229, Michael Bevan 234, Adam Gilchrist 243, Ricky Ponting 245, Matthew Hayden 247, with Smith, Warner and Finch all 275. When considering a player’s worth batting second, all innings in which the target was below these numbers are not considered, unless the team lost more than 7 wickets in the ‘mop up’. To cut a long story short, the final % quotient above the same peers are as follows: Mark Waugh and Bevan both 57.6, Warner 51.4, Smith 46.4, Finch 45.8, Ponting and Gilly both 37.5, Greg Chappell 29.7, Hayden 22.9 and Jonesy a mere 2.8. However, those quotients are not the whole indisputable gospel truth, as it has to, ultimately, come down to deeds of class. For example, Dean Jones’s world cup record was nothing special, and he was mostly inept at chasing legitimate targets above the par 210 for his era. Other virtual non-chasers from that list are Hayden, Finch and Warner. Another thing we can point out about Warner is that none of his world cup centuries have been at the sudden death stages of tournaments, all of them in the group stage, and often beating up badly on minnows, and even those late in the aforementioned group stage invariably come after Australia has already assured itself of a place in the playoffs. Typical Hayden hype will focus on his three centuries in the 2007 World Cup, but given Australia were completely invincible at the time, and most of the rest not as strong as some other eras, failure in a couple of those innings would not have greatly jeopardised Australia’s prospects for the rest of the tournament. Those are just some examples, and the % quotients for the top 10 non-Australian batsmen (only until 2010) using the same eight previously outlined criteria are: Gordon Greenidge 59.0, Sachin Tendulkar 58.3, Zaheer Abbas 57.6, Saeed Anwar 54.2, Viv Richards 48.6, Kumar Sanggakara, Virenda Sehwag and Desmond Haynes all 45.1 and Brian Lara 39.6. It takes little imagination to think that all four of AB de Villiers, Rohit Sharma, MS Dhoni and Virat Kohli would give those same criteria a damn good crack, but all other players who were anybody up until their era were tested against the criteria to come up with the final list, with the exception of Javed Miandad because he would have required the same innings by innings analysis as the one done for Michael Bevan due to his same ‘finisher’ attributes on show, often at 5 or 6 in the batting order.
BigGordon
Roar Rookie
No, I thought the timing of the piece was right because it demands time to read and understand. It would have got lost for sure in the chaos that was the back end of the Cup. I also think you shouldn't be too concerned about the length, as long as the article maintains reader interest. This one did, no problems, because you introduced a new concept, a new way of comparing eras and came up with some interesting results. Very much looking forward to the bowling comparison now.
DaveJ
Roar Rookie
Very kind, thanks. Yep, my memory worked the same way. I think the thing is there have been so many of these ODIs at times (George Bailey played 80 from just 2012-16), and in Oz we rarely followed or had news about some of these series overseas, unlike many of the Test series. For example, I was quite shocked to find that I was hardly aware of the player who comes out second in the bowling rankings (in follow up article). Also, the differences between a lot of the players after top four or ten are very small, and might look a lot different if we focused on their best 8-10 years, as mentioned, or their performances in big tournaments or finals, where we often remember them from, or gave extra weight to performance away from home.
DaveJ
Roar Rookie
Thanks, Brett. The differences between some of the players in the top 50 are too small to be considered very significant without digging further. Waugh and Jayasuriya are both in the 45-55 bracket close to players like Herschelle Gibbs, J Kallis, Eoin Morgan and Desmond Haynes. Average either a bit low or slower scorers compared to peers (Kallis, Waugh and Haynes). Jayasuriya was equal third among openers on adjusted strike rates, with only Sehwag and Gilchrist well ahead. But he had a very long career (22 years), so might look a lot better if we just looked at his best ten years, for example. Great point about fielding. In ODI cricket some of the best fielders like Ponting would be worth a few extra points in the ranking. In baseball they have a statistic that measures total impact on the game including batting and fielding called Wins Above Replacement (WaR) – but it looks like you do need to be a rocket scientist to work out the algorithm.
DaveJ
Roar Rookie
Hi Shire, much appreciated. It’s possible to focus on World Cups and tournament finals like the old B and H Cups in Australia using the Cricinfo database. I’ll see if I can do that a bit more if there is space and time for the follow up article on best bowlers and best ever team/s. Even more than Tests, there have been so many of these ODIs at times (George Bailey played 80 from just 2012-16) that not all deserve equal weight. And I think we rarely followed or had news about some of these series overseas, unlike many of the Test series. I was quite shocked that I was hardly aware of the player who comes out second in the bowling rankings.
DaveJ
Roar Rookie
Very kind, BG. I’m glad it made sense. It was a bit long but hard to do get it across in a much shorter space. Maybe the timing would have been ideal during the Cup itself but might have got drowned out even more by the actual cricket!
DaveJ
Roar Rookie
— COMMENT DELETED —
Arcturus
Roar Rookie
Great article, makes a lot of sense. It pretty much confirms my very unscientific appraisal that no one was better than Viv Richards, that Kohli and de Villiers are almost as good, and that Australia has had no better one-day batting exponent than Michael Bevan. Plenty of big names that I thought would be there and aren't though, like Imzamam and the Waugh brothers, which just goes to show it's best not to rely on my faulty memory.
BigGordon
Roar Rookie
A really fine piece of writing Dave. These are the sorts of subjects that can be dry & boring or simply leave people completely confused, but I was able to understand the logic behind the comparative system used because you explained it very well. The nice thing is, there is now some basis for comparing players in a format that has undergone tremendous change since it first started. I get that it's not a perfect statistical model, but that would likely require a Cray computer to work out all the variables. At least us older fellas can now say to the younger brigade that Kohli & Tendulkar were great ODI players but Abbas and Richards were better - and here's why.
Brett
Roar Rookie
Very nicely put together. Of course any batsmen who played against the legendary West Indies quicks with a new ball will swear every run they scored should be scaled at x4, so David Boon is obviously the greatest of all time! I’m surprised Sanath Jayasuriya doesn’t jump up your ‘best 10 years’ rankings. It seemed at one point he was terrorising opening bowlers even more effectively than Gilchrist & Hayden. And someone please tell the Indian fans they’re completely correct – they had the better team on paper. But the only thing Aussies like more than a talented player is someone who looks deep inside when it’s crunch time and finds a new level of fight. That’s what was on display in the fielding in the finals, snuffing out Indian boundaries and suffocating them with pressure until even the unstoppable Kohli had a ball slip through.
DaveJ
Roar Rookie
Thanks Matth. Yes I think you’re right, I guess it’s about the sheer number of centuries they scored. I’d never focused on his stats before. Since doing this, I looked at who had done best in terms of “Batting Impact” (BtI) in each batting position, as a basis for selecting a best ever team. Turns out de Villiers had an astonishing average of 80 batting at 5 with S/R of 109, making an adjusted BtI of 89, which is ten points higher than the next best, which is Viv for both positions 3 and 4. Solely as an opener Tendulkar does very well, about level with Sharma as the best, with BtI ‘s of around 65.
DaveJ
Roar Rookie
Excellent points, some of which I was going to touch on, especially the 60 (and 55 overs) games, but left out for length reasons. (Even so, I was told article as is was initially rejected as too long: it’s 1600 words plus the table, so you can imagine my reaction to that in terms of consistency.). The 60 over games had slow scoring rates, but didn’t seem to improve averages. But I wonder should they be treated the same way as 50 over games? Not sure. I don’t know whether anyone has looked at whether differences in field restrictions made much difference to scoring - everyone was pretty cautious until the Sri Lankans. I didn’t look up about more bouncers allowed - I think they were, which could make it tougher going against the likes of Garner & co. Had forgotten about 10 am starts, great point. On reflection, it may be a bit unfair to adjust for the really big jumps in averages scoring rates over the last decade, much bigger than the previous increases: some of that must come down to the extent to which T20 means there is a lot more skill at big hitting, it’s not just the bats. But it’s very hard to factor that in for every player.
Shire
Roar Rookie
Fantastic article. Some of the stats boffins on here have looked even more in-depth into things like this, figuring out if players performed when it really mattered by removing dead rubbers from Test records, etc. This would require even more work, but I'd be interested to see how some of the best players performed when you only take into account live series, world cups and that sort of thing. It's probably a bit harder with ODIs since there are so many meaningless bilateral series - just look at the ODIs we played against England after the T20 World Cup as a prime example. So it begs the question of what is considered "meaningful", but I'd love to see you take a crack at it.
Rowdy
Roar Rookie
I was thinking of something like this today. Then read it. Fabulous work DJ.
All day Roseville all day
Roar Guru
Reflecting further on other early playing conditions that might have impacted individual statistics, even slightly- 60 overs per innings, 12 overs per bowler red balls more bouncers allowed ? no fielding restrictions, and subsequently a minimum number of fielders in catching positions no play under lights, and as a result predominantly 10am starts greener pitches, compounded by 10am starts on pitches that had sweated under covers no flat drop-in pitches often poor lighting, when it was introduced
matth
Roar Guru
Good stuff DaveJ. It’s an odd thing to say but ABDV is underrated as a white ball cricketer, mainly due to the Indian obsession with comparing Tendulkar to Kohli.
All day Roseville all day
Roar Guru
:thumbup: :thumbup: :thumbup: