It is hard enough doing stats previews for State of Origin games without a fullback being ruled out and the replacement being a mystery. When a winger then reportedly dislocates his finger, things get even harder.
Queensland Coach Kevin Walters has now come out to clear up the mystery. Michael Morgan will go into the number 1 jersey, with Bronco Anthony Milford going into the bench utility role.
More State of Origin 1
» Six talking points from New South Wales’ Game 1 victory
» NSW WIN! Baby Blues too good for Queensland at the MCG
» As it happened: Re-live Origin 1 with our live scores and blog
» WATCH: Josh Addo-Carr scores an unbelievably good try to seal the result
» WATCH: Tom Trbojevic’s superb high-flying try
While Milford has only played one Origin game, he isn’t a virgin. This means that the Maroons will still only have three debutants to the Blues eleven.
If Dane Gagai is ruled out with his finger injury, then the good money is on Kalyn Ponga going onto the wing.
So how do the sides match up?
Let’s look at every damn factor because too many stats is never enough!
Runs and metres: Advantage New South Wales
These stats will be vital to who wins and the Blues are clearly on top here.
| NSW | Runs | Metres | QLD | Runs | Metres |
| James Tedesco | 15.5 | 170 | Michael Morgan | 7.1 | 56 |
| Tom Trbojevic | 14.1 | 140 | Valentine Holmes | 10.9 | 118 |
| James Roberts | 8.6 | 78 | Greg Inglis | 11.7 | 105 |
| Latrell Mitchell | 6.8 | 74 | Will Chambers | 11.2 | 94 |
| Josh Addo-Carr | 10.6 | 116 | Dane Gagai | 13.3 | 113 |
| James Maloney | 5.3 | 54 | Cameron Munster | 9.8 | 86 |
| Nathan Cleary | 7.8 | 59 | Ben Hunt | 4.1 | 35 |
| Reagan Campbell-Gillard | 10.1 | 91 | Dylan Napa | 9.3 | 80 |
| Damien Cook | 7.5 | 94 | Andrew McCullough | 4.5 | 41 |
| David Klemmer | 17.8 | 169 | Jarrod Wallace | 12.8 | 108 |
| Tyson Frizell | 10.2 | 96 | Gavin Cooper | 9.1 | 67 |
| Boyd Cordner | 12.4 | 108 | Felise Kaufusi | 7.7 | 66 |
| Jake Trbojevic | 13.4 | 117 | Josh McGuire | 13.3 | 122 |
| Jack de Belin | 10.8 | 93 | Anthony Milford | 6.8 | 62 |
| Paul Vaughan | 13.4 | 126 | Josh Papalii | 13.3 | 119 |
| Tyrone Peachey | 10.8 | 101 | Coen Hess | 11.8 | 92 |
| Angus Crichton | 15.3 | 119 | Jai Arrow | 15.5 | 141 |
| Total | 190.4 | 1805.0 | 172.2 | 1505 | |
| Forwards | 111 | 112.6/1013 | Forwards | 10.8/97.3 | 93/836 |
| Backs | 79.5 | 99/792 | Backs | 9.3/75 | 83.6/669 |
An average of 18 extra runs a game and 300 extra metres is match-winning. Jai Arrow is Queensland’s biggest metre eater and he’s on the bench. The Blues have nine players who average over 100 metres a game, the Maroons just seven.
It’s hard to see how David Klemmer was a late call-up given his prodigious work rate. He might not have an offload but he packs a punch and just keeps coming.
I’m surprised that Dylan Napa got a run; averages of 80 metres and under ten runs a game ain’t exactly Origin standard. The Maroons are bargaining that his mongrel will make up for his failings. It’s a big gamble.

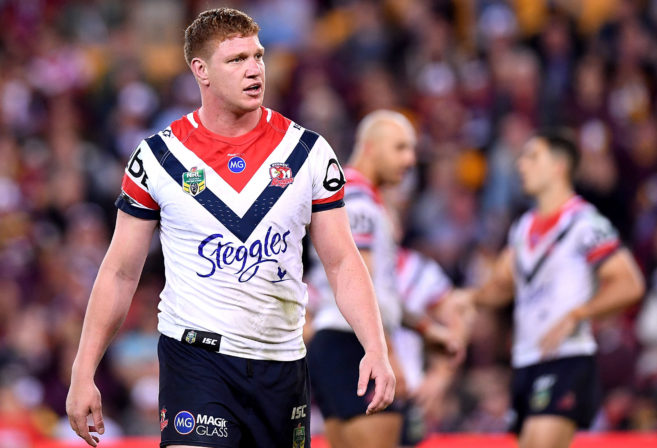
(Photo by Bradley Kanaris/Getty Images)
Age, weight and minutes in the legs: Advantage Queensland – just
Not much difference here. The weight of both sides is almost identical. Further, NSW have just a pinch more minutes in their legs. The only real difference here is that the NSW backs are on average three years younger than the Queenslanders.
| NSW | Age | Minutes | Weight | QLD | Age | Minutes | Weight |
| James Tedesco | 25 | 80 | 96 | Michael Morgan | 26 | 80 | 92 |
| Tom Trbojevic | 21 | 80 | 102 | Valentine Holmes | 22 | 80 | 85 |
| James Roberts | 25 | 79.1 | 93 | Greg Inglis | 31 | 76.6 | 105 |
| Latrell Mitchell | 20 | 78.6 | 104 | Will Chambers | 30 | 80 | 100 |
| Josh Addo-Carr | 22 | 79.7 | 86 | Dane Gagai | 27 | 80 | 91 |
| James Maloney | 31 | 80 | 83 | Cameron Munster | 23 | 80 | 89 |
| Nathan Cleary | 20 | 72 | 92 | Ben Hunt | 28 | 77.2 | 87 |
| Reagan Campbell-Gillard | 24 | 53.7 | 115 | Dylan Napa | 25 | 49.8 | 109 |
| Damien Cook | 26 | 79.3 | 86 | Andrew McCullough | 28 | 75 | 90 |
| David Klemmer | 24 | 54.8 | 116 | Jarrod Wallace | 26 | 46.7 | 108 |
| Tyson Frizell | 26 | 74.4 | 108 | Gavin Cooper | 32 | 80 | 108 |
| Boyd Cordner | 26 | 76.1 | 102 | Felise Kaufusi | 26 | 78.3 | 112 |
| Jake Trbojevic | 24 | 76.8 | 107 | Josh McGuire | 28 | 63.6 | 106 |
| Jack de Belin | 27 | 56.8 | 107 | Anthony Milford | 23 | 80 | 90 |
| Paul Vaughan | 27 | 51.1 | 110 | Josh Papalii | 26 | 66.5 | 110 |
| Tyrone Peachey | 26 | 71.5 | 93 | Coen Hess | 21 | 75.4 | 110 |
| Angus Crichton | 22 | 79.8 | 102 | Jai Arrow | 22 | 56 | 101 |
| Total | 416 | 1223.7 | 1702 | 444 | 1225.1 | 1693 | |
| Forwards | 25.1/226 | 67/603 | 106/953 | Forwards | 26/234 | 65.7/591.3 | 106/954 |
| Backs | 23.75/190 | 77.6/621 | 93.6/749 | Backs | 26.2/210 | 79/634 | 92.25/739 |
Nathan Cleary is the youngest man in this match at the tender age of 20, Tom Trbojevic and Coen Hess will be the next youngest players on the field at 21. James Maloney at 31 and Gavin Cooper at 32 will be the oldest. Jimmy is four years the senior of the next oldest Blue, while Greg Inglis at 31 and Will Chambers at 30 make three Maroons in their 30s.
David Klemmer at 116kg will be the biggest unit on the field. Maloney at 83kg will be the lightest.
Tackles and missed tackles: Call it a draw
Queensland have a bigger tackling capacity but NSW miss fewer tackles.
| NSW | Tackles | Missed Tackles | QLD | Tackles | Missed Tackles |
| James Tedesco | 5.8 | 0.6 | Michael Morgan | 11.8 | 2.8 |
| Tom Trbojevic | 4.7 | 1.3 | Valentine Holmes | 2.6 | 1.6 |
| James Roberts | 12 | 1.2 | Greg Inglis | 7.5 | 1 |
| Latrell Mitchell | 8.8 | 1.4 | Will Chambers | 12.7 | 3 |
| Josh Addo-Carr | 4 | 0.7 | Dane Gagai | 14.9 | 3 |
| James Maloney | 11 | 5.8 | Cameron Munster | 16.8 | 2.3 |
| Nathan Cleary | 13.2 | 0.6 | Ben Hunt | 15.8 | 3.8 |
| Reagan Campbell-Gillard | 24.8 | 2.4 | Dylan Napa | 22.8 | 2.2 |
| Damien Cook | 38.8 | 2.2 | Andrew McCullough | 40.4 | 0.7 |
| David Klemmer | 20.6 | 1.3 | Jarrod Wallace | 23.2 | 1 |
| Tyson Frizell | 24.5 | 1.3 | Gavin Cooper | 26.3 | 2.2 |
| Boyd Cordner | 26.5 | 1.6 | Felise Kaufusi | 29 | 1.3 |
| Jake Trbojevic | 37.7 | 1.5 | Josh McGuire | 27.3 | 1.9 |
| Jack de Belin | 26.5 | 1 | Anthony Milford | 11.3 | 1.9 |
| Paul Vaughan | 22.8 | 1 | Josh Papalii | 23.2 | 1.3 |
| Tyrone Peachey | 12.8 | 2.1 | Coen Hess | 31.3 | 1.7 |
| Angus Crichton | 32 | 2.2 | Jai Arrow | 27.6 | 1.6 |
| Total | 326.5 | 28.2 | Total | 337.2 | 33.3 |
| Forwards | 28.2/254.2 | 14.5 | Forwards | 27.9/251 | 13.9 |
| Backs | 9/72.3 | 13.7 | Backs | 11.6/93.4 | 19.4 |
Queensland have five more missed tackles in them than New South Wales and they are in the backs. Freddie Fittler will be hoping Latrell Mitchell and James Roberts will expose those frailties. However, Queensland have a slightly higher tackling capacity, making 11 more tackles overall.
Look at Jimmy Maloney’s 5.8 missed tackles! I’m not sure I’ve ever seen a regular first grader with an average like that. His minders will have their work cut out for them, as will Ben Hunt’s. While not as bad as Maloney, he still misses 3.8 a game.
You can bet the Blues will target the six missed tackles of Dane Gagai and Will Chambers.
On the flipside, two great tacklers need to be pointed out. Andrew McCullough misses less than one tackle a match while averaging 40. That’s stellar. Nathan Cleary only missing 0.6 tackles a game as a 20-year-old in the halves is remarkable.
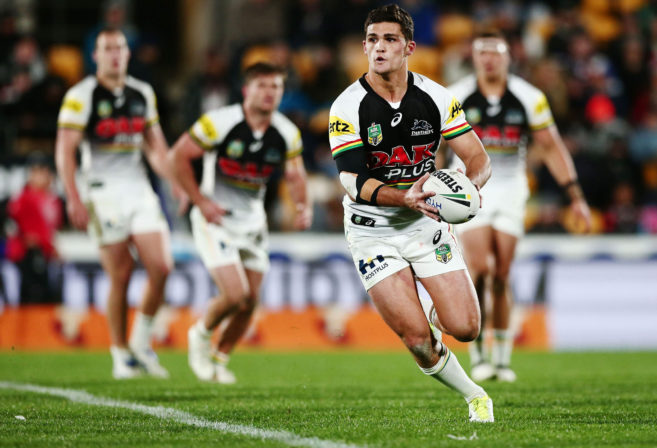
(Photo by Anthony Au-Yeung/Getty Images)
Did I mention how much I rate Jake Trbojevic? He’s pretty good. He’ll give old man Gavin Cooper some problems. In fact, I suspect that the ageing Cowboy has a target on him.
Attacking and scoring: Advantage New South Wales – by a lot
The attacking stats make great reading if you’re a Blues fan and grim reading if you are a Maroon-clad Queenslander.
| NSW | Tackle breaks | Line breaks | Try Assists | Tries | QLD | Tackle breaks | Line breaks | Try Assists | Tries |
| James Tedesco | 4.8 | 0.9 | 0.6 | 4 | Michael Morgan | 1.3 | 0.3 | 0.8 | 1 |
| Tom Trbojevic | 4.5 | 0.9 | 1 | 2 | Valentine Holmes | 2.1 | 0.7 | 0.1 | 11 |
| James Roberts | 3.4 | 0.5 | 0.5 | 6 | Greg Inglis | 1.8 | 0.4 | 0.3 | 7 |
| Latrell Mitchell | 4 | 0.7 | 0.2 | 6 | Will Chambers | 1.6 | 0.3 | 0.1 | 2 |
| Josh Addo-Carr | 4 | 1 | 0.2 | 12 | Dane Gagai | 3.1 | 0.2 | 0.3 | 1 |
| James Maloney | 1.6 | 0.2 | 0.8 | 2 | Cameron Munster | 2.7 | 0.3 | 0.8 | 1 |
| Nathan Cleary | 2.6 | 0.4 | 0.8 | 1 | Ben Hunt | 2.8 | 0.3 | 0.8 | 3 |
| Reagan Campbell-Gillard | 0.6 | 0.2 | 0.1 | 2 | Dylan Napa | 0.5 | 0.1 | 0 | 0 |
| Damien Cook | 3.4 | 0.8 | 0.3 | 3 | Andrew McCullough | 0.7 | 0.2 | 0.3 | 2 |
| David Klemmer | 1.3 | 0 | 0.1 | 0 | Jarrod Wallace | 0.8 | 0.1 | 0 | 2 |
| Tyson Frizell | 1.3 | 0.1 | 0 | 4 | Gavin Cooper | 0.4 | 0.4 | 0 | 4 |
| Boyd Cordner | 1.1 | 0.1 | 0.1 | 1 | Felise Kaufusi | 0.4 | 0.3 | 0.1 | 2 |
| Jake Trbojevic | 0.9 | 0.3 | 0.1 | 4 | Josh McGuire | 1.6 | 0 | 0 | 0 |
| Jack de Belin | 2.1 | 0.3 | 0 | 3 | Anthony Milford | 2.8 | 0.4 | 0.3 | 3 |
| Paul Vaughan | 1.4 | 0.1 | 0 | 2 | Josh Papalii | 2.1 | 0.3 | 0.2 | 2 |
| Tyrone Peachey | 3.4 | 0.3 | 0.3 | 4 | Coen Hess | 2.8 | 0.5 | 0 | 4 |
| Angus Crichton | 2.3 | 0.3 | 0.1 | 2 | Jai Arrow | 1.9 | 0.3 | 0 | 2 |
| Total | 42.7 | 7.1 | 5.2 | 58 | Total | 29.4 | 5.1 | 4.1 | 48 |
| Forwards | 1.6/14.4 | 2.2 | 0.8 | 21 | Forwards | 11.2 | 2.2 | 0.6 | 18 |
| Backs | 3.5/28.3 | 4.9 | 4.4 | 37 | Backs | 18.2 | 2.9 | 3.5 | 29 |
The Blues have 13 more tackle breaks in them than the Maroons. That’s a massive difference.
New South Wales have only one player – Jake Trbojevic (with 0.9) – who averages less than a tackle break a game. Queensland have five – Felise Kaufusi, Gavin Cooper, Jarrod Wallace, Andrew McCullough and Dylan Napa. Advantage NSW.
The Blues have an extra two line breaks in them a match. So much of this advantage comes from their back five who really look to have been selected due to their attacking credentials. Queensland will do well to hold them.
This all combines to see the Blues as a far more deadly attacking side as far as the statistics are concerned.
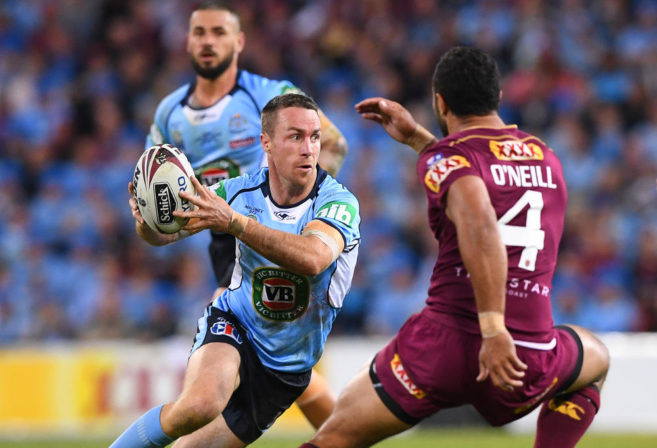
(AAP Image/Dave Hunt)
Miscreants and fumblers: Advantage Queensland
Queensland clearly have the edge here.
| NSW | Penalties | Errors | QLD | Penalties | Errors |
| James Tedesco | 0.2 | 1.8 | Michael Morgan | 0.3 | 1.3 |
| Tom Trbojevic | 0 | 1.5 | Valentine Holmes | 0.1 | 0.9 |
| James Roberts | 0.5 | 0.4 | Greg Inglis | 0.5 | 0.6 |
| Latrell Mitchell | 1.1 | 1.2 | Will Chambers | 0.6 | 1.4 |
| Josh Addo-Carr | 0.3 | 1.1 | Dane Gagai | 0.3 | 1.2 |
| James Maloney | 0.7 | 1.7 | Cameron Munster | 1.1 | 0.8 |
| Nathan Cleary | 0.6 | 1.2 | Ben Hunt | 0.7 | 0.7 |
| Reagan Campbell-Gillard | 0.8 | 0.3 | Dylan Napa | 0.9 | 0.2 |
| Damien Cook | 0.8 | 1 | Andrew McCullough | 0.7 | 0.4 |
| David Klemmer | 0.5 | 0.3 | Jarrod Wallace | 1.1 | 0.4 |
| Tyson Frizell | 0.8 | 0.5 | Gavin Cooper | 0.3 | 0.8 |
| Boyd Cordner | 0.3 | 0.5 | Felise Kaufusi | 0.2 | 0.6 |
| Jake Trbojevic | 1.4 | 0.4 | Josh McGuire | 0.9 | 0.1 |
| Jack de Belin | 0.8 | 0.5 | Anthony Milford | 0.5 | 0.9 |
| Paul Vaughan | 0.5 | 0.3 | Josh Papalii | 0.6 | 0.5 |
| Tyrone Peachey | 0.9 | 0.6 | Coen Hess | 1 | 0.5 |
| Angus Crichton | 0.9 | 1.4 | Jai Arrow | 0.5 | 0.2 |
| Total | 11.1 | 14.7 | Total | 9.9 | 11.5 |
| Forwards | 6.8 | 5.2 | Forwards | 6.2 | 3.7 |
| Backs | 4.3 | 9.5 | Backs | 4.1 | 7.8 |
This is the Maroons’ advantage. They give away fewer penalties and they make fewer errors. You can bet the Queenslanders will try and target debutant Latrell Mitchell and his propensity for making an error and conceding a penalty.
James Tedesco and Tom Trbojevic will also have a lot of play aimed at them and their errors. Note David Klemmer’s very low error and penalty rate for a bloke who runs the ball and tackles as much as he does.
The Will Chambers-Dane Gagai side of the field has more errors than anywhere else in the Maroons line, so a fair bit of traffic will be coming their way.
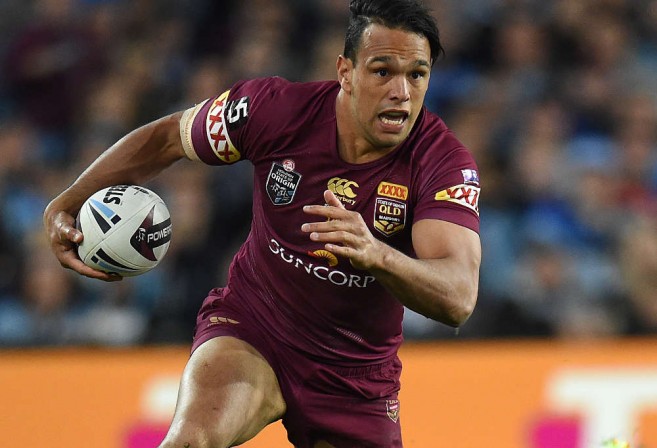
(AAP Image/Dean Lewins)
Experience: Advantage Queensland
When you select 11 debutants it is no surprise that the other team is better in this regard.
| NSW | Origin Games | QLD | Origin Games |
| James Tedesco | 4 | Michael Morgan | 8 |
| Tom Trbojevic | 0 | Valentine Holmes | 2 |
| James Roberts | 0 | Greg Inglis | 30 |
| Latrell Mitchell | 0 | Will Chambers | 7 |
| Josh Addo-Carr | 0 | Dane Gagai | 7 |
| James Maloney | 10 | Cameron Munster | 1 |
| Nathan Cleary | 0 | Ben Hunt | 1 |
| Reagan Campbell-Gillard | 0 | Dylan Napa | 3 |
| Damien Cook | 0 | Andrew McCullough | 0 |
| David Klemmer | 9 | Jarrod Wallace | 2 |
| Tyson Frizell | 5 | Gavin Cooper | 4 |
| Boyd Cordner | 9 | Felise Kaufusi | 0 |
| Jake Trbojevic | 3 | Josh McGuire | 8 |
| Jack de Belin | 0 | Anthony Milford | 1 |
| Paul Vaughan | 0 | Josh Papalii | 9 |
| Tyrone Peachey | 0 | Coen Hess | 2 |
| Angus Crichton | 0 | Jai Arrow | 0 |
| Total | 40 | Total | 80 |
| Forwards | 26 | Forwards | 23 |
| Backs | 14 | Backs | 57 |
Please note that 25 per cent of the Origin experience belongs to one player: Bowraville’s own Greg Inglis. Thirty of the 120 games of experience are claimed by GI.
But then when you look at NSW you’ll find that 70 per cent of their experience belongs to just three players: Maloney, Boyd Cordner and David Klemmer. They are the only Blues who have played in more than two series. There are six Queenslanders who have played in three series or more.
Leadership: Advantage NSW
How the worm turns. Last season Boyd Cordner was the inexperienced captain up against the leadership might of Cameron Smith, Cooper Cronk and Johnathan Thurston. This year he and Jimmy Maloney will be much happier facing Greg Inglis and Michael Morgan.
The most experienced Queensland forward is now Josh Papalii who has been a bench player for most of his nine Origin games. Still on the bench, he will need to step right into a leadership role if the Maroons are to prevail.
(Photo by Mark Kolbe/Getty Images)
The verdict
New South Wales have too much attacking prowess for Queensland and the stats clearly show it. They make more runs, metres, tackle breaks and line breaks, and they score more tries. They should win.
However, they could choke. There are so many debutants and the side has quite a few penalties and errors in them. If they get spooked, if things start going wrong, then the more experienced Queenslanders could grind them down.
But I don’t think that the Blues will choke. Instead, they’ll outclass the Maroons and expose a few of the Queensland selections as being not up for it.
New South Wales by 20
Some other stats of interest
(Note: 1997 stats not included due to split competition)
• This will be the eighth State of Origin match held in Melbourne. Queensland have won four to New South Wales’ three
• It will be the fourth match at the MCG. The Blues have won two of the previous three.
• It will be the third Game 1 in Melbourne, Queensland have won both to date.
– 1990 Game 2 NSW 12-6 Olympic Park,
– 1994 Game 2 NSW 14-0 MCG,
– 1995 Game 2 Queensland 20-12 MCG,
– 2006 Game 3 Queensland 16-14 Docklands,
– 2009 Game 1 Queensland 28-18 Docklands,
– 2012 Game 1 Queensland 18-10 Docklands,
– 2015 Game 2 NSW 26-18 MCG.
• Of the nine times that New South Wales have won Game 1 away from home, they have won six of those series (1985, 1986, 1993, 1996, 2003, 2014). However, in 1983, 1987 and 2017, they lost the next two games to lose the series.
• The last Game 3 held in Brisbane was in 2015. Queensland beat New South Wales 52-6, the record defeat for the Blues.
• Last season was only the fifth time either side has used the same 17 players for the entire series (Queensland 1987, Queensland 1988, Queensland 1995, NSW 1996, NSW 2017). In every instance, the side has won the series – except 2017.
• The 11 debutants in the NSW side is the most in an Origin team (excepting 1995 when the ARL excluded Super League players) since the NSW Game 3 side in 1994.
• The 14 total debutants is the most in an Origin game since the inaugural match in 1980 (except for 1995 when the ARL excluded Super League players).
Matt H
Roar Guru
Well done Tim. I don;t agree with your conclusion (well I can't can I) but it's all excellent info. Some comments: - forced dropouts and kick metres would be useful - as others have stated, the club stats are distorted by players playing in different positions in Origin. - regarding tries, does Josh A-C play outside of Will Chambers or is he on the other wing? If he plays outside the best positional centre in the game, that might explain his tryscoring. This leads to the other issue with club stats. how much depends on teammates, club combinations, coaching, game plans and roles, injuries to other key players, the draw for the first 10 rounds, etc, etc. But they are better than no stats and that is basically what you would have if you looked at previous Origin stats for these teams. So many unknowns, so much excitement.
The Spectator
Guest
Its all fun and stats till its origin!
Nat
Roar Guru
The difference is these guys haven't trained around/played off Smith leading into this. Macca cannot replace Smith but his service, kicking game and tackle rate is very good. He's not a makeshift hooker and arguably the most important player in the Broncos team for the last few years.
Mike Gordon
Roar Rookie
Hey Tim, have you thought about doing a stats on your stats previews?
Albo
Guest
Spot on ! I think there is only one meaningful set of stats associated with this SOO series 2018 : Over the past decade , how many matches have QLD won without Smith ? Without JT ? Without Cronk? Without Slater ? Without all 4 ?
Albo
Guest
Unless he is needed to kick on the 5th !
Chop
Roar Guru
Except they had an inch of rain yesterday and more this morning, that will make the surface slippery and reduce the mobility advantage of the NSW backline.
Griffo
Guest
And '95?
Forty Twenty
Guest
How do QLD go without Cameron Smith? His effect on the Storm seems to go well beyond the stats and this could be the case for QLD as well.
Austin Jones
Roar Rookie
lucky duck, enjoy the game Con, even though I'm only down the road in Geelong I'll have to watch it from home
The Barry
Roar Guru
Really interesting comments. I don’t know how you could get stats on line speed but you’re right it’s very telling. Similarly, you can’t get relevant stats for metres conceded and post contact metres conceded for selected hybrid teams like these but they’re critical to results. Looking at the stats for these games is an interesting comparison but you can’t base a final assessment on Origin success based on club stats. As you’ve noted Queensland have a 5/8 at fullback and 1.5 fullbacks on the wing. NSW has a fullback on the wing. Papalii, Crichton, JDB and Arrow are all 70 min or so players at club level but will be playing 30-50 minute impact roles here. How many metres and tackles, etc they make at club level aren’t great indicators of how they’ll go. Then there’s Peachey who’s predominantly played 5/8 this season and will be coming off the bench as most likely a middle third utility or back up hooker or injury cover. His NRL stats are almost irrelevant to how he performs in this game. Ditto Milford if selected.
The Barry
Roar Guru
You don’t get that things are jokes even when there’s smiley face emojis... How spoon fed and obvious do things have to be for you Petey? Let me know and I’ll dumb it down for you as much as I can...
tim
Guest
I will nitpick in ghost form in the future.
Graham
Guest
Question on your methodology: these numbers disagree with nrl stats. How did u get these numbers? Also a couple if quick suggestions. Tries should be divided by number of games. Second you should include line break assists and forced dropouts which are equally important. Line dropouts in particular are almost important as tries in origin. I'd also recommend separating the spine from the backs and forwards (that is have 3 categories). Finally there is a little apple and oranges comparison in the backs since fullback s tend to have different stats to centers and wingers and a few players are being played out of position. I did a stat analysis the other day using nrl stats and came to different conclusions (qld had a decent advantage in the spine) though 2 conclusions are similar: nsw had an advantage in meters gained and tries from outside backs. The metres gained is deceptive as it's easier to get 1v1s in the forwards at nrl level (also in game 1 last year qld had their defensive structure wrong and made a lot of 1v1s which is why they lost the forward battle). Lines are also slower and more misshapen at nrl level. At origin level tackles per game, line speed and errors are the key stats usually for who will win the forward battle. Unfortunately there are no stats for line speed. Qld are getting 4 extra sets per game not including line drop outs. That cancels out the metres gained and if their forwards get numbers in tackles that changes the metres gained equation again. Losing Gillett makes a difference here and Napa singlehandedly makes qlds stats worse. Assuming qld get their defensive structure right the forward battle will be more even than people realize. If Napa is replaced by Scott and Gillette replaces Cooper then advantage qld in contrast to punditry wisdom. Not understanding these subtleties has led nsw to deceive themselves into thinking they have had a forward advantage over the last 10 years when they haven't. With Napa and without Gillette it's difficult to tell before hand Nsw appear to have an advantage in the backs but some of that is due to an apples to oranges comparison. Qld have 2 specialist fullback s and 2 centres playing in the centre wing positions. Wingers get better tries and line break numbers than centres and fullbacks. Both have a fullback on the wing with qld making tested conversion but nsw making an untested conversion. Playing a 5/8 at fullback kills their meter stats but thats also deceptive. Morgan is qlds biggest risk. Even still where we can make an apples to apples comparison nsw centres have impressive stats. They are coming against Australian center pairing though so it will be interesting to see how that translates to origin Another thing qld halves have been great at is getting points when the match is on the line. This is a danger for Ben hunt who has had off games in big games so that's another risk for qld. Maloney has been weak in origin and Cleary is an unknown so this is another unpredictable contest
Peter
Guest
Thanks for the good read, Tim! :-)
Peter
Guest
You mean a NSWelshperson having a Phil Duke moment? PS: There's a fascinating article from 2009 on one-game players, written by a then Roar Rookie named Brett McKay.
Peter
Guest
Yeah, yeah, hilarious the first thousand times. Standard response: Peter Sterling.
Busty McCracken
Guest
As a sea eagles fan I respect this stance on 97 haha
thomas c
Guest
The stats are interesting, but there's only so much you can correct for. The QLD teams are having a rougher time of it (injury plagued, mismatched halves etc), so some of their numbers are in teams that are maybe disjointed. Some stats are probably more raw, and others are more a measure of the team. A trivial example might be James Roberts stats being in spite of his team. Other stats might be more about how the machine works. In honesty, I think the stats are probably representative. However, I'd have to hope that the QLD stats are somehow deflated by poor game plans or faulty team composition at club level. That or NSW somehow comes up with a plan that nullifies their own strengths (we're dealing with fairly green coaches on both sides). Let's be honest, with a lot of the QLD victories, it was more about NSW finding a way to lose then QLD finding a way to win. oh and we definitely need ref stats.
Big mick
Guest
Would love to see the stats on post contact meters and play the ball speed both of which I believe would heavily favor NSW. Whilst I expect NSW to win game I think a 6 to 12 margin more likely- I think the blow out comes game 2 once the combinations click. NSW can win game 1 simply through ruck domination/ quick play the balls and plenty of dummy half scoots including both wingers plus Peachy in the 2nd half....Plenty of offside penalties probably on offer with QLD not back the distance-I expect NSW to take the 2 in every instance.