What’s a magic number? Aside from a somewhat misused term, it’s the score from which a side’s chance of winning is better than fifty-fifty.
Amazingly, with all of the rule changes in the sport since its inception, the magic score has only moved slightly higher.
When the game began in 1908, tries were worth three points, while goals and field goals were worth two. There was no ten-metre rule, or even a five-metre one. There were no limited tackles until the mid-1960s, so for almost 50 years maintaining possession was king.
Then limited tackles came in, with the six-tackle rule first being used in the 1971 season. two years later, field goals were reduced in value from two points to one to put an end to teams taking endless pot-shots at two-pointers.
In 1983, the value of the try was increased from three points to four to promote more attacking play.
The early 1990s saw the introduction of a salary cap which helped even out the teams, as well as the introduction of the ten-metre rule. Then came constant tweaks to interchanges, which meant the game was now 17 versus 17 as opposed to 13 on 13 as it had long been in the first 50 years of the premiership.
All of these changes have had a dramatic impact on the game, making it more expansive and free-flowing, and also producing higher scores.
From 1908 until 1989 there had been 86 occasions where a team scored 50 points or more, which works out as being just a touch over one such score per season. However, from 1990 until Round 19 of this year, 2019, a score of 50 plus has been racked up 245 times, which is just over eight per year.
Only two scores under 19 have a success rate of more than half, those being 15 (52.69% of the time a team has scored 15 points in a game, they have been victorious) and 17 (68.02%). However, from 19 up, every score has a win rate of at least 59 per cent – therefore, 19 is the magic number.
Scores 18 and under have produced a win 26.46 per cent of the time. Shift to a score of 19 and over, and that number jumps to 84.72.
But how does this compare with the last 25 years?
The highest score with a win percentage of under 50 is the slightly higher 20, up from the 18 over the game’s entire history.
The notable difference here is that odd scores in this more recent period, no matter how small, have a significantly better success rate. A score of nine has won half of the time, 11 has won 80 per cent, 13 has 68.97 per cent success, 15 has an even better mark of 77.78, 17 has produced a winner 84.29 per cent of the time… you get the idea.
Twenty, though, is down from its overall historical success rate of 59.08 per cent to 47.37 over the last 25 years. No score higher than 20 has a winning percentage lower than 53.
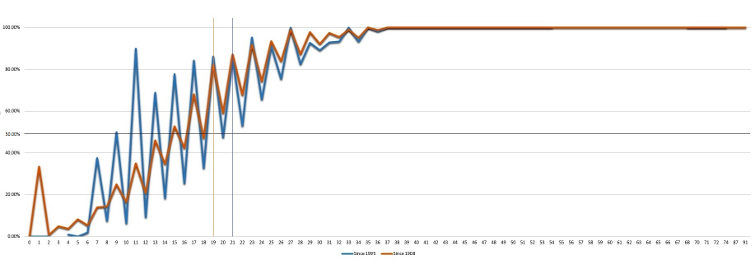
So we, in essence, have two magic numbers: 19 since the birth of the game and 21 in the modern version.

For absolute success certainty though, 37 is the magic number. No team has ever scored 37 points or more and lost a game.
Odd scores are also more successful than even scores, both overall and dramatically moreso in the last 25 years. From 1908, an odd-numbered score has won 55.89 per cent of the games it’s been involved in, while teams finishing on an even score sit at 46.81. Since 1995, the odd scores have jumped to an immense 87.67per cent success rate, while even numbers have remained virtually unchanged.
A team which kicks a field goal – or more than one – has ended up winning on 78.44 per cent of occasions since 1908. That increases further over the last 25 years to 87 per cent.


Nathan Cleary after nailing a field goal. (Photo by Mark Nolan/Getty Images)
This field goal phenomenon means that if a team can score over 18 points and kick a field goal, they are a 92.58 per cent chance of winning.
And as we know, 18 points plus a field goal is 19, making that the magic score.
Andrew Ferguson
Expert
Odd scores have an immensely high win rate since 1983, when the other scoring options (tries and goals) were both made even numbers (tries went from 3 points to 4, goals have always been 2 points) In the 75 years prior to that, it was just as easy to produce an even score as an odd one.
Flexis
Roar Rookie
Very interesting. Would’ve thought the rates would be both flatter and higher for the odd numbers in the 1990+ data. The clean percentage rate must mean 11 is the outlier due to sample size. But the difference between 13 and 19 really surprised me given they would typically reflect a very similar match situation.
Jacob
Guest
Reminds me of when the Titans beat the Storm, 38-36
Emcie
Roar Guru
Wouldn't odd scores have higher win rates by default though? Teams will only really go for a field goal if scores are tied or extremely close and they need it to win the game. So the highest win rate is achieved by being evenly matched with your opposition right at the business end of the game and then coming up with the winning play, but it's also risky because being evenly matched at the business end of the game and not coming up with the winning play would have a very low win rate (I assume). So in summery the best way to increase your win rate is to execute the winning play and not to lose the game by not doing that.
Nat
Roar Guru
And with that Tim Gore just messed himself.
Albo
Roar Rookie
Strewth Andrew ! What is your day job ?
Forty Twenty
Roar Rookie
No team has ever scored 37 and lost a game. Truly remarkable.
kk
Roar Pro
Amazing. 13,19 and 37 are my core #'s for Lotto. Looks as though I should add 15,17,20 and 21. Thank you Andrew.
matth
Roar Guru
Nice article. Odd scores certainly became more successful once points for a try went from 3 to 4.