Sports fans all around the world will often fall back on the competition ladder to determine who a better side is, or maybe even use it as a tie-breaker when trying to predict the winner of a close contest. But is it reliable?
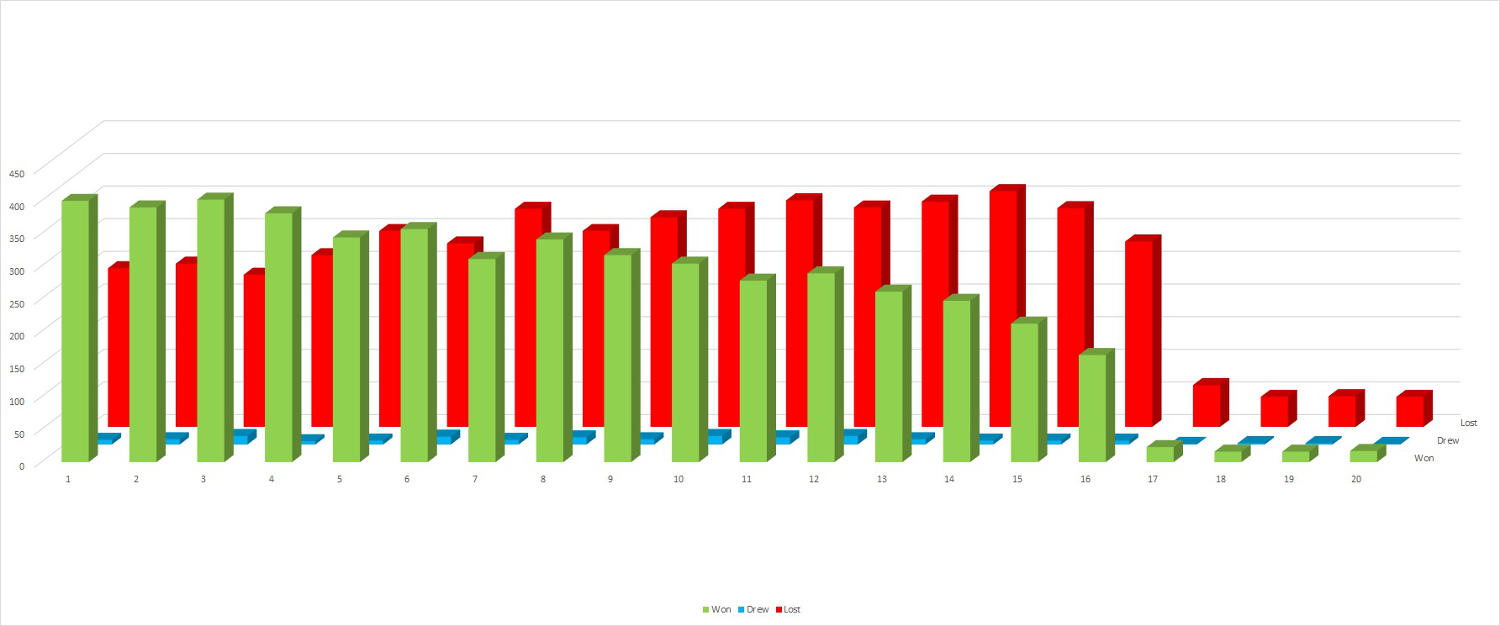
To some extent it is, given that first, second and third-placed sides on the ladder have a win rate of at least 60 per cent. However, it’s the third-placed sides who have the best success rate at 62.04 per cent of all games played from 1992 until the end of Round 21, 2019. The next best is first place at 61.54, followed by second place at 60.19.
There are only four more ladder positions that have won better than half of their games over this same period: fourth and fifth at 58.71 per cent, sixth at 54.92, fifth at 52.92 and eighth at 52.30.
This means that being in seventh place isn’t exactly conducive to success, as these sides have won 47.70 per cent of their games, which is also lower than ninth place, which has a 49.07 clip.
At the other end of the scale, it’s not surprising that 15th and 16th place have the lowest winning percentages. They are the only ladder positions to win less than four of every ten games in the 16-team structure. The few competitions that included more than 16 sides have ladder positions 17th to 20th all with win percentages under 27.
The interesting thing about these positional stats is the head-to-head figures. For example, first-placed sides have losing records against teams placed second and third. In fact, second place has beaten first place 61.22 per cent of the time since 1992.
As the above graph shows, success lands prominently with the teams in the top four. This would mean that sides who frequently appear in the top four on the ladder are the greatest chance of winning games.
It will come as no surprise that, since 2007, the Melbourne Storm dominate every other side for the total number of weeks spent, and winning percentage, inside the top four.
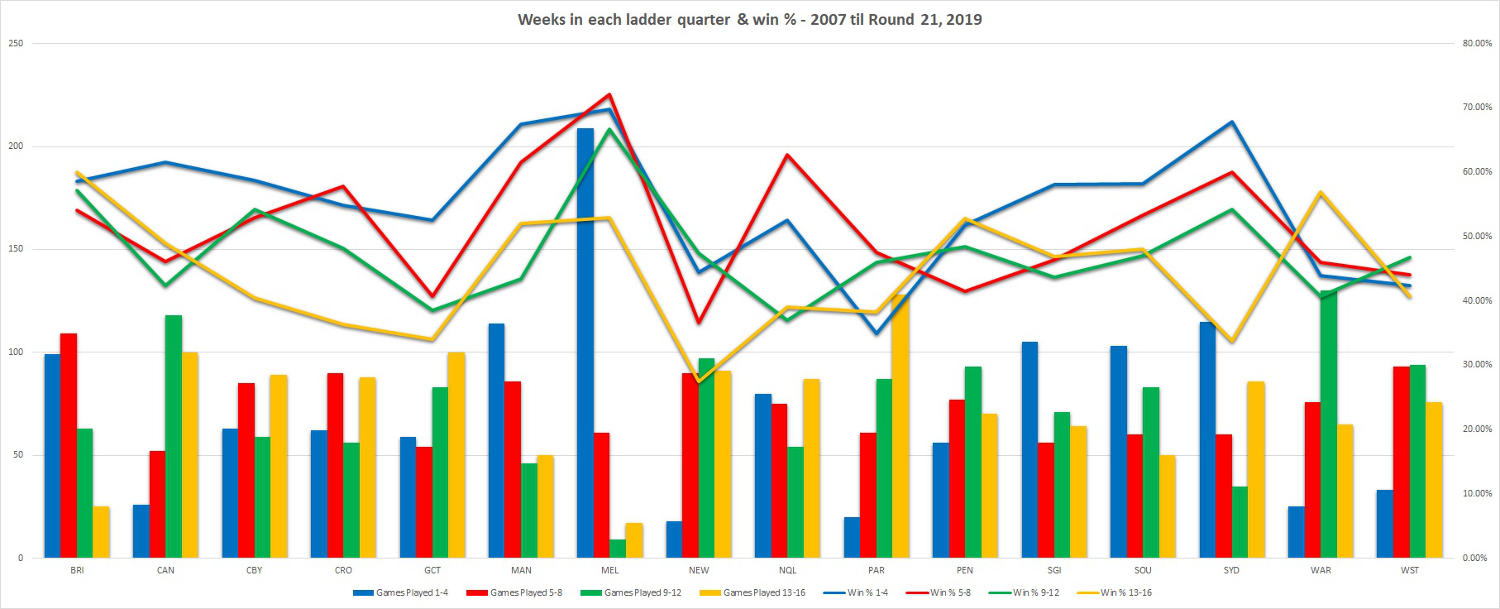
Brisbane appear in the second quarter of the table most (from places fifth to eighth). The Warriors, closely followed by the Raiders, are most prominently placed in the third quarter (from ninth to 12th place), while Parramatta have spent the most weeks in the bottom four places of the premiership ladder.
Using a ladder can be somewhat helpful to help predict who might win a game, but sometimes, it does depend on the club. Some sides perform at their best when they’re at the top of the ladder, like Melbourne, Manly and the Roosters, while others struggle, such as Parramatta, Newcastle, the Warriors and the Wests Tigers.
Teams like Newcastle, Wests Tigers and Penrith have a rather consistent record of loitering around the middle of the table. The Wests Tigers have their most success in this area, while in comparison, it is the Panthers’ least successful area.
So when it comes to trying to predict winners of a game, you can look at factors such as ladder position for both sides, success in those positions and the success rate of all teams in that position. With such an even competition, a lot of these figures are somewhat pronounced enough to be reasonably reliable.
How does this though translate to finals football, though? It will come as no surprise that the team who ends the season in first place has the best success rate in finals footy, winning 66.53 per cent of all games since 1908 and an even better 70.49 per cent in the NRL era (since 1998) – that’s if you discount the anomaly of the 1998 season, the only time a finals series consisted of more than eight sides.
1998 had ten teams make the finals and the ninth-placed Bulldogs made it all the way to the grand final, which means ninth place has the best win rate at 80 per cent.
Interestingly enough, the next most successful ladder position in the finals is sixth, at 50per cent since 1908. However, during the NRL era, it’s second (55.56%), third (52.54%) and fourth (50%) that are next best.
Fifth place has won just over a third of their games, the lowest of the top six and second-lowest of the top eight, bettering only eighth place, which has won 27.59 per cent.
If we were to apply the positional head-to-head stats from the NRL era to the current top eight (as at the end of Round 23) – we would have the following finals results:
Week 1
Sydney def Canberra
Souths def Brisbane
Melbourne def Manly
Cronulla def Parramatta
Week 2
Manly def Souths
Canberra def Cronulla
Week 3
Manly def Sydney (Both sides are even with four wins apiece in NRL era, however since 1908, fourth has won 26 games versus second’s 20)
Melbourne def Canberra
Grand final
Melbourne def Manly
Andrew Ferguson
Expert
Oh okay. I got no idea about that mate. Sorry. I can handle constructive criticism, in fact, I quite enjoy it, as it leads to decent discussion.
terrance
Guest
Hi Fergy, I only published ''go sydney'' after my “MSSCOTSC variable” article was not being published. It was published after 24 hours of trying. I think they were trying to protect your analysis till the article drifted down the list over the weekend.
terrance
Guest
Hi Fergy, I did put in ''amongst other minor variables'' which was that most clubs have had salary cap breaches at some stage, most minor, some more concerning, but none nowhere near as systematic as the Melbourne Storm where five years of the 27 years of your data is corrupted. The “MSSCOTSC variable” needs to be taken into account, most reputable statisticians would, or at least recognise that the finding you came up with contain such as variable.
Cugel
Roar Rookie
Slightly off topic, but it used to be the case that if Canberra played a preliminary final against lower ranked opposition, they'd get an away game whilst everyone else gets a home game. According to this, it seems to have changed, and we can get a home prelim. ?
Andrew Ferguson
Expert
The analysis is not useless. It has been used in conjunction with each clubs record to show how each team performs in each quarter of the table. You can discredit any statistical analysis in any area of life with all sorts of variables, variables which cannot be factored for or accounted for, variables which cannot be treated equally with other variables. So in the end, one can only analyse the raw data available. I intentionally write these articles with no commentary or opinion so that the reader can draw their own. If you are intent on not seeing any value in this article, then you never will. I can't convince you otherwise, nor will I try. That's your opinion, you're entitled to it and I respect it (even if I disagree with it) Thanks for the feedback and constructive criticism though mate.
Andrew Ferguson
Expert
There is a flaw in your theory though. Every club has breached the cap to varying degrees, more than once since the NRL era began in 1998. How is one supposed to determine how much of a win is made with a legally assembled side, or a side that is deemed legal, but has benefitted supremely from the cap cheating of the past?
Papi Smurf
Roar Rookie
That's the beauty of a running gag, CPB. It has a life of it's own and it never dies! :laughing:
Chris.P.Bacon
Guest
"....lost by 1 point in Golden Point extra time after missing 3 conversions and 2 field goal attempts during regular time..." ....hahaha, oh PS you've really got to let this go big fella! :)
Mycall
Roar Rookie
Terrance has a point (somewhere in his post). You can't just say you've done a statistical analysis. If you want the stats to mean something then you need to take variables into account. Others have already poked holes in the glaring inequality of the draw which means that your statistical analysis is effectively useless. In round 2 when the team coming first merely had the best win (or weakest 1st round opponent) is hardly a predictor for whether they should beat the the second placed team. Your finals predictions were basically just picking the favourites (based on ladder position) to win bar 1 match. You can do that and be wrong ~40% of the time... I'm sorry, but I don't see the point of this article.
Andrew Ferguson
Expert
Your only other comment on this article is "...go sydney" I'm open to discussion mate, share your opinion. Bear in mind, this is statistical analysis what I've written, not opinion.
terrance
Guest
hopefully now the truth will be revealed after several attempts... Hi Fergy, Interesting statistical analysis, my attitude is make the semi's then win all your games and you'll be the champs. But an important variable (amongst other minor variables) missing from your analysis is the well known "MSSCOTSC variable". Yes the Melbourne Storm Systematic Cheating Of The Salary Cap variable that damages statistical data between the known dates of 2006 to 2010, though many expect the "MSSCOTSC variable" may have started prior to this. The "MSSCOTSC variable" had many participates, Brian ''Wally'' Waldron, Matt ''Who Dobbed Us In'' Hanson, Paul "Fancy That'' Gregory, "Two contracts'' Cam, Greg ''Gift Voucher'' Inglis, Billy "Money Bags'' Slater, Peter ''Salary Cap?'' O'Sullivan, Cameron ''I didn't dob" Vale, et al., but despite the many, many, participants in the "MSSCOTSC variable", no one wants to take ownership of the "MSSCOTSC variable". In fact many participants involved in the "MSSCOTSC variable'' are still in the denial that "MSSCOTSC variable'' exists, despite acknowledgement of the "MSSCOTSC variable" by the Melbourne Storm owners on discovery of the "MSSCOTSC variable''. So if you take out all of the Melbourne Storm wins between 2006-2010 (86 regular season wins, not including the 10 final wins) re-do the finishing positions on the ladder and have the Melbourne Storm last on zero wins between 2006-2010, that goes some way to eliminating the "MSSCOTSC variable" and changes your analysis dramatically. Other features of the "MSSCOTSC variable'' is that the Melbourne Storm have the most stripped NRL premierships (2 in total, 100% of stripped NRL premierships), the most stripped NRL minor premierships (3 in total, 100% of stripped NRL minor premierships) as well as 1 stripped World Club Challenges (100% of stripped World Club Challenges). Statistically, the Melbourne Storm have had (at this known stage) only legally won 3 of the 5 grand finals they ‘’won’’ (40% stripped) and lost another 4 grand finals (including 2 during the "MSSCOTSC variable'', one by a record score!), so with 3 legal grand final wins (at this known stage) from 9 attempts, Melbourne Storm legal grand final wins are 33.33%. Hope this helps your analysis in the future Fergy, you may want to re-do your numbers to minimise the "MSSCOTSC variable" on your interesting statistical analysis.
terrance
Guest
I've got a theory why this article needs further investigation but they don't seem to want an alternative opinion. Screen dumps at the ready for an alternative site.
Dogs Boddy
Roar Rookie
I'm sorry Duncan I will have to leave you here. I didn't realise I was riding on the crazy train. I'm going back to rational reality now. Enjoy your meds.
Superspud
Roar Rookie
I know the McIntyre system had it's faults but one thing it did do was give minor premiers a fair reward by having a softer game to get to the prelim.
no one in particular
Roar Guru
And the fact that they don't makes this commentary redundant. A teams true ability is not reflected in their ladder position. The record of 1st vs 2nd is irrelevant if one has had a much stronger strength of schedule then the other. An elementary starting point would be looking at the teams they beat. Did 3rd beat 2nd because they were the better team throughout the season, reflected by the fact their 18 wins came against teams that won 255 games and the second team beat teams that won 235 games
Duncan Smith
Roar Guru
I believe those other eight clubs should be instantly dissolved. Now that the Roosters are representing Sydney, we don't need any other clubs. It's so great that Easts will finally have some juniors. Young kids from Penrith, Cronulla, Bankstown, Strathfield, Hornsby, and Mona Vale will all follow their passionate dream of one day getting to pull on the red, white, and blue of Sydney. Even better that all the hostile rival fans will unite as one when they come together to cheer the mighty Roosters of Sydney. No more Bulldogs, Dragons, or Eels fans fighting each other, we will all cheer our beloved tricolours. Thank you Nick Politis.
Dogs Boddy
Roar Rookie
Or we could call them by their names. Sydney Roosters, Canterbury Bankstown Bulldogs, Wests Tigers, South Sydney Rabbitohs, St George Illawarra Dragons, Cronulla Sutherland Sharks, Penrith Panthers, Parramatta Eels, Manly Warringah Sea Eagles. I did all that without even looking, you seem to be the only one confused by all this.
Tim Buck 3
Roar Rookie
Yes teams don’t play each other team twice as they do in a proper home and away series. They would have to play mid-week games as well as week-end games. Their reserve grade players would get more NRL games. You can't kick out any teams so it's the only way to go.
elvis
Roar Rookie
Nah, it's because in the first part of the season before the ladder shakes itself into order, first is not always the best club, it is just whoever is unbeaten with the best f/a.
terrance
Guest
''go Sydney..."